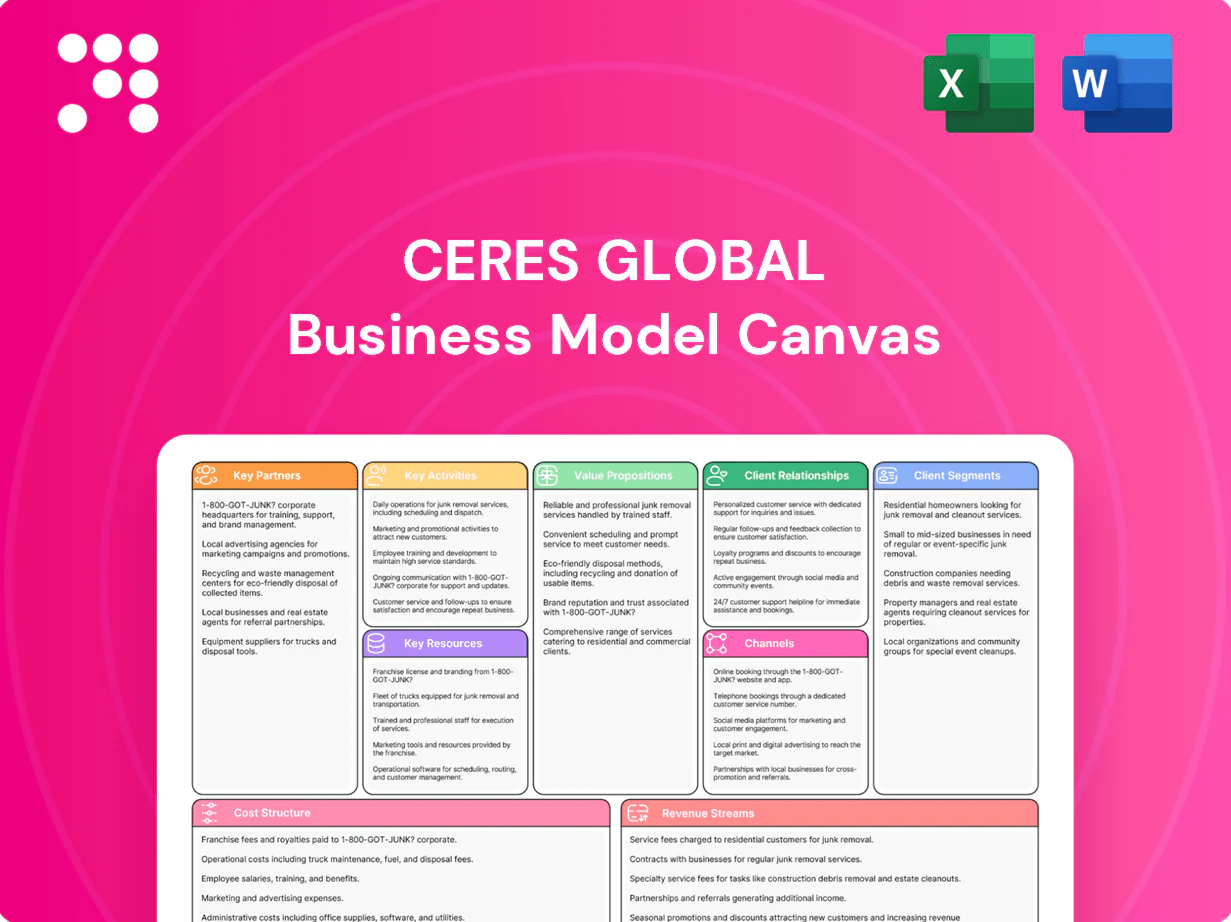
Ceres Global Business Model Canvas

Strategic Business Model Canvas to Benchmark and Scale Your Agribusiness
Unlock the strategic blueprint behind Ceres Global with our in-depth Business Model Canvas. This concise, professionally written file maps value propositions, revenue streams, partnerships and cost structure to reveal how Ceres scales and competes. Ideal for investors, consultants and founders. Download the full Canvas in Word and Excel to benchmark and act.
Partnerships

Producers and farm cooperatives
Core supply relationships with grain and oilseed growers underpin origination volumes and quality, supporting access to a global oilseed pool of roughly 620 million tonnes in 2024. Multi-season agreements improve predictability and reduce spot-market exposure for processors and traders. Cooperative ties enable bundled input and off-take programs that lock in loyalty and capture local cash flow. These partnerships provide timely local intelligence on yield, acreage, and harvest timing.
Rail, barge, trucking, and port operators
Rail, barge, trucking and port operators ensure reliable, cost-effective movement from interior elevators to domestic and export end markets. Priority access and unit-train capabilities (typically 100–120 cars, ~10,000–11,000 t) reduce cycle times and demurrage. Port terminals and stevedores enable blended export programs and scale economies; these alliances are critical to maintain service levels during the 2024 peak harvest months.

Input suppliers for fertilizer and seed
Input suppliers for fertilizer and seed enable Ceres to bundle value-added distribution with grain origination, tapping a global fertilizer market ~USD 195 billion and seed market ~USD 68 billion in 2024; volume-based rebates and joint promotions typically raise margin per customer by a few percentage points. Co-branding and agronomy support improve on-farm yields and customer stickiness, while coordinated inventory planning cuts stockouts and carrying costs.

Banks, FCMs, and insurance providers
Banks and insurers provide credit lines and trade-finance backstops that secure working capital for procurement and inventory; ICC estimated a global trade finance gap of about $1.7 trillion in 2024, underscoring this need. FCMs and clearinghouses supply hedging capacity and margin liquidity; insurance covers cargo, property, and counterparty risks, enabling disciplined risk management and balance-sheet flexibility.
- Credit lines: procurement/inventory support
- FCMs/clearing: hedging & margin liquidity
- Insurance: cargo/property/counterparty
- Outcome: disciplined risk management & balance-sheet flexibility
Compliance, quality, and technology vendors
Third-party labs, inspectors, and certifiers uphold grade, food safety, and sustainability claims; the global food testing market reached about $18.6B in 2024, reinforcing audit-driven procurement. Software providers support ERP, logistics, and risk systems (ERP market ~$50B in 2024), while connectivity to marketplaces and digital freight platforms—≈25% of freight bookings in 2024—widens reach and improves execution. Compliance advisors navigate complex cross-border and phytosanitary rules to reduce detention and rejection risk.
- Third-party labs: certification and testing
- Software: ERP, logistics, risk systems
- Connectivity: marketplace + freight platforms
- Advisors: cross-border and phytosanitary compliance
Integrated origination, logistics and finance secure volumes, cut costs and boost throughput
Core grower contracts, logistics partners, input suppliers and banks/insurers secure volumes, margins and working capital; third‑party labs and software ensure quality, compliance and execution. Multi-season origination and unit-train access cut costs and volatility; bundled inputs and finance raise loyalty and throughput.
| Partner | 2024 metric |
|---|---|
| Global oilseed pool | ~620 Mt |
| Fertilizer market | USD 195B |
| Trade finance gap | USD 1.7T |
What is included in the product
 Detailed Word Document
A comprehensive, pre-written business model tailored to Ceres’ strategy, organized into the 9 classic BMC blocks with full narrative on customer segments, channels, value propositions, revenue streams and operations; includes competitive-advantage analysis, linked SWOT insights, and polished presentation-ready design to support investor pitches, bank funding and idea validation.

 Customizable Excel Spreadsheet
High-level, editable Business Model Canvas that condenses Ceres Global’s strategy into a single shareable page, saving hours of formatting and clarifying core components for faster decision-making; ideal for aligning teams, comparing scenarios, and producing quick executive summaries.
Activities

Origination and procurement
Aggregating grains and oilseeds from producers and local elevators is foundational to Ceres Global’s origination, enabling scale and supply certainty across the 2024 crop year. Structured contracts secure volumes and manage basis risk through fixed-price and basis-only terms. Seasonal programs align price, delivery windows, and quality specs, while data-driven bids in 2024 optimized margins by location and timing.
Storage, handling, and conditioning
Elevators and terminals receive, dry, clean and blend grain to spec, supporting contracted quality standards and traceability across the network. Inventory management optimizes carry to meet seasonal demand while targeting shrink below 1% and turnover aligned to harvest cycles. Efficient throughput systems cut bottlenecks during peak harvests, raising seasonal handling capacity by double-digit percentages. Rigorous safety and preventive maintenance sustain asset uptime above 98%.

Merchandising and market-making
Merchandising and market-making combine active cash and futures trading to capture spreads and arbitrage, with real-time pricing enabling rapid execution and tight risk controls. Basis, carry and freight optimization contribute materially to margins; global agricultural commodity exports were about $1.3 trillion in 2024, underscoring scale and opportunity. Customer segmentation aligns flows to highest-value outlets to maximize contribution per tonne.

Logistics planning and execution
Coordinating railcars, barges, trucks and port slots drives Ceres toward >95% on-time delivery by optimizing modal handoffs; routing and scheduling balance cost, speed and reliability to reduce landed cost per tonne. Freight procurement and backhaul capture 5–12% incremental margin on average, while exception management (real-time alerts, contingency routing) limits service failures and dwell time.
- on-time target: >95%
- backhaul margin: 5–12%
- modal mix: rail/barge/truck/port coordination
- exceptions: real-time alerts & contingency routing
Input distribution and advisory
Input distribution and advisory at Ceres ties fertilizer and seed sales to grain origination, using bundled offers and tailored finance to grow wallet share while delivering agronomic advice that raises yields and customer outcomes. Pre-season planning synchronizes supply with planting calendars, reducing stockouts and optimizing application timing for higher productivity.
- Bundled inputs + finance
- Agronomic advisory
- Pre-season alignment
Origination and terminals drive margins with under 1% shrink, over 98% uptime and over 95% on-time
Origination secures volumes via structured 2024 contracts and seasonal programs, optimizing bids by location to boost margins. Terminals manage drying/blending, targeting <1% shrink and >98% uptime. Merchandising captures basis/carry spreads in a $1.3T 2024 export market. Logistics hits >95% on-time delivery with 5–12% backhaul margin.
| Metric | 2024 Target/Result |
|---|---|
| Shrink | <1% |
| Uptime | >98% |
| On-time | >95% |
| Backhaul margin | 5–12% |
Full Document Unlocks After Purchase
Business Model Canvas
The document you’re previewing is the actual Ceres Global Business Model Canvas, not a mockup or sample; it’s a direct snapshot of the final file you’ll receive. After purchase you’ll get the complete, fully formatted document—ready to edit, present, and share. Available in Word and Excel, it contains all content and pages exactly as shown.

Strategic Business Model Canvas to Benchmark and Scale Your Agribusiness
Unlock the strategic blueprint behind Ceres Global with our in-depth Business Model Canvas. This concise, professionally written file maps value propositions, revenue streams, partnerships and cost structure to reveal how Ceres scales and competes. Ideal for investors, consultants and founders. Download the full Canvas in Word and Excel to benchmark and act.
Partnerships
Producers and farm cooperatives
Core supply relationships with grain and oilseed growers underpin origination volumes and quality, supporting access to a global oilseed pool of roughly 620 million tonnes in 2024. Multi-season agreements improve predictability and reduce spot-market exposure for processors and traders. Cooperative ties enable bundled input and off-take programs that lock in loyalty and capture local cash flow. These partnerships provide timely local intelligence on yield, acreage, and harvest timing.
Rail, barge, trucking, and port operators
Rail, barge, trucking and port operators ensure reliable, cost-effective movement from interior elevators to domestic and export end markets. Priority access and unit-train capabilities (typically 100–120 cars, ~10,000–11,000 t) reduce cycle times and demurrage. Port terminals and stevedores enable blended export programs and scale economies; these alliances are critical to maintain service levels during the 2024 peak harvest months.
Input suppliers for fertilizer and seed
Input suppliers for fertilizer and seed enable Ceres to bundle value-added distribution with grain origination, tapping a global fertilizer market ~USD 195 billion and seed market ~USD 68 billion in 2024; volume-based rebates and joint promotions typically raise margin per customer by a few percentage points. Co-branding and agronomy support improve on-farm yields and customer stickiness, while coordinated inventory planning cuts stockouts and carrying costs.
Banks, FCMs, and insurance providers
Banks and insurers provide credit lines and trade-finance backstops that secure working capital for procurement and inventory; ICC estimated a global trade finance gap of about $1.7 trillion in 2024, underscoring this need. FCMs and clearinghouses supply hedging capacity and margin liquidity; insurance covers cargo, property, and counterparty risks, enabling disciplined risk management and balance-sheet flexibility.
- Credit lines: procurement/inventory support
- FCMs/clearing: hedging & margin liquidity
- Insurance: cargo/property/counterparty
- Outcome: disciplined risk management & balance-sheet flexibility
Compliance, quality, and technology vendors
Third-party labs, inspectors, and certifiers uphold grade, food safety, and sustainability claims; the global food testing market reached about $18.6B in 2024, reinforcing audit-driven procurement. Software providers support ERP, logistics, and risk systems (ERP market ~$50B in 2024), while connectivity to marketplaces and digital freight platforms—≈25% of freight bookings in 2024—widens reach and improves execution. Compliance advisors navigate complex cross-border and phytosanitary rules to reduce detention and rejection risk.
- Third-party labs: certification and testing
- Software: ERP, logistics, risk systems
- Connectivity: marketplace + freight platforms
- Advisors: cross-border and phytosanitary compliance
Integrated origination, logistics and finance secure volumes, cut costs and boost throughput
Core grower contracts, logistics partners, input suppliers and banks/insurers secure volumes, margins and working capital; third‑party labs and software ensure quality, compliance and execution. Multi-season origination and unit-train access cut costs and volatility; bundled inputs and finance raise loyalty and throughput.
| Partner | 2024 metric |
|---|---|
| Global oilseed pool | ~620 Mt |
| Fertilizer market | USD 195B |
| Trade finance gap | USD 1.7T |
What is included in the product
Detailed Word Document
A comprehensive, pre-written business model tailored to Ceres’ strategy, organized into the 9 classic BMC blocks with full narrative on customer segments, channels, value propositions, revenue streams and operations; includes competitive-advantage analysis, linked SWOT insights, and polished presentation-ready design to support investor pitches, bank funding and idea validation.
Customizable Excel Spreadsheet
High-level, editable Business Model Canvas that condenses Ceres Global’s strategy into a single shareable page, saving hours of formatting and clarifying core components for faster decision-making; ideal for aligning teams, comparing scenarios, and producing quick executive summaries.
Activities
Origination and procurement
Aggregating grains and oilseeds from producers and local elevators is foundational to Ceres Global’s origination, enabling scale and supply certainty across the 2024 crop year. Structured contracts secure volumes and manage basis risk through fixed-price and basis-only terms. Seasonal programs align price, delivery windows, and quality specs, while data-driven bids in 2024 optimized margins by location and timing.
Storage, handling, and conditioning
Elevators and terminals receive, dry, clean and blend grain to spec, supporting contracted quality standards and traceability across the network. Inventory management optimizes carry to meet seasonal demand while targeting shrink below 1% and turnover aligned to harvest cycles. Efficient throughput systems cut bottlenecks during peak harvests, raising seasonal handling capacity by double-digit percentages. Rigorous safety and preventive maintenance sustain asset uptime above 98%.
Merchandising and market-making
Merchandising and market-making combine active cash and futures trading to capture spreads and arbitrage, with real-time pricing enabling rapid execution and tight risk controls. Basis, carry and freight optimization contribute materially to margins; global agricultural commodity exports were about $1.3 trillion in 2024, underscoring scale and opportunity. Customer segmentation aligns flows to highest-value outlets to maximize contribution per tonne.
Logistics planning and execution
Coordinating railcars, barges, trucks and port slots drives Ceres toward >95% on-time delivery by optimizing modal handoffs; routing and scheduling balance cost, speed and reliability to reduce landed cost per tonne. Freight procurement and backhaul capture 5–12% incremental margin on average, while exception management (real-time alerts, contingency routing) limits service failures and dwell time.
- on-time target: >95%
- backhaul margin: 5–12%
- modal mix: rail/barge/truck/port coordination
- exceptions: real-time alerts & contingency routing
Input distribution and advisory
Input distribution and advisory at Ceres ties fertilizer and seed sales to grain origination, using bundled offers and tailored finance to grow wallet share while delivering agronomic advice that raises yields and customer outcomes. Pre-season planning synchronizes supply with planting calendars, reducing stockouts and optimizing application timing for higher productivity.
- Bundled inputs + finance
- Agronomic advisory
- Pre-season alignment
Origination and terminals drive margins with under 1% shrink, over 98% uptime and over 95% on-time
Origination secures volumes via structured 2024 contracts and seasonal programs, optimizing bids by location to boost margins. Terminals manage drying/blending, targeting <1% shrink and >98% uptime. Merchandising captures basis/carry spreads in a $1.3T 2024 export market. Logistics hits >95% on-time delivery with 5–12% backhaul margin.
| Metric | 2024 Target/Result |
|---|---|
| Shrink | <1% |
| Uptime | >98% |
| On-time | >95% |
| Backhaul margin | 5–12% |
Full Document Unlocks After Purchase
Business Model Canvas
The document you’re previewing is the actual Ceres Global Business Model Canvas, not a mockup or sample; it’s a direct snapshot of the final file you’ll receive. After purchase you’ll get the complete, fully formatted document—ready to edit, present, and share. Available in Word and Excel, it contains all content and pages exactly as shown.
Original: $10.00
-65%$10.00
$3.50Description
Strategic Business Model Canvas to Benchmark and Scale Your Agribusiness
Unlock the strategic blueprint behind Ceres Global with our in-depth Business Model Canvas. This concise, professionally written file maps value propositions, revenue streams, partnerships and cost structure to reveal how Ceres scales and competes. Ideal for investors, consultants and founders. Download the full Canvas in Word and Excel to benchmark and act.
Partnerships
Producers and farm cooperatives
Core supply relationships with grain and oilseed growers underpin origination volumes and quality, supporting access to a global oilseed pool of roughly 620 million tonnes in 2024. Multi-season agreements improve predictability and reduce spot-market exposure for processors and traders. Cooperative ties enable bundled input and off-take programs that lock in loyalty and capture local cash flow. These partnerships provide timely local intelligence on yield, acreage, and harvest timing.
Rail, barge, trucking, and port operators
Rail, barge, trucking and port operators ensure reliable, cost-effective movement from interior elevators to domestic and export end markets. Priority access and unit-train capabilities (typically 100–120 cars, ~10,000–11,000 t) reduce cycle times and demurrage. Port terminals and stevedores enable blended export programs and scale economies; these alliances are critical to maintain service levels during the 2024 peak harvest months.
Input suppliers for fertilizer and seed
Input suppliers for fertilizer and seed enable Ceres to bundle value-added distribution with grain origination, tapping a global fertilizer market ~USD 195 billion and seed market ~USD 68 billion in 2024; volume-based rebates and joint promotions typically raise margin per customer by a few percentage points. Co-branding and agronomy support improve on-farm yields and customer stickiness, while coordinated inventory planning cuts stockouts and carrying costs.
Banks, FCMs, and insurance providers
Banks and insurers provide credit lines and trade-finance backstops that secure working capital for procurement and inventory; ICC estimated a global trade finance gap of about $1.7 trillion in 2024, underscoring this need. FCMs and clearinghouses supply hedging capacity and margin liquidity; insurance covers cargo, property, and counterparty risks, enabling disciplined risk management and balance-sheet flexibility.
- Credit lines: procurement/inventory support
- FCMs/clearing: hedging & margin liquidity
- Insurance: cargo/property/counterparty
- Outcome: disciplined risk management & balance-sheet flexibility
Compliance, quality, and technology vendors
Third-party labs, inspectors, and certifiers uphold grade, food safety, and sustainability claims; the global food testing market reached about $18.6B in 2024, reinforcing audit-driven procurement. Software providers support ERP, logistics, and risk systems (ERP market ~$50B in 2024), while connectivity to marketplaces and digital freight platforms—≈25% of freight bookings in 2024—widens reach and improves execution. Compliance advisors navigate complex cross-border and phytosanitary rules to reduce detention and rejection risk.
- Third-party labs: certification and testing
- Software: ERP, logistics, risk systems
- Connectivity: marketplace + freight platforms
- Advisors: cross-border and phytosanitary compliance
Integrated origination, logistics and finance secure volumes, cut costs and boost throughput
Core grower contracts, logistics partners, input suppliers and banks/insurers secure volumes, margins and working capital; third‑party labs and software ensure quality, compliance and execution. Multi-season origination and unit-train access cut costs and volatility; bundled inputs and finance raise loyalty and throughput.
| Partner | 2024 metric |
|---|---|
| Global oilseed pool | ~620 Mt |
| Fertilizer market | USD 195B |
| Trade finance gap | USD 1.7T |
What is included in the product
Detailed Word Document
A comprehensive, pre-written business model tailored to Ceres’ strategy, organized into the 9 classic BMC blocks with full narrative on customer segments, channels, value propositions, revenue streams and operations; includes competitive-advantage analysis, linked SWOT insights, and polished presentation-ready design to support investor pitches, bank funding and idea validation.
Customizable Excel Spreadsheet
High-level, editable Business Model Canvas that condenses Ceres Global’s strategy into a single shareable page, saving hours of formatting and clarifying core components for faster decision-making; ideal for aligning teams, comparing scenarios, and producing quick executive summaries.
Activities
Origination and procurement
Aggregating grains and oilseeds from producers and local elevators is foundational to Ceres Global’s origination, enabling scale and supply certainty across the 2024 crop year. Structured contracts secure volumes and manage basis risk through fixed-price and basis-only terms. Seasonal programs align price, delivery windows, and quality specs, while data-driven bids in 2024 optimized margins by location and timing.
Storage, handling, and conditioning
Elevators and terminals receive, dry, clean and blend grain to spec, supporting contracted quality standards and traceability across the network. Inventory management optimizes carry to meet seasonal demand while targeting shrink below 1% and turnover aligned to harvest cycles. Efficient throughput systems cut bottlenecks during peak harvests, raising seasonal handling capacity by double-digit percentages. Rigorous safety and preventive maintenance sustain asset uptime above 98%.
Merchandising and market-making
Merchandising and market-making combine active cash and futures trading to capture spreads and arbitrage, with real-time pricing enabling rapid execution and tight risk controls. Basis, carry and freight optimization contribute materially to margins; global agricultural commodity exports were about $1.3 trillion in 2024, underscoring scale and opportunity. Customer segmentation aligns flows to highest-value outlets to maximize contribution per tonne.
Logistics planning and execution
Coordinating railcars, barges, trucks and port slots drives Ceres toward >95% on-time delivery by optimizing modal handoffs; routing and scheduling balance cost, speed and reliability to reduce landed cost per tonne. Freight procurement and backhaul capture 5–12% incremental margin on average, while exception management (real-time alerts, contingency routing) limits service failures and dwell time.
- on-time target: >95%
- backhaul margin: 5–12%
- modal mix: rail/barge/truck/port coordination
- exceptions: real-time alerts & contingency routing
Input distribution and advisory
Input distribution and advisory at Ceres ties fertilizer and seed sales to grain origination, using bundled offers and tailored finance to grow wallet share while delivering agronomic advice that raises yields and customer outcomes. Pre-season planning synchronizes supply with planting calendars, reducing stockouts and optimizing application timing for higher productivity.
- Bundled inputs + finance
- Agronomic advisory
- Pre-season alignment
Origination and terminals drive margins with under 1% shrink, over 98% uptime and over 95% on-time
Origination secures volumes via structured 2024 contracts and seasonal programs, optimizing bids by location to boost margins. Terminals manage drying/blending, targeting <1% shrink and >98% uptime. Merchandising captures basis/carry spreads in a $1.3T 2024 export market. Logistics hits >95% on-time delivery with 5–12% backhaul margin.
| Metric | 2024 Target/Result |
|---|---|
| Shrink | <1% |
| Uptime | >98% |
| On-time | >95% |
| Backhaul margin | 5–12% |
Full Document Unlocks After Purchase
Business Model Canvas
The document you’re previewing is the actual Ceres Global Business Model Canvas, not a mockup or sample; it’s a direct snapshot of the final file you’ll receive. After purchase you’ll get the complete, fully formatted document—ready to edit, present, and share. Available in Word and Excel, it contains all content and pages exactly as shown.











