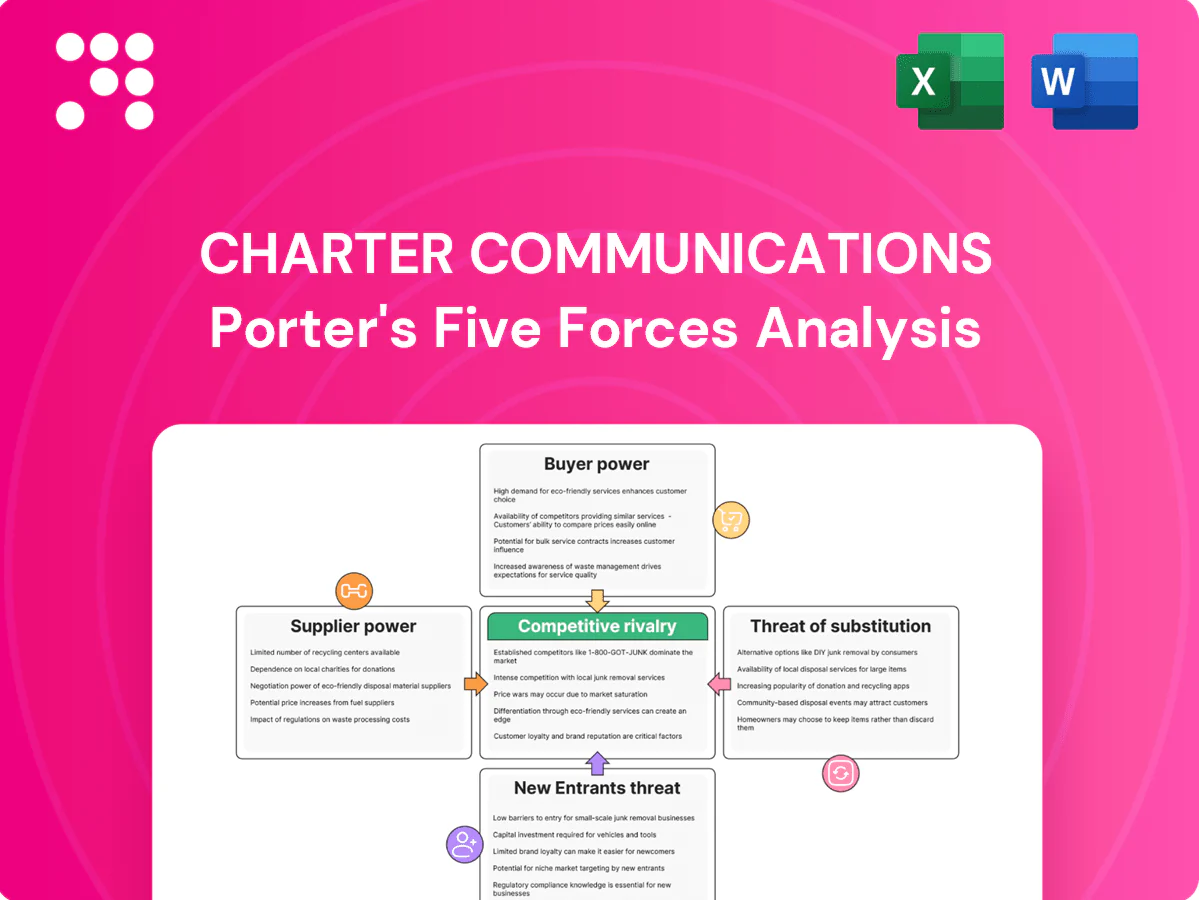
Charter Communications Porter's Five Forces Analysis

Go Beyond the Preview—Access the Full Strategic Report
Charter Communications faces moderate buyer power, rising substitute threats from streaming, and significant scale-driven supplier and rival pressure—factors shaping margins and growth. This brief snapshot only scratches the surface. Unlock the full Porter's Five Forces Analysis to explore Charter’s competitive dynamics and strategic implications in depth.
Suppliers Bargaining Power

Concentrated network equipment vendors
Charter relies on a concentrated set of DOCSIS, optical and CPE vendors, which concentrates bargaining power with suppliers and raises supplier leverage over pricing and lead times.
Certification, interoperability and long qualification cycles create high switching costs and slow vendor replacement for Charter, which serves over 30 million residential and business customers.
Global semiconductor and optical tightness has historically extended lead times and pressured prices; Charter mitigates risk through multi-sourcing and scale-based volume commitments with key suppliers.
Powerful content programmers
Major programmers like Disney, Comcast/NBCUniversal and Warner Bros. Discovery control must-have channels and sports, enabling carriage-fee increases and onerous terms; retransmission and streaming rights disputes have led to high-profile blackouts that force concessions. Cord-cutting (US pay-TV subs fell roughly 10% YoY by 2023) reduces exposure but remaining video subs are higher-value, while bundled negotiations (linear plus OTT apps) partially rebalance leverage.

Access to poles, conduits, and rights-of-way
Utilities and municipalities control pole-attachment and make-ready rules, affecting timelines and costs; delays increase deployment time and raise capex. One-touch make-ready and FCC/state oversight have reduced friction, but local variance and permitting still cause hold-ups. Charter, serving over 30 million broadband customers, benefits from scale and established franchises that lower but do not eliminate supplier dependency. Annual capex remains in the high single-digit billions.

Backbone, transit, and interconnection partners
Peering cuts transit costs for Charter but reliance on major transit/CDN partners can affect latency, performance, and contract terms as traffic growth and asymmetric upstream/downstream flows complicate negotiations; redundant routes and private peering improve resilience, so supplier power is moderate given multiple alternative providers.
- Dependence: major transit/CDN partners
- Cost mitigation: peering/private interconnect
- Risk: asymmetric traffic complicates terms
- Resilience: redundant routes/private peering
- Overall: moderate supplier power
Skilled labor and contractors
Skilled construction, fiber splicing, and field technician labor tighten during Charter large-build cycles, with 2024 capex near 6.5 billion increasing demand for crews; contractor scarcity and wage inflation (telecom installer median wages around 36.50 per hour in 2023) elevate costs and extend timelines. Workforce training and multi-year contracts reduce volatility, while concurrent public-funded fiber projects intensify competition for crews.
- High demand: 2024 capex ~6.5B
- Wage pressure: median ~36.50/hr (2023)
- Mitigation: training and long-term contracts
MSO faces concentrated supplier leverage, high switching costs; $6.5B capex
Charter faces elevated supplier leverage from concentrated DOCSIS/optical/CPE vendors and must-have programmers, creating high switching costs and periodic carriage/retransmission pressure. Global component tightness and contractor scarcity raise lead times and costs despite multi-sourcing and long-term agreements. 2024 capex ~6.5B supports scale advantages but supplier power remains moderate-to-high.
| Metric | Value |
|---|---|
| Broadband customers | over 30M |
| 2024 capex | ~6.5B |
| Installer wage (2023 median) | $36.50/hr |
| Supplier power | Moderate–High |
What is included in the product
 Detailed Word Document
Concise Porter’s Five Forces analysis of Charter Communications that highlights competitive rivalry, buyer and supplier power, threats from substitutes and new entrants, and strategic levers to protect market share and margins.

 Customizable Excel Spreadsheet
One-sheet Porter’s Five Forces for Charter Communications—instantly visualize competitive pressure with a spider chart and tweak force levels for regulatory shifts or new entrants, ready to drop into pitch decks. No macros, simple labels, and copy-ready layout make it ideal for fast boardroom decisions or deeper integration into your financial dashboards.
Customers Bargaining Power

Rising alternatives in overlap markets
Where fiber or 5G FWA is available, customers gain leverage through choice, with fiber/5G overlap reaching about 35–45% of households in major US metros in 2024. Competing offers drive aggressive price-matching and promotions, squeezing ARPU and raising churn risk. Performance parity at common tiers erodes differentiation. Buyer power peaks in dense competitive footprints.
Bundles and switching costs
Multi-product bundles, self-install hardware and integrated in-home Wi‑Fi setups create meaningful switching friction for Charter (Spectrum), which served roughly 32 million residential customers in 2024, anchoring retention. Email accounts, leased equipment and contract terms add inertia, raising effective switching costs. Aggressive buyout promotions and third‑party overbuilders, however, erode those barriers. Stickiness is significant but not absolute.

Price sensitivity and promotions
Consumers—especially lower-income segments—are highly deal-seeking; Charter reported about 32.7 million residential customers in 2024, making promo-driven churn materially impactful. Introductory pricing and ACP replacement offers (around 23 million households enrolled nationwide in 2024) shape acquisition and demand. Post-promo price step-ups raise churn risk, while transparent flat-rate plans can reduce dissatisfaction.

Enterprise and public sector procurement
Enterprise and public sector customers drive strong bargaining power: large accounts use formal RFPs and multi-year contracts to secure tight SLAs and lower pricing; dual-sourcing and supplier diversity mandates further boost buyer leverage; Charter often absorbs margin on custom fiber builds in exchange for long tenure, while selling vertical solutions shifts negotiations away from pure price competition.
- RFPs/multi-year contracts
- Dual-sourcing & diversity rules
- Fiber builds trade margin for tenure
- Vertical solutions reduce price focus
Churn and service quality expectations
Buyers react quickly to outages, speed shortfalls, and Wi‑Fi issues, driving churn that pressures pricing and retention costs; Charter reported 2024 revenue of 58.9 billion USD while investing in network resilience. Superior customer care and managed Wi‑Fi have cut churn rates materially, and performance marketing plus satisfaction scores steer bargaining dynamics. A reported 5‑point NPS gain in 2024 translated into measurable reduction in buyer leverage.
- Buyers: rapid churn on outages
- Care/Wi‑Fi: reduces churn
- Marketing & satisfaction: shift bargaining
- NPS +5 (2024): lowers buyer power
Fiber/5G overlap 35–45% drives promo churn and ARPU pressure
Customer bargaining is high where fiber/5G overlap reaches 35–45% in major metros (2024), driving promo-driven churn and ARPU pressure. Charter's bundled friction and 32.7 million residential subs (2024) raise switching costs but are weakened by buyouts and overbuilders. ACP reach (~23M households) and promo cycling amplify deal-seeking; Charter revenue was 58.9B USD (2024) and NPS +5 reduced churn.
| Metric | 2024 Value |
|---|---|
| Fiber/5G overlap | 35–45% |
| Residential subs | 32.7M |
| ACP reach | ~23M households |
| Revenue | 58.9B USD |
| NPS change | +5 pts |
Full Version Awaits
Charter Communications Porter's Five Forces Analysis
This preview displays the complete Charter Communications Porter's Five Forces analysis — the exact, fully formatted document you will receive after purchase. There are no placeholders or samples; the file shown is the final deliverable. Upon payment you’ll get instant access to download and use this same analysis.

Go Beyond the Preview—Access the Full Strategic Report
Charter Communications faces moderate buyer power, rising substitute threats from streaming, and significant scale-driven supplier and rival pressure—factors shaping margins and growth. This brief snapshot only scratches the surface. Unlock the full Porter's Five Forces Analysis to explore Charter’s competitive dynamics and strategic implications in depth.
Suppliers Bargaining Power
Concentrated network equipment vendors
Charter relies on a concentrated set of DOCSIS, optical and CPE vendors, which concentrates bargaining power with suppliers and raises supplier leverage over pricing and lead times.
Certification, interoperability and long qualification cycles create high switching costs and slow vendor replacement for Charter, which serves over 30 million residential and business customers.
Global semiconductor and optical tightness has historically extended lead times and pressured prices; Charter mitigates risk through multi-sourcing and scale-based volume commitments with key suppliers.
Powerful content programmers
Major programmers like Disney, Comcast/NBCUniversal and Warner Bros. Discovery control must-have channels and sports, enabling carriage-fee increases and onerous terms; retransmission and streaming rights disputes have led to high-profile blackouts that force concessions. Cord-cutting (US pay-TV subs fell roughly 10% YoY by 2023) reduces exposure but remaining video subs are higher-value, while bundled negotiations (linear plus OTT apps) partially rebalance leverage.
Access to poles, conduits, and rights-of-way
Utilities and municipalities control pole-attachment and make-ready rules, affecting timelines and costs; delays increase deployment time and raise capex. One-touch make-ready and FCC/state oversight have reduced friction, but local variance and permitting still cause hold-ups. Charter, serving over 30 million broadband customers, benefits from scale and established franchises that lower but do not eliminate supplier dependency. Annual capex remains in the high single-digit billions.
Backbone, transit, and interconnection partners
Peering cuts transit costs for Charter but reliance on major transit/CDN partners can affect latency, performance, and contract terms as traffic growth and asymmetric upstream/downstream flows complicate negotiations; redundant routes and private peering improve resilience, so supplier power is moderate given multiple alternative providers.
- Dependence: major transit/CDN partners
- Cost mitigation: peering/private interconnect
- Risk: asymmetric traffic complicates terms
- Resilience: redundant routes/private peering
- Overall: moderate supplier power
Skilled labor and contractors
Skilled construction, fiber splicing, and field technician labor tighten during Charter large-build cycles, with 2024 capex near 6.5 billion increasing demand for crews; contractor scarcity and wage inflation (telecom installer median wages around 36.50 per hour in 2023) elevate costs and extend timelines. Workforce training and multi-year contracts reduce volatility, while concurrent public-funded fiber projects intensify competition for crews.
- High demand: 2024 capex ~6.5B
- Wage pressure: median ~36.50/hr (2023)
- Mitigation: training and long-term contracts
MSO faces concentrated supplier leverage, high switching costs; $6.5B capex
Charter faces elevated supplier leverage from concentrated DOCSIS/optical/CPE vendors and must-have programmers, creating high switching costs and periodic carriage/retransmission pressure. Global component tightness and contractor scarcity raise lead times and costs despite multi-sourcing and long-term agreements. 2024 capex ~6.5B supports scale advantages but supplier power remains moderate-to-high.
| Metric | Value |
|---|---|
| Broadband customers | over 30M |
| 2024 capex | ~6.5B |
| Installer wage (2023 median) | $36.50/hr |
| Supplier power | Moderate–High |
What is included in the product
Detailed Word Document
Concise Porter’s Five Forces analysis of Charter Communications that highlights competitive rivalry, buyer and supplier power, threats from substitutes and new entrants, and strategic levers to protect market share and margins.
Customizable Excel Spreadsheet
One-sheet Porter’s Five Forces for Charter Communications—instantly visualize competitive pressure with a spider chart and tweak force levels for regulatory shifts or new entrants, ready to drop into pitch decks. No macros, simple labels, and copy-ready layout make it ideal for fast boardroom decisions or deeper integration into your financial dashboards.
Customers Bargaining Power
Rising alternatives in overlap markets
Where fiber or 5G FWA is available, customers gain leverage through choice, with fiber/5G overlap reaching about 35–45% of households in major US metros in 2024. Competing offers drive aggressive price-matching and promotions, squeezing ARPU and raising churn risk. Performance parity at common tiers erodes differentiation. Buyer power peaks in dense competitive footprints.
Bundles and switching costs
Multi-product bundles, self-install hardware and integrated in-home Wi‑Fi setups create meaningful switching friction for Charter (Spectrum), which served roughly 32 million residential customers in 2024, anchoring retention. Email accounts, leased equipment and contract terms add inertia, raising effective switching costs. Aggressive buyout promotions and third‑party overbuilders, however, erode those barriers. Stickiness is significant but not absolute.
Price sensitivity and promotions
Consumers—especially lower-income segments—are highly deal-seeking; Charter reported about 32.7 million residential customers in 2024, making promo-driven churn materially impactful. Introductory pricing and ACP replacement offers (around 23 million households enrolled nationwide in 2024) shape acquisition and demand. Post-promo price step-ups raise churn risk, while transparent flat-rate plans can reduce dissatisfaction.
Enterprise and public sector procurement
Enterprise and public sector customers drive strong bargaining power: large accounts use formal RFPs and multi-year contracts to secure tight SLAs and lower pricing; dual-sourcing and supplier diversity mandates further boost buyer leverage; Charter often absorbs margin on custom fiber builds in exchange for long tenure, while selling vertical solutions shifts negotiations away from pure price competition.
- RFPs/multi-year contracts
- Dual-sourcing & diversity rules
- Fiber builds trade margin for tenure
- Vertical solutions reduce price focus
Churn and service quality expectations
Buyers react quickly to outages, speed shortfalls, and Wi‑Fi issues, driving churn that pressures pricing and retention costs; Charter reported 2024 revenue of 58.9 billion USD while investing in network resilience. Superior customer care and managed Wi‑Fi have cut churn rates materially, and performance marketing plus satisfaction scores steer bargaining dynamics. A reported 5‑point NPS gain in 2024 translated into measurable reduction in buyer leverage.
- Buyers: rapid churn on outages
- Care/Wi‑Fi: reduces churn
- Marketing & satisfaction: shift bargaining
- NPS +5 (2024): lowers buyer power
Fiber/5G overlap 35–45% drives promo churn and ARPU pressure
Customer bargaining is high where fiber/5G overlap reaches 35–45% in major metros (2024), driving promo-driven churn and ARPU pressure. Charter's bundled friction and 32.7 million residential subs (2024) raise switching costs but are weakened by buyouts and overbuilders. ACP reach (~23M households) and promo cycling amplify deal-seeking; Charter revenue was 58.9B USD (2024) and NPS +5 reduced churn.
| Metric | 2024 Value |
|---|---|
| Fiber/5G overlap | 35–45% |
| Residential subs | 32.7M |
| ACP reach | ~23M households |
| Revenue | 58.9B USD |
| NPS change | +5 pts |
Full Version Awaits
Charter Communications Porter's Five Forces Analysis
This preview displays the complete Charter Communications Porter's Five Forces analysis — the exact, fully formatted document you will receive after purchase. There are no placeholders or samples; the file shown is the final deliverable. Upon payment you’ll get instant access to download and use this same analysis.
Original: $10.00
-65%$10.00
$3.50Description
Go Beyond the Preview—Access the Full Strategic Report
Charter Communications faces moderate buyer power, rising substitute threats from streaming, and significant scale-driven supplier and rival pressure—factors shaping margins and growth. This brief snapshot only scratches the surface. Unlock the full Porter's Five Forces Analysis to explore Charter’s competitive dynamics and strategic implications in depth.
Suppliers Bargaining Power
Concentrated network equipment vendors
Charter relies on a concentrated set of DOCSIS, optical and CPE vendors, which concentrates bargaining power with suppliers and raises supplier leverage over pricing and lead times.
Certification, interoperability and long qualification cycles create high switching costs and slow vendor replacement for Charter, which serves over 30 million residential and business customers.
Global semiconductor and optical tightness has historically extended lead times and pressured prices; Charter mitigates risk through multi-sourcing and scale-based volume commitments with key suppliers.
Powerful content programmers
Major programmers like Disney, Comcast/NBCUniversal and Warner Bros. Discovery control must-have channels and sports, enabling carriage-fee increases and onerous terms; retransmission and streaming rights disputes have led to high-profile blackouts that force concessions. Cord-cutting (US pay-TV subs fell roughly 10% YoY by 2023) reduces exposure but remaining video subs are higher-value, while bundled negotiations (linear plus OTT apps) partially rebalance leverage.
Access to poles, conduits, and rights-of-way
Utilities and municipalities control pole-attachment and make-ready rules, affecting timelines and costs; delays increase deployment time and raise capex. One-touch make-ready and FCC/state oversight have reduced friction, but local variance and permitting still cause hold-ups. Charter, serving over 30 million broadband customers, benefits from scale and established franchises that lower but do not eliminate supplier dependency. Annual capex remains in the high single-digit billions.
Backbone, transit, and interconnection partners
Peering cuts transit costs for Charter but reliance on major transit/CDN partners can affect latency, performance, and contract terms as traffic growth and asymmetric upstream/downstream flows complicate negotiations; redundant routes and private peering improve resilience, so supplier power is moderate given multiple alternative providers.
- Dependence: major transit/CDN partners
- Cost mitigation: peering/private interconnect
- Risk: asymmetric traffic complicates terms
- Resilience: redundant routes/private peering
- Overall: moderate supplier power
Skilled labor and contractors
Skilled construction, fiber splicing, and field technician labor tighten during Charter large-build cycles, with 2024 capex near 6.5 billion increasing demand for crews; contractor scarcity and wage inflation (telecom installer median wages around 36.50 per hour in 2023) elevate costs and extend timelines. Workforce training and multi-year contracts reduce volatility, while concurrent public-funded fiber projects intensify competition for crews.
- High demand: 2024 capex ~6.5B
- Wage pressure: median ~36.50/hr (2023)
- Mitigation: training and long-term contracts
MSO faces concentrated supplier leverage, high switching costs; $6.5B capex
Charter faces elevated supplier leverage from concentrated DOCSIS/optical/CPE vendors and must-have programmers, creating high switching costs and periodic carriage/retransmission pressure. Global component tightness and contractor scarcity raise lead times and costs despite multi-sourcing and long-term agreements. 2024 capex ~6.5B supports scale advantages but supplier power remains moderate-to-high.
| Metric | Value |
|---|---|
| Broadband customers | over 30M |
| 2024 capex | ~6.5B |
| Installer wage (2023 median) | $36.50/hr |
| Supplier power | Moderate–High |
What is included in the product
Detailed Word Document
Concise Porter’s Five Forces analysis of Charter Communications that highlights competitive rivalry, buyer and supplier power, threats from substitutes and new entrants, and strategic levers to protect market share and margins.
Customizable Excel Spreadsheet
One-sheet Porter’s Five Forces for Charter Communications—instantly visualize competitive pressure with a spider chart and tweak force levels for regulatory shifts or new entrants, ready to drop into pitch decks. No macros, simple labels, and copy-ready layout make it ideal for fast boardroom decisions or deeper integration into your financial dashboards.
Customers Bargaining Power
Rising alternatives in overlap markets
Where fiber or 5G FWA is available, customers gain leverage through choice, with fiber/5G overlap reaching about 35–45% of households in major US metros in 2024. Competing offers drive aggressive price-matching and promotions, squeezing ARPU and raising churn risk. Performance parity at common tiers erodes differentiation. Buyer power peaks in dense competitive footprints.
Bundles and switching costs
Multi-product bundles, self-install hardware and integrated in-home Wi‑Fi setups create meaningful switching friction for Charter (Spectrum), which served roughly 32 million residential customers in 2024, anchoring retention. Email accounts, leased equipment and contract terms add inertia, raising effective switching costs. Aggressive buyout promotions and third‑party overbuilders, however, erode those barriers. Stickiness is significant but not absolute.
Price sensitivity and promotions
Consumers—especially lower-income segments—are highly deal-seeking; Charter reported about 32.7 million residential customers in 2024, making promo-driven churn materially impactful. Introductory pricing and ACP replacement offers (around 23 million households enrolled nationwide in 2024) shape acquisition and demand. Post-promo price step-ups raise churn risk, while transparent flat-rate plans can reduce dissatisfaction.
Enterprise and public sector procurement
Enterprise and public sector customers drive strong bargaining power: large accounts use formal RFPs and multi-year contracts to secure tight SLAs and lower pricing; dual-sourcing and supplier diversity mandates further boost buyer leverage; Charter often absorbs margin on custom fiber builds in exchange for long tenure, while selling vertical solutions shifts negotiations away from pure price competition.
- RFPs/multi-year contracts
- Dual-sourcing & diversity rules
- Fiber builds trade margin for tenure
- Vertical solutions reduce price focus
Churn and service quality expectations
Buyers react quickly to outages, speed shortfalls, and Wi‑Fi issues, driving churn that pressures pricing and retention costs; Charter reported 2024 revenue of 58.9 billion USD while investing in network resilience. Superior customer care and managed Wi‑Fi have cut churn rates materially, and performance marketing plus satisfaction scores steer bargaining dynamics. A reported 5‑point NPS gain in 2024 translated into measurable reduction in buyer leverage.
- Buyers: rapid churn on outages
- Care/Wi‑Fi: reduces churn
- Marketing & satisfaction: shift bargaining
- NPS +5 (2024): lowers buyer power
Fiber/5G overlap 35–45% drives promo churn and ARPU pressure
Customer bargaining is high where fiber/5G overlap reaches 35–45% in major metros (2024), driving promo-driven churn and ARPU pressure. Charter's bundled friction and 32.7 million residential subs (2024) raise switching costs but are weakened by buyouts and overbuilders. ACP reach (~23M households) and promo cycling amplify deal-seeking; Charter revenue was 58.9B USD (2024) and NPS +5 reduced churn.
| Metric | 2024 Value |
|---|---|
| Fiber/5G overlap | 35–45% |
| Residential subs | 32.7M |
| ACP reach | ~23M households |
| Revenue | 58.9B USD |
| NPS change | +5 pts |
Full Version Awaits
Charter Communications Porter's Five Forces Analysis
This preview displays the complete Charter Communications Porter's Five Forces analysis — the exact, fully formatted document you will receive after purchase. There are no placeholders or samples; the file shown is the final deliverable. Upon payment you’ll get instant access to download and use this same analysis.











