Cheil Boston Consulting Group Matrix

See the Bigger Picture
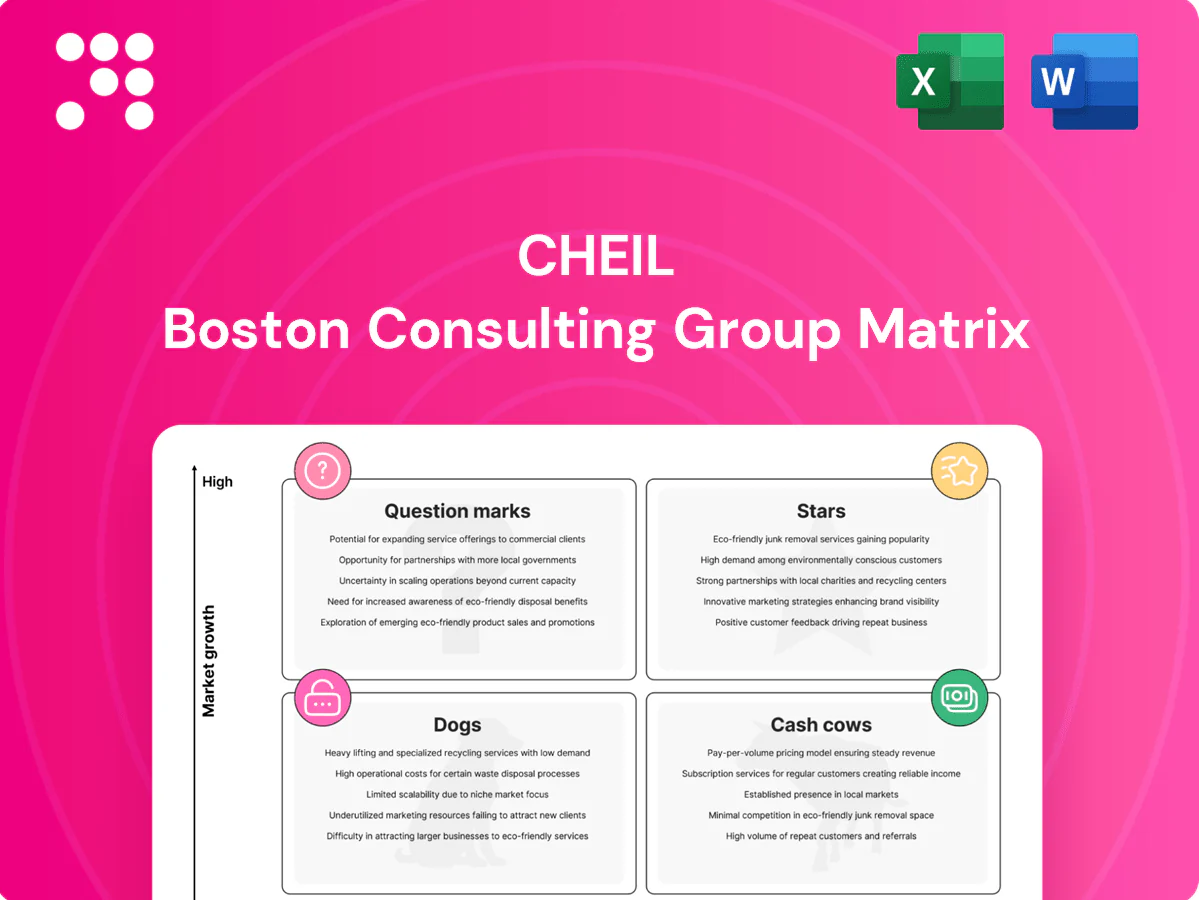
Curious where Cheil’s offerings sit in the market mix—Stars, Cash Cows, Dogs, or Question Marks? This snapshot teases the answers, but the full Cheil BCG Matrix gives you quadrant-by-quadrant placement, data-backed takeaways, and clear moves to allocate capital and resources smarter. Buy the complete report for a Word deep-dive plus an Excel summary you can present or act on immediately. Skip the guesswork—get instant strategic clarity and start prioritizing with confidence.
Stars

Integrated Omnichannel Campaigns for Global Tech
Cheil’s end-to-end campaigns for large electronics brands sit at the center of a fast-growing ad market—global ad spend reached about $900B in 2024 while digital ad spend grew ~12% YoY (Insider Intelligence). They command strong share thanks to scale, proprietary data, and retail-embedded execution, delivering above-market ROI. Growth remains hot, so these campaigns soak up budget and set the pace. Feed them and they scale into larger profit engines as the category matures.
Retail Experience & Store Design
In-store experiences, fixtures and blended shopper journeys are surging as omni-channel retail grows—global e‑commerce reached about 21.8% of retail sales in 2024, pushing brands back into physical/digital convergence. Cheil’s retail DNA, especially in electronics and telecom, positions it to win large store rollouts. These big deployments require significant capital and skilled teams, but they create sticky, defensible share. As markets normalize, such assets can convert into reliable cash generation.

Commerce Media & Performance Marketing
Brands want clicks that ring the register, and Cheil’s commerce media delivers measurable ROAS tied to sales — retail media spend grew to about $62B globally in 2024 with ~25% YoY growth. High-growth, tight retail partnerships and performance KPIs (CPC-to-conversion, AOV uplift) create a winning mix. Continuous tech and data investment (CDP, SKU-level attribution) is required to sustain conversion gains. Hold share and commerce media can graduate into a cash cow.

Experiential & Live Brand Activations
Experiential & Live Brand Activations: post-pandemic demand and budgets surged, with the global live events market valued at about USD 800 billion in 2024 and forecasted to grow ~11% CAGR through 2030; Cheil’s ability to link live events directly to retail and digital channels gives it a measurable competitive edge. Capital-intensive and operationally heavy, the category’s growth and Cheil’s footprint position it as a Star in the BCG matrix.
- 2024 market value ~USD 800B
- Omnichannel integration boosts ROI and retail footfall
- High capex/opex but scalable with digital tie-ins
- Category CAGR ~11% to 2030
Data-Driven Creative & Content Studios
Data-Driven Creative & Content Studios sit as Stars: content demand is surging with 5.33 billion internet users and 5.16 billion social users in 2024, pushing clients for faster, targeted, global output. Cheil’s scaled studios combined with analytics deliver high-volume production while preserving craft, capturing share as platform shifts (short-form, AI) drive ongoing investment. With share secured, this line is evolving toward steady cash flow.
- High demand: 5.33B internet users (2024)
- Scale + analytics: volume without craft loss
- Risk: continuous platform shifts require capex
- Outcome: market share → steady cash generation
Scale omni retail media and content into high-ROI cash engines
Cheil’s Stars—end-to-end electronics campaigns, retail deployments, commerce media, experiential and content studios—operate in high-growth markets: global ad spend ~$900B (2024) with digital +12% YoY and retail media ~$62B (+25% YoY). Strong scale, proprietary data and omni retail links drive above-market ROI but require capex/ops to sustain. With market share, these units can mature into reliable cash engines.
| Segment | 2024 size | Growth | Key metric |
|---|---|---|---|
| Electronics campaigns | $900B ad market | Digital +12% | High ROI |
| Retail/Omnichannel | 21.8% e‑commerce | Rising | Sticky deployments |
| Retail media | $62B | +25% YoY | ROAS-driven |
| Experiential | $800B | CAGR ~11% | Capex-heavy |
| Content studios | 5.33B internet users | High demand | Scale + analytics |
What is included in the product
 Detailed Word Document
Cheil BCG Matrix: evaluates each product unit as Star, Cash Cow, Question Mark or Dog, advising invest/hold/divest with market context.

 Customizable Excel Spreadsheet
One-page Cheil BCG Matrix placing each business unit in a quadrant for quick portfolio clarity
Cash Cows

Samsung Anchor Account Management
Samsung Anchor Account Management is a mature, high-share cash cow for Cheil, delivering predictable briefs across markets and tapping Samsung Electronics' scale (Samsung reported roughly KRW 279 trillion consolidated revenue in 2024). Margins rise through standardized processes, shared creative assets and deep insider category expertise, letting the account reliably throw off cash to fund new bets. Keep service quality high and optimize delivery—do not overinvest capital.
Traditional Advertising & Media in Mature Markets
TV, OOH, radio and bread‑and‑butter digital are cash cows for Cheil in mature markets where growth leveled off in 2024; these channels deliver steady revenue and predictable ROI. Cheil sustains entrenched share via long‑standing client relationships and scale buying, keeping incremental spend low. Focus is on milking margins, automating reporting and reallocating freed cash into higher‑growth opportunities.

Shopper Marketing & Trade Promotions
Shopper Marketing & Trade Promotions are Cheil's cash cows: established programs at major retailers deliver steady volume and repeatable playbooks, with 2024 industry estimates showing trade promotions drive about 20% of in-store CPG sales. Execution is repeatable and cash flow remains strong when operations stay tight, typically yielding double-digit ROI on incremental spend. Priority is efficiency, rigorous data hygiene, and measuring incremental lift rather than pursuing moonshots.

PR Retainers for Core Clients
PR retainers for core Cheil clients deliver stable monthly revenue with predictable scopes and regular cross-sell into campaigns; global PR market was about 16.7 billion USD in 2024 with ~3% growth, keeping market expansion modest while Cheil’s share remains secure. Low capex and ~80% utilization convert to strong operating cash; maintain senior counsel and rigorous measurement to defend and grow fee levels.
- Stable recurring revenue
- Predictable scope, easier forecasting
- Cross-sell lifts ARPU
- Low capex + ~80% utilization = cash
- Keep senior counsel + measurement to justify fees
Production & Localization Hubs
Production & Localization Hubs focus on asset versioning, transcreation, and adaptation at scale, operating in a mature category where high throughput and lean margins accumulate into material EBIT contribution; the global language services market was about 56 billion USD in 2024 and enterprise automation adoption exceeded roughly 60%, driving efficiency.
- Standardize: centralized style/termbases
- Centralize: shared platforms reduce unit costs
- Scale: versioning + transcreation pipelines
- Tooling: workflows cut operational costs, keep machines humming
Protect cash cows: cut costs, automate, reinvest in growth
Cheil's cash cows—Samsung Anchor Account (Samsung KRW 279 trillion revenue in 2024), traditional media, shopper/trade promotions (~20% of in‑store CPG sales 2024), PR (global market ~16.7B USD in 2024) and production/localization (language services ~56B USD 2024)—deliver stable, high-share revenue and strong cash conversion. Focus on margin optimization, automation and reallocating freed cash to growth. Maintain senior talent and measurement to defend fees.
| Segment | 2024 metric | Key note |
|---|---|---|
| Samsung Anchor | KRW 279T (Samsung rev) | Predictable briefs, high share |
| Traditional Media | Stable ROI | Low incremental spend |
| Shopper/Trade | ~20% in‑store CPG | Repeatable playbooks |
| PR Retainers | Global 16.7B USD | Steady fees, low capex |
| Prod & Loc | Language market 56B USD | High throughput, scale |
Delivered as Shown
Cheil BCG Matrix
The Cheil BCG Matrix you're previewing is the exact file you'll receive after purchase — final, fully formatted, and ready to use. No watermarks, no demo text, just a clean strategic matrix built for clarity. Once bought, the full document is yours to edit, print, or present immediately, sent straight to your inbox with no surprises or extra steps.

See the Bigger Picture
Curious where Cheil’s offerings sit in the market mix—Stars, Cash Cows, Dogs, or Question Marks? This snapshot teases the answers, but the full Cheil BCG Matrix gives you quadrant-by-quadrant placement, data-backed takeaways, and clear moves to allocate capital and resources smarter. Buy the complete report for a Word deep-dive plus an Excel summary you can present or act on immediately. Skip the guesswork—get instant strategic clarity and start prioritizing with confidence.
Stars
Integrated Omnichannel Campaigns for Global Tech
Cheil’s end-to-end campaigns for large electronics brands sit at the center of a fast-growing ad market—global ad spend reached about $900B in 2024 while digital ad spend grew ~12% YoY (Insider Intelligence). They command strong share thanks to scale, proprietary data, and retail-embedded execution, delivering above-market ROI. Growth remains hot, so these campaigns soak up budget and set the pace. Feed them and they scale into larger profit engines as the category matures.
Retail Experience & Store Design
In-store experiences, fixtures and blended shopper journeys are surging as omni-channel retail grows—global e‑commerce reached about 21.8% of retail sales in 2024, pushing brands back into physical/digital convergence. Cheil’s retail DNA, especially in electronics and telecom, positions it to win large store rollouts. These big deployments require significant capital and skilled teams, but they create sticky, defensible share. As markets normalize, such assets can convert into reliable cash generation.
Commerce Media & Performance Marketing
Brands want clicks that ring the register, and Cheil’s commerce media delivers measurable ROAS tied to sales — retail media spend grew to about $62B globally in 2024 with ~25% YoY growth. High-growth, tight retail partnerships and performance KPIs (CPC-to-conversion, AOV uplift) create a winning mix. Continuous tech and data investment (CDP, SKU-level attribution) is required to sustain conversion gains. Hold share and commerce media can graduate into a cash cow.
Experiential & Live Brand Activations
Experiential & Live Brand Activations: post-pandemic demand and budgets surged, with the global live events market valued at about USD 800 billion in 2024 and forecasted to grow ~11% CAGR through 2030; Cheil’s ability to link live events directly to retail and digital channels gives it a measurable competitive edge. Capital-intensive and operationally heavy, the category’s growth and Cheil’s footprint position it as a Star in the BCG matrix.
- 2024 market value ~USD 800B
- Omnichannel integration boosts ROI and retail footfall
- High capex/opex but scalable with digital tie-ins
- Category CAGR ~11% to 2030
Data-Driven Creative & Content Studios
Data-Driven Creative & Content Studios sit as Stars: content demand is surging with 5.33 billion internet users and 5.16 billion social users in 2024, pushing clients for faster, targeted, global output. Cheil’s scaled studios combined with analytics deliver high-volume production while preserving craft, capturing share as platform shifts (short-form, AI) drive ongoing investment. With share secured, this line is evolving toward steady cash flow.
- High demand: 5.33B internet users (2024)
- Scale + analytics: volume without craft loss
- Risk: continuous platform shifts require capex
- Outcome: market share → steady cash generation
Scale omni retail media and content into high-ROI cash engines
Cheil’s Stars—end-to-end electronics campaigns, retail deployments, commerce media, experiential and content studios—operate in high-growth markets: global ad spend ~$900B (2024) with digital +12% YoY and retail media ~$62B (+25% YoY). Strong scale, proprietary data and omni retail links drive above-market ROI but require capex/ops to sustain. With market share, these units can mature into reliable cash engines.
| Segment | 2024 size | Growth | Key metric |
|---|---|---|---|
| Electronics campaigns | $900B ad market | Digital +12% | High ROI |
| Retail/Omnichannel | 21.8% e‑commerce | Rising | Sticky deployments |
| Retail media | $62B | +25% YoY | ROAS-driven |
| Experiential | $800B | CAGR ~11% | Capex-heavy |
| Content studios | 5.33B internet users | High demand | Scale + analytics |
What is included in the product
Detailed Word Document
Cheil BCG Matrix: evaluates each product unit as Star, Cash Cow, Question Mark or Dog, advising invest/hold/divest with market context.
Customizable Excel Spreadsheet
One-page Cheil BCG Matrix placing each business unit in a quadrant for quick portfolio clarity
Cash Cows
Samsung Anchor Account Management
Samsung Anchor Account Management is a mature, high-share cash cow for Cheil, delivering predictable briefs across markets and tapping Samsung Electronics' scale (Samsung reported roughly KRW 279 trillion consolidated revenue in 2024). Margins rise through standardized processes, shared creative assets and deep insider category expertise, letting the account reliably throw off cash to fund new bets. Keep service quality high and optimize delivery—do not overinvest capital.
Traditional Advertising & Media in Mature Markets
TV, OOH, radio and bread‑and‑butter digital are cash cows for Cheil in mature markets where growth leveled off in 2024; these channels deliver steady revenue and predictable ROI. Cheil sustains entrenched share via long‑standing client relationships and scale buying, keeping incremental spend low. Focus is on milking margins, automating reporting and reallocating freed cash into higher‑growth opportunities.
Shopper Marketing & Trade Promotions
Shopper Marketing & Trade Promotions are Cheil's cash cows: established programs at major retailers deliver steady volume and repeatable playbooks, with 2024 industry estimates showing trade promotions drive about 20% of in-store CPG sales. Execution is repeatable and cash flow remains strong when operations stay tight, typically yielding double-digit ROI on incremental spend. Priority is efficiency, rigorous data hygiene, and measuring incremental lift rather than pursuing moonshots.
PR Retainers for Core Clients
PR retainers for core Cheil clients deliver stable monthly revenue with predictable scopes and regular cross-sell into campaigns; global PR market was about 16.7 billion USD in 2024 with ~3% growth, keeping market expansion modest while Cheil’s share remains secure. Low capex and ~80% utilization convert to strong operating cash; maintain senior counsel and rigorous measurement to defend and grow fee levels.
- Stable recurring revenue
- Predictable scope, easier forecasting
- Cross-sell lifts ARPU
- Low capex + ~80% utilization = cash
- Keep senior counsel + measurement to justify fees
Production & Localization Hubs
Production & Localization Hubs focus on asset versioning, transcreation, and adaptation at scale, operating in a mature category where high throughput and lean margins accumulate into material EBIT contribution; the global language services market was about 56 billion USD in 2024 and enterprise automation adoption exceeded roughly 60%, driving efficiency.
- Standardize: centralized style/termbases
- Centralize: shared platforms reduce unit costs
- Scale: versioning + transcreation pipelines
- Tooling: workflows cut operational costs, keep machines humming
Protect cash cows: cut costs, automate, reinvest in growth
Cheil's cash cows—Samsung Anchor Account (Samsung KRW 279 trillion revenue in 2024), traditional media, shopper/trade promotions (~20% of in‑store CPG sales 2024), PR (global market ~16.7B USD in 2024) and production/localization (language services ~56B USD 2024)—deliver stable, high-share revenue and strong cash conversion. Focus on margin optimization, automation and reallocating freed cash to growth. Maintain senior talent and measurement to defend fees.
| Segment | 2024 metric | Key note |
|---|---|---|
| Samsung Anchor | KRW 279T (Samsung rev) | Predictable briefs, high share |
| Traditional Media | Stable ROI | Low incremental spend |
| Shopper/Trade | ~20% in‑store CPG | Repeatable playbooks |
| PR Retainers | Global 16.7B USD | Steady fees, low capex |
| Prod & Loc | Language market 56B USD | High throughput, scale |
Delivered as Shown
Cheil BCG Matrix
The Cheil BCG Matrix you're previewing is the exact file you'll receive after purchase — final, fully formatted, and ready to use. No watermarks, no demo text, just a clean strategic matrix built for clarity. Once bought, the full document is yours to edit, print, or present immediately, sent straight to your inbox with no surprises or extra steps.
Original: $10.00
-65%$10.00
$3.50Description
See the Bigger Picture
Curious where Cheil’s offerings sit in the market mix—Stars, Cash Cows, Dogs, or Question Marks? This snapshot teases the answers, but the full Cheil BCG Matrix gives you quadrant-by-quadrant placement, data-backed takeaways, and clear moves to allocate capital and resources smarter. Buy the complete report for a Word deep-dive plus an Excel summary you can present or act on immediately. Skip the guesswork—get instant strategic clarity and start prioritizing with confidence.
Stars
Integrated Omnichannel Campaigns for Global Tech
Cheil’s end-to-end campaigns for large electronics brands sit at the center of a fast-growing ad market—global ad spend reached about $900B in 2024 while digital ad spend grew ~12% YoY (Insider Intelligence). They command strong share thanks to scale, proprietary data, and retail-embedded execution, delivering above-market ROI. Growth remains hot, so these campaigns soak up budget and set the pace. Feed them and they scale into larger profit engines as the category matures.
Retail Experience & Store Design
In-store experiences, fixtures and blended shopper journeys are surging as omni-channel retail grows—global e‑commerce reached about 21.8% of retail sales in 2024, pushing brands back into physical/digital convergence. Cheil’s retail DNA, especially in electronics and telecom, positions it to win large store rollouts. These big deployments require significant capital and skilled teams, but they create sticky, defensible share. As markets normalize, such assets can convert into reliable cash generation.
Commerce Media & Performance Marketing
Brands want clicks that ring the register, and Cheil’s commerce media delivers measurable ROAS tied to sales — retail media spend grew to about $62B globally in 2024 with ~25% YoY growth. High-growth, tight retail partnerships and performance KPIs (CPC-to-conversion, AOV uplift) create a winning mix. Continuous tech and data investment (CDP, SKU-level attribution) is required to sustain conversion gains. Hold share and commerce media can graduate into a cash cow.
Experiential & Live Brand Activations
Experiential & Live Brand Activations: post-pandemic demand and budgets surged, with the global live events market valued at about USD 800 billion in 2024 and forecasted to grow ~11% CAGR through 2030; Cheil’s ability to link live events directly to retail and digital channels gives it a measurable competitive edge. Capital-intensive and operationally heavy, the category’s growth and Cheil’s footprint position it as a Star in the BCG matrix.
- 2024 market value ~USD 800B
- Omnichannel integration boosts ROI and retail footfall
- High capex/opex but scalable with digital tie-ins
- Category CAGR ~11% to 2030
Data-Driven Creative & Content Studios
Data-Driven Creative & Content Studios sit as Stars: content demand is surging with 5.33 billion internet users and 5.16 billion social users in 2024, pushing clients for faster, targeted, global output. Cheil’s scaled studios combined with analytics deliver high-volume production while preserving craft, capturing share as platform shifts (short-form, AI) drive ongoing investment. With share secured, this line is evolving toward steady cash flow.
- High demand: 5.33B internet users (2024)
- Scale + analytics: volume without craft loss
- Risk: continuous platform shifts require capex
- Outcome: market share → steady cash generation
Scale omni retail media and content into high-ROI cash engines
Cheil’s Stars—end-to-end electronics campaigns, retail deployments, commerce media, experiential and content studios—operate in high-growth markets: global ad spend ~$900B (2024) with digital +12% YoY and retail media ~$62B (+25% YoY). Strong scale, proprietary data and omni retail links drive above-market ROI but require capex/ops to sustain. With market share, these units can mature into reliable cash engines.
| Segment | 2024 size | Growth | Key metric |
|---|---|---|---|
| Electronics campaigns | $900B ad market | Digital +12% | High ROI |
| Retail/Omnichannel | 21.8% e‑commerce | Rising | Sticky deployments |
| Retail media | $62B | +25% YoY | ROAS-driven |
| Experiential | $800B | CAGR ~11% | Capex-heavy |
| Content studios | 5.33B internet users | High demand | Scale + analytics |
What is included in the product
Detailed Word Document
Cheil BCG Matrix: evaluates each product unit as Star, Cash Cow, Question Mark or Dog, advising invest/hold/divest with market context.
Customizable Excel Spreadsheet
One-page Cheil BCG Matrix placing each business unit in a quadrant for quick portfolio clarity
Cash Cows
Samsung Anchor Account Management
Samsung Anchor Account Management is a mature, high-share cash cow for Cheil, delivering predictable briefs across markets and tapping Samsung Electronics' scale (Samsung reported roughly KRW 279 trillion consolidated revenue in 2024). Margins rise through standardized processes, shared creative assets and deep insider category expertise, letting the account reliably throw off cash to fund new bets. Keep service quality high and optimize delivery—do not overinvest capital.
Traditional Advertising & Media in Mature Markets
TV, OOH, radio and bread‑and‑butter digital are cash cows for Cheil in mature markets where growth leveled off in 2024; these channels deliver steady revenue and predictable ROI. Cheil sustains entrenched share via long‑standing client relationships and scale buying, keeping incremental spend low. Focus is on milking margins, automating reporting and reallocating freed cash into higher‑growth opportunities.
Shopper Marketing & Trade Promotions
Shopper Marketing & Trade Promotions are Cheil's cash cows: established programs at major retailers deliver steady volume and repeatable playbooks, with 2024 industry estimates showing trade promotions drive about 20% of in-store CPG sales. Execution is repeatable and cash flow remains strong when operations stay tight, typically yielding double-digit ROI on incremental spend. Priority is efficiency, rigorous data hygiene, and measuring incremental lift rather than pursuing moonshots.
PR Retainers for Core Clients
PR retainers for core Cheil clients deliver stable monthly revenue with predictable scopes and regular cross-sell into campaigns; global PR market was about 16.7 billion USD in 2024 with ~3% growth, keeping market expansion modest while Cheil’s share remains secure. Low capex and ~80% utilization convert to strong operating cash; maintain senior counsel and rigorous measurement to defend and grow fee levels.
- Stable recurring revenue
- Predictable scope, easier forecasting
- Cross-sell lifts ARPU
- Low capex + ~80% utilization = cash
- Keep senior counsel + measurement to justify fees
Production & Localization Hubs
Production & Localization Hubs focus on asset versioning, transcreation, and adaptation at scale, operating in a mature category where high throughput and lean margins accumulate into material EBIT contribution; the global language services market was about 56 billion USD in 2024 and enterprise automation adoption exceeded roughly 60%, driving efficiency.
- Standardize: centralized style/termbases
- Centralize: shared platforms reduce unit costs
- Scale: versioning + transcreation pipelines
- Tooling: workflows cut operational costs, keep machines humming
Protect cash cows: cut costs, automate, reinvest in growth
Cheil's cash cows—Samsung Anchor Account (Samsung KRW 279 trillion revenue in 2024), traditional media, shopper/trade promotions (~20% of in‑store CPG sales 2024), PR (global market ~16.7B USD in 2024) and production/localization (language services ~56B USD 2024)—deliver stable, high-share revenue and strong cash conversion. Focus on margin optimization, automation and reallocating freed cash to growth. Maintain senior talent and measurement to defend fees.
| Segment | 2024 metric | Key note |
|---|---|---|
| Samsung Anchor | KRW 279T (Samsung rev) | Predictable briefs, high share |
| Traditional Media | Stable ROI | Low incremental spend |
| Shopper/Trade | ~20% in‑store CPG | Repeatable playbooks |
| PR Retainers | Global 16.7B USD | Steady fees, low capex |
| Prod & Loc | Language market 56B USD | High throughput, scale |
Delivered as Shown
Cheil BCG Matrix
The Cheil BCG Matrix you're previewing is the exact file you'll receive after purchase — final, fully formatted, and ready to use. No watermarks, no demo text, just a clean strategic matrix built for clarity. Once bought, the full document is yours to edit, print, or present immediately, sent straight to your inbox with no surprises or extra steps.











