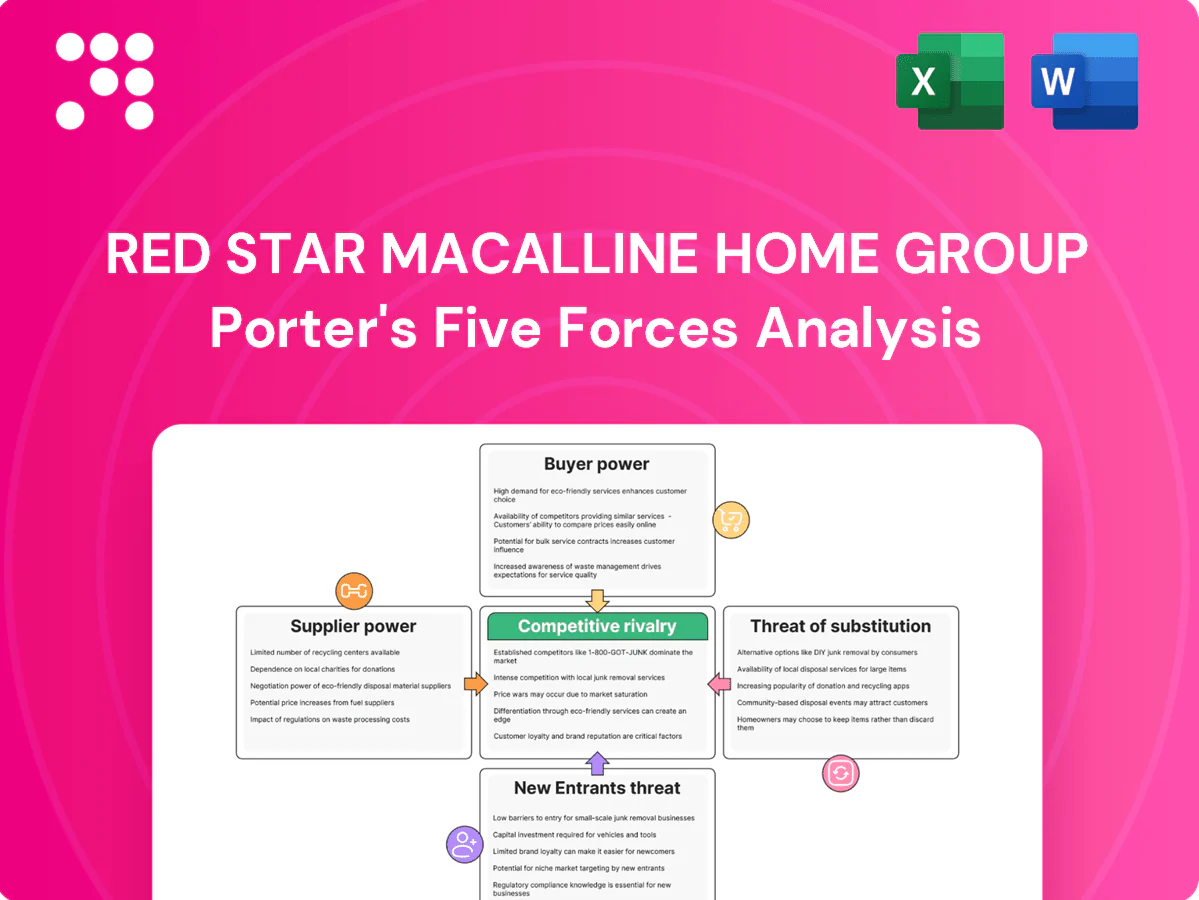
Red Star Macalline Home Group Porter's Five Forces Analysis

Don't Miss the Bigger Picture
Red Star Macalline faces intense competitive rivalry in China's home furnishing mall sector, with strong buyer bargaining and moderate supplier leverage; threats from new entrants are limited by scale but substitutes and online channels pose rising pressure. This brief snapshot only scratches the surface. Unlock the full Porter's Five Forces Analysis to explore Red Star Macalline Home Group’s competitive dynamics, market pressures, and strategic advantages in detail.
Suppliers Bargaining Power

Prime land and permits
Access to tier-1/2 parcels and approvals remains concentrated among local governments and a handful of top developers, creating scarcity that lifts land premiums and controls timing. Red Star Macalline, operating over 300 home-furnishing malls as of 2024, must outbid rivals for premium nodes that drive tenant and consumer traffic. Delays or higher land costs compress project IRRs and shift bargaining power upstream, pressuring downstream margins and expansion pace.
Construction and fit-out capacity
Large, complex mall builds for Red Star Macalline rely on a limited pool of contractors and specialty fit-out suppliers, and with the group operating over 450 malls by mid-2024 this concentration tightens sourcing pressure. When contractor pipelines are full, bids rise and schedules slip, shifting negotiating leverage to suppliers. Any construction overrun directly delays leasing calendars and rent commencement; bulk buying reduces unit costs but local labor and specialty capacity shortages still bite.

Anchor tenant dependence
Flagship furniture and building-material brands act as content suppliers that drive footfall into Red Star Macalline's network of over 300 home-furnishing malls as of 2024, giving anchors leverage to demand rent concessions, prominent signage and location priority. Strong anchors' pull increases their bargaining power at renewal, often securing better terms that raise landlord concentration risk. Losing an anchor can ripple into lower occupancy and weaker rental yields across affected centres.

Traffic and payment platforms
Digital traffic brokers, super-apps and payment rails—WeChat and Alipay each with ~1.3bn MAUs in 2024—dominate mall discovery and conversion; their fees, data access and algorithmic placement shift economics and transfer value upstream. Dependence on these channels for leads concentrates supplier power; negotiated partnerships mitigate but do not eliminate leverage.
- Fees: commission and payment fees 0.2–15%
- Data: limited access to consumer data
- Partnerships: lower risk but persistent platform control
Facility services and utilities
Security, cleaning, HVAC and energy providers are essential to mall uptime for Red Star Macalline; outages or poor service directly hit footfall and sales. In several Chinese regions a limited pool of certified vendors raises switching costs and dependency. Energy price swings—energy often representing roughly 5–8% of mall operating costs—compress margins; long-term contracts signed during tight markets can lock in supplier-favorable terms.
- Supplier concentration: limited qualified vendors in some regions
- Cost exposure: energy ~5–8% of operating costs
- Switching costs: high due to certification and integration
- Contract risk: long-term agreements can favor suppliers in tight markets
Supplier power raises premiums: land concentrated; platforms extract fees; energy 5–8%
Supplier power is high: land and approvals concentrated with governments/top developers lift premiums; Red Star Macalline (300+ malls in 2024) faces upward land and contractor bids. Anchor brands and platforms (WeChat/Alipay ~1.3bn MAU) extract concessions; energy 5–8% of opex and limited certified vendors raise switching costs, compressing margins and slowing expansion.
| Metric | 2024 |
|---|---|
| Malls | 300+ |
| WeChat/Alipay MAU | ~1.3bn |
| Energy share of opex | 5–8% |
| Contractor supply | Concentrated |
What is included in the product
 Detailed Word Document
Tailored Porter's Five Forces analysis of Red Star Macalline Home Group revealing competitive rivalry, buyer and supplier power, entry barriers, and substitutes, identifying disruptive threats and strategic levers for pricing and profitability.

 Customizable Excel Spreadsheet
A concise, one-sheet Porter's Five Forces view for Red Star Macalline that lets users tweak pressure levels, swap in current data, and visualize strategic intensity via a radar chart—ready to paste into pitch decks or dashboards with no complex setup.
Customers Bargaining Power

Tenant mix concentration
Tenant mix concentration is a key bargaining vector: large chain retailers and franchisors negotiate portfolio-wide terms across Red Star Macalline's network of over 300 malls (2024), using scale to extract rent relief and capex contributions, often amounting to double-digit concession levels. Smaller independents carry less leverage, but a fragmented base raises churn and vacancy risk. Red Star Macalline actively balances concessions to preserve anchor draw and overall occupancy.
Alternative channels for tenants
Brands can shift sales to online, live-stream and DTC showrooms, with online retail share exceeding 30% in China by 2024 and live‑stream channels generating over RMB1 trillion annually (2023), creating a credible outside option that raises tenants’ leverage on base rent and revenue share. If offline sales productivity dips, tenants increasingly demand abatements and short-term rent relief. The mall must deliver measurable footfall and conversion metrics to justify rents.

End-consumer price sensitivity
Home improvement is cyclical and ticket-heavy, so 2024 shoppers remain highly value-sensitive, frequently comparing prices online and delaying purchases for better deals. Delayed or reduced purchases have compressed tenant sales in mall clusters through 2024, increasing pressure on turnover-based rents and lease renewals. Lower tenant sales push landlords to renegotiate terms and offer rent concessions. Promotions, bundled services and installation offers are increasingly used to protect basket sizes and conversion.

Switching and relocation options
Rival home malls and mixed-use centers in core Chinese cities broaden choice for tenants, and Red Star Macalline operated over 300 home malls by 2024, intensifying local competition. Tenants routinely relocate within trade areas to chase higher footfall or lower rents; relocation costs exist but are relatively manageable for national chains with standardized fit-outs. This mobility constrains landlords' ability to push rents sharply at renewal, keeping pricing power in check.
- Competition: multiple rival malls in key districts
- Mobility: tenants can shift within trade area for footfall/rent
- Costs: relocation costs manageable for chains
- Effect: lowers landlord pricing leverage at renewals
Demand for value-added services
Tenants increasingly demand marketing, design support and omni-channel integration; in 2024 Red Star Macalline's mall network of over 1,300 stores means its ability to provide leads and installation services often tips leasing decisions. Where service bundles are weak tenants press for rent relief or shorter leases. Robust service packages raise switching costs and lower buyer bargaining power.
- Tenant expectations: marketing, design, omni-channel
- Deal drivers: leads + installation services
- Weak services -> rent relief demands
- Strong bundles -> reduced buyer power
Chains extract double-digit concessions across 300+ malls as online share > 30%
Tenant mix concentration lets large chains negotiate portfolio-wide terms across over 300 malls (2024), extracting double-digit concessions. Online share >30% in China (2024) and live-stream GMV ~RMB1 trillion (2023) give tenants credible outside options, pressuring base rents. Red Star's 1,300+ stores and service bundles raise switching costs and reduce buyer power.
| Metric | Value |
|---|---|
| Malls (2024) | >300 |
| Stores (2024) | 1,300+ |
| Online share (China, 2024) | >30% |
| Live-stream GMV (2023) | RMB1 trillion |
| Typical concessions | Double-digit % |
What You See Is What You Get
Red Star Macalline Home Group Porter's Five Forces Analysis
This preview shows the exact Red Star Macalline Home Group Porter's Five Forces Analysis you'll receive immediately after purchase—no placeholders or samples. The document displayed is fully formatted, professionally written, and ready for download and use the moment you buy. You're viewing the final deliverable; purchase grants instant access to this same file.

Don't Miss the Bigger Picture
Red Star Macalline faces intense competitive rivalry in China's home furnishing mall sector, with strong buyer bargaining and moderate supplier leverage; threats from new entrants are limited by scale but substitutes and online channels pose rising pressure. This brief snapshot only scratches the surface. Unlock the full Porter's Five Forces Analysis to explore Red Star Macalline Home Group’s competitive dynamics, market pressures, and strategic advantages in detail.
Suppliers Bargaining Power
Prime land and permits
Access to tier-1/2 parcels and approvals remains concentrated among local governments and a handful of top developers, creating scarcity that lifts land premiums and controls timing. Red Star Macalline, operating over 300 home-furnishing malls as of 2024, must outbid rivals for premium nodes that drive tenant and consumer traffic. Delays or higher land costs compress project IRRs and shift bargaining power upstream, pressuring downstream margins and expansion pace.
Construction and fit-out capacity
Large, complex mall builds for Red Star Macalline rely on a limited pool of contractors and specialty fit-out suppliers, and with the group operating over 450 malls by mid-2024 this concentration tightens sourcing pressure. When contractor pipelines are full, bids rise and schedules slip, shifting negotiating leverage to suppliers. Any construction overrun directly delays leasing calendars and rent commencement; bulk buying reduces unit costs but local labor and specialty capacity shortages still bite.
Anchor tenant dependence
Flagship furniture and building-material brands act as content suppliers that drive footfall into Red Star Macalline's network of over 300 home-furnishing malls as of 2024, giving anchors leverage to demand rent concessions, prominent signage and location priority. Strong anchors' pull increases their bargaining power at renewal, often securing better terms that raise landlord concentration risk. Losing an anchor can ripple into lower occupancy and weaker rental yields across affected centres.
Traffic and payment platforms
Digital traffic brokers, super-apps and payment rails—WeChat and Alipay each with ~1.3bn MAUs in 2024—dominate mall discovery and conversion; their fees, data access and algorithmic placement shift economics and transfer value upstream. Dependence on these channels for leads concentrates supplier power; negotiated partnerships mitigate but do not eliminate leverage.
- Fees: commission and payment fees 0.2–15%
- Data: limited access to consumer data
- Partnerships: lower risk but persistent platform control
Facility services and utilities
Security, cleaning, HVAC and energy providers are essential to mall uptime for Red Star Macalline; outages or poor service directly hit footfall and sales. In several Chinese regions a limited pool of certified vendors raises switching costs and dependency. Energy price swings—energy often representing roughly 5–8% of mall operating costs—compress margins; long-term contracts signed during tight markets can lock in supplier-favorable terms.
- Supplier concentration: limited qualified vendors in some regions
- Cost exposure: energy ~5–8% of operating costs
- Switching costs: high due to certification and integration
- Contract risk: long-term agreements can favor suppliers in tight markets
Supplier power raises premiums: land concentrated; platforms extract fees; energy 5–8%
Supplier power is high: land and approvals concentrated with governments/top developers lift premiums; Red Star Macalline (300+ malls in 2024) faces upward land and contractor bids. Anchor brands and platforms (WeChat/Alipay ~1.3bn MAU) extract concessions; energy 5–8% of opex and limited certified vendors raise switching costs, compressing margins and slowing expansion.
| Metric | 2024 |
|---|---|
| Malls | 300+ |
| WeChat/Alipay MAU | ~1.3bn |
| Energy share of opex | 5–8% |
| Contractor supply | Concentrated |
What is included in the product
Detailed Word Document
Tailored Porter's Five Forces analysis of Red Star Macalline Home Group revealing competitive rivalry, buyer and supplier power, entry barriers, and substitutes, identifying disruptive threats and strategic levers for pricing and profitability.
Customizable Excel Spreadsheet
A concise, one-sheet Porter's Five Forces view for Red Star Macalline that lets users tweak pressure levels, swap in current data, and visualize strategic intensity via a radar chart—ready to paste into pitch decks or dashboards with no complex setup.
Customers Bargaining Power
Tenant mix concentration
Tenant mix concentration is a key bargaining vector: large chain retailers and franchisors negotiate portfolio-wide terms across Red Star Macalline's network of over 300 malls (2024), using scale to extract rent relief and capex contributions, often amounting to double-digit concession levels. Smaller independents carry less leverage, but a fragmented base raises churn and vacancy risk. Red Star Macalline actively balances concessions to preserve anchor draw and overall occupancy.
Alternative channels for tenants
Brands can shift sales to online, live-stream and DTC showrooms, with online retail share exceeding 30% in China by 2024 and live‑stream channels generating over RMB1 trillion annually (2023), creating a credible outside option that raises tenants’ leverage on base rent and revenue share. If offline sales productivity dips, tenants increasingly demand abatements and short-term rent relief. The mall must deliver measurable footfall and conversion metrics to justify rents.
End-consumer price sensitivity
Home improvement is cyclical and ticket-heavy, so 2024 shoppers remain highly value-sensitive, frequently comparing prices online and delaying purchases for better deals. Delayed or reduced purchases have compressed tenant sales in mall clusters through 2024, increasing pressure on turnover-based rents and lease renewals. Lower tenant sales push landlords to renegotiate terms and offer rent concessions. Promotions, bundled services and installation offers are increasingly used to protect basket sizes and conversion.
Switching and relocation options
Rival home malls and mixed-use centers in core Chinese cities broaden choice for tenants, and Red Star Macalline operated over 300 home malls by 2024, intensifying local competition. Tenants routinely relocate within trade areas to chase higher footfall or lower rents; relocation costs exist but are relatively manageable for national chains with standardized fit-outs. This mobility constrains landlords' ability to push rents sharply at renewal, keeping pricing power in check.
- Competition: multiple rival malls in key districts
- Mobility: tenants can shift within trade area for footfall/rent
- Costs: relocation costs manageable for chains
- Effect: lowers landlord pricing leverage at renewals
Demand for value-added services
Tenants increasingly demand marketing, design support and omni-channel integration; in 2024 Red Star Macalline's mall network of over 1,300 stores means its ability to provide leads and installation services often tips leasing decisions. Where service bundles are weak tenants press for rent relief or shorter leases. Robust service packages raise switching costs and lower buyer bargaining power.
- Tenant expectations: marketing, design, omni-channel
- Deal drivers: leads + installation services
- Weak services -> rent relief demands
- Strong bundles -> reduced buyer power
Chains extract double-digit concessions across 300+ malls as online share > 30%
Tenant mix concentration lets large chains negotiate portfolio-wide terms across over 300 malls (2024), extracting double-digit concessions. Online share >30% in China (2024) and live-stream GMV ~RMB1 trillion (2023) give tenants credible outside options, pressuring base rents. Red Star's 1,300+ stores and service bundles raise switching costs and reduce buyer power.
| Metric | Value |
|---|---|
| Malls (2024) | >300 |
| Stores (2024) | 1,300+ |
| Online share (China, 2024) | >30% |
| Live-stream GMV (2023) | RMB1 trillion |
| Typical concessions | Double-digit % |
What You See Is What You Get
Red Star Macalline Home Group Porter's Five Forces Analysis
This preview shows the exact Red Star Macalline Home Group Porter's Five Forces Analysis you'll receive immediately after purchase—no placeholders or samples. The document displayed is fully formatted, professionally written, and ready for download and use the moment you buy. You're viewing the final deliverable; purchase grants instant access to this same file.
Original: $10.00
-65%$10.00
$3.50Description
Don't Miss the Bigger Picture
Red Star Macalline faces intense competitive rivalry in China's home furnishing mall sector, with strong buyer bargaining and moderate supplier leverage; threats from new entrants are limited by scale but substitutes and online channels pose rising pressure. This brief snapshot only scratches the surface. Unlock the full Porter's Five Forces Analysis to explore Red Star Macalline Home Group’s competitive dynamics, market pressures, and strategic advantages in detail.
Suppliers Bargaining Power
Prime land and permits
Access to tier-1/2 parcels and approvals remains concentrated among local governments and a handful of top developers, creating scarcity that lifts land premiums and controls timing. Red Star Macalline, operating over 300 home-furnishing malls as of 2024, must outbid rivals for premium nodes that drive tenant and consumer traffic. Delays or higher land costs compress project IRRs and shift bargaining power upstream, pressuring downstream margins and expansion pace.
Construction and fit-out capacity
Large, complex mall builds for Red Star Macalline rely on a limited pool of contractors and specialty fit-out suppliers, and with the group operating over 450 malls by mid-2024 this concentration tightens sourcing pressure. When contractor pipelines are full, bids rise and schedules slip, shifting negotiating leverage to suppliers. Any construction overrun directly delays leasing calendars and rent commencement; bulk buying reduces unit costs but local labor and specialty capacity shortages still bite.
Anchor tenant dependence
Flagship furniture and building-material brands act as content suppliers that drive footfall into Red Star Macalline's network of over 300 home-furnishing malls as of 2024, giving anchors leverage to demand rent concessions, prominent signage and location priority. Strong anchors' pull increases their bargaining power at renewal, often securing better terms that raise landlord concentration risk. Losing an anchor can ripple into lower occupancy and weaker rental yields across affected centres.
Traffic and payment platforms
Digital traffic brokers, super-apps and payment rails—WeChat and Alipay each with ~1.3bn MAUs in 2024—dominate mall discovery and conversion; their fees, data access and algorithmic placement shift economics and transfer value upstream. Dependence on these channels for leads concentrates supplier power; negotiated partnerships mitigate but do not eliminate leverage.
- Fees: commission and payment fees 0.2–15%
- Data: limited access to consumer data
- Partnerships: lower risk but persistent platform control
Facility services and utilities
Security, cleaning, HVAC and energy providers are essential to mall uptime for Red Star Macalline; outages or poor service directly hit footfall and sales. In several Chinese regions a limited pool of certified vendors raises switching costs and dependency. Energy price swings—energy often representing roughly 5–8% of mall operating costs—compress margins; long-term contracts signed during tight markets can lock in supplier-favorable terms.
- Supplier concentration: limited qualified vendors in some regions
- Cost exposure: energy ~5–8% of operating costs
- Switching costs: high due to certification and integration
- Contract risk: long-term agreements can favor suppliers in tight markets
Supplier power raises premiums: land concentrated; platforms extract fees; energy 5–8%
Supplier power is high: land and approvals concentrated with governments/top developers lift premiums; Red Star Macalline (300+ malls in 2024) faces upward land and contractor bids. Anchor brands and platforms (WeChat/Alipay ~1.3bn MAU) extract concessions; energy 5–8% of opex and limited certified vendors raise switching costs, compressing margins and slowing expansion.
| Metric | 2024 |
|---|---|
| Malls | 300+ |
| WeChat/Alipay MAU | ~1.3bn |
| Energy share of opex | 5–8% |
| Contractor supply | Concentrated |
What is included in the product
Detailed Word Document
Tailored Porter's Five Forces analysis of Red Star Macalline Home Group revealing competitive rivalry, buyer and supplier power, entry barriers, and substitutes, identifying disruptive threats and strategic levers for pricing and profitability.
Customizable Excel Spreadsheet
A concise, one-sheet Porter's Five Forces view for Red Star Macalline that lets users tweak pressure levels, swap in current data, and visualize strategic intensity via a radar chart—ready to paste into pitch decks or dashboards with no complex setup.
Customers Bargaining Power
Tenant mix concentration
Tenant mix concentration is a key bargaining vector: large chain retailers and franchisors negotiate portfolio-wide terms across Red Star Macalline's network of over 300 malls (2024), using scale to extract rent relief and capex contributions, often amounting to double-digit concession levels. Smaller independents carry less leverage, but a fragmented base raises churn and vacancy risk. Red Star Macalline actively balances concessions to preserve anchor draw and overall occupancy.
Alternative channels for tenants
Brands can shift sales to online, live-stream and DTC showrooms, with online retail share exceeding 30% in China by 2024 and live‑stream channels generating over RMB1 trillion annually (2023), creating a credible outside option that raises tenants’ leverage on base rent and revenue share. If offline sales productivity dips, tenants increasingly demand abatements and short-term rent relief. The mall must deliver measurable footfall and conversion metrics to justify rents.
End-consumer price sensitivity
Home improvement is cyclical and ticket-heavy, so 2024 shoppers remain highly value-sensitive, frequently comparing prices online and delaying purchases for better deals. Delayed or reduced purchases have compressed tenant sales in mall clusters through 2024, increasing pressure on turnover-based rents and lease renewals. Lower tenant sales push landlords to renegotiate terms and offer rent concessions. Promotions, bundled services and installation offers are increasingly used to protect basket sizes and conversion.
Switching and relocation options
Rival home malls and mixed-use centers in core Chinese cities broaden choice for tenants, and Red Star Macalline operated over 300 home malls by 2024, intensifying local competition. Tenants routinely relocate within trade areas to chase higher footfall or lower rents; relocation costs exist but are relatively manageable for national chains with standardized fit-outs. This mobility constrains landlords' ability to push rents sharply at renewal, keeping pricing power in check.
- Competition: multiple rival malls in key districts
- Mobility: tenants can shift within trade area for footfall/rent
- Costs: relocation costs manageable for chains
- Effect: lowers landlord pricing leverage at renewals
Demand for value-added services
Tenants increasingly demand marketing, design support and omni-channel integration; in 2024 Red Star Macalline's mall network of over 1,300 stores means its ability to provide leads and installation services often tips leasing decisions. Where service bundles are weak tenants press for rent relief or shorter leases. Robust service packages raise switching costs and lower buyer bargaining power.
- Tenant expectations: marketing, design, omni-channel
- Deal drivers: leads + installation services
- Weak services -> rent relief demands
- Strong bundles -> reduced buyer power
Chains extract double-digit concessions across 300+ malls as online share > 30%
Tenant mix concentration lets large chains negotiate portfolio-wide terms across over 300 malls (2024), extracting double-digit concessions. Online share >30% in China (2024) and live-stream GMV ~RMB1 trillion (2023) give tenants credible outside options, pressuring base rents. Red Star's 1,300+ stores and service bundles raise switching costs and reduce buyer power.
| Metric | Value |
|---|---|
| Malls (2024) | >300 |
| Stores (2024) | 1,300+ |
| Online share (China, 2024) | >30% |
| Live-stream GMV (2023) | RMB1 trillion |
| Typical concessions | Double-digit % |
What You See Is What You Get
Red Star Macalline Home Group Porter's Five Forces Analysis
This preview shows the exact Red Star Macalline Home Group Porter's Five Forces Analysis you'll receive immediately after purchase—no placeholders or samples. The document displayed is fully formatted, professionally written, and ready for download and use the moment you buy. You're viewing the final deliverable; purchase grants instant access to this same file.











