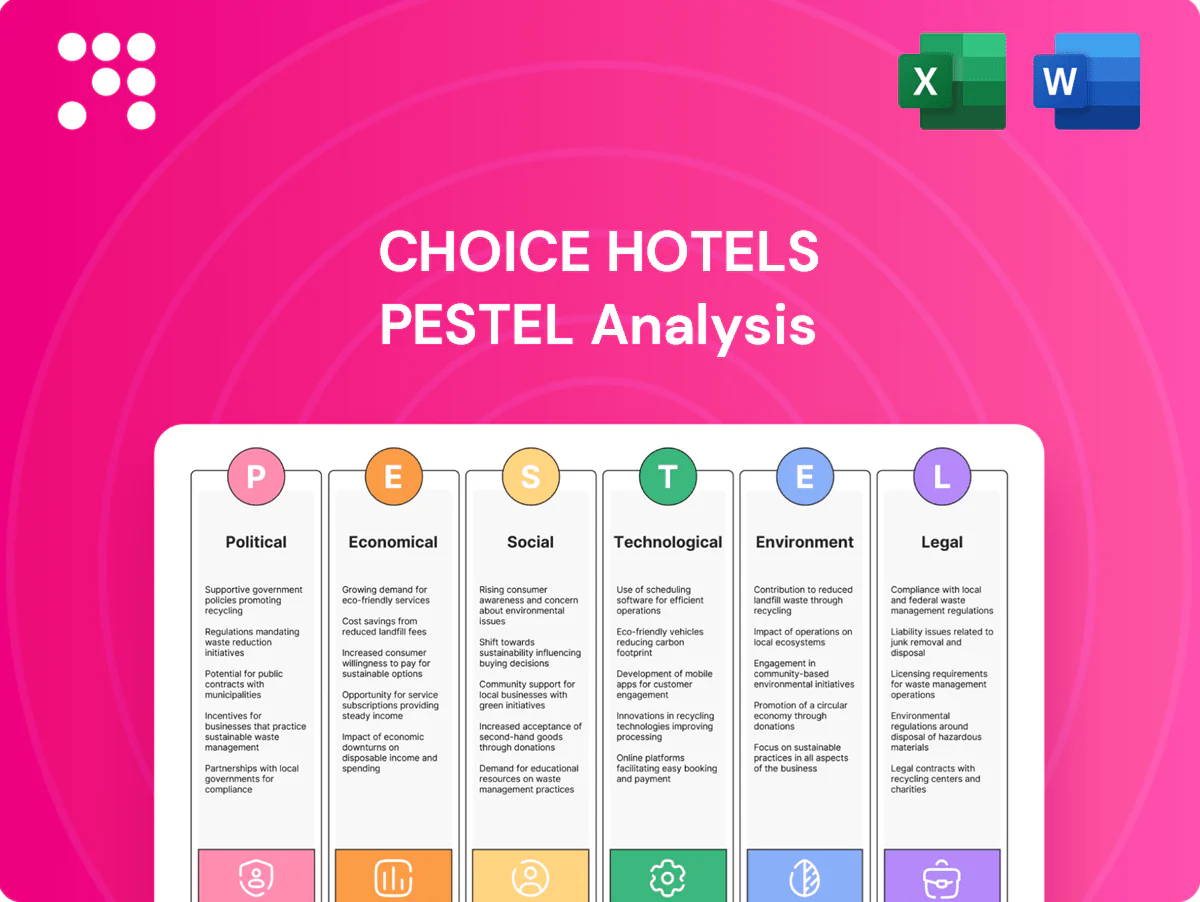
Choice Hotels PESTLE Analysis

Make Smarter Strategic Decisions with a Complete PESTEL View
Discover key political, economic, social, technological, legal and environmental forces shaping Choice Hotels and its growth prospects. Our concise PESTLE highlights regulatory risks, market trends and operational threats you need to know. Buy the full analysis to get the complete, actionable report instantly.
Political factors

Travel and visa policies
Inbound tourism, which reached about 1.4 billion international arrivals in 2023 (roughly 80% of 2019 levels, UNWTO), hinges on visa processing speeds, reciprocity and geopolitical stability. Tightened entry rules or embassy backlogs can curb international demand to Choice Hotels franchisees—Choice operates over 7,100 properties worldwide. The brand must flex marketing between domestic and international segments to smooth volatility and coordinate with destination marketing organizations and lobbying bodies to mitigate policy shocks.
Local incentives and taxes
Hotel occupancy taxes, tourism levies and municipal incentives—often ranging across jurisdictions from roughly 4% to 17% on room revenue—directly shape Choice Hotels' franchise economics and RevPAR. Political decisions to add or remove abatements alter new-construction and conversion pipelines, affecting Choice’s pipeline of thousands of franchised rooms. Shifts in property tax assessments can compress margins in lower ADR markets, so Choice steers development to jurisdictions with stable, favorable policy.

Geopolitical risk and security
Conflicts, sanctions and terrorism alerts reroute travel and raise insurance and security costs, forcing higher operating overheads for hoteliers and insurers alike.
Corporate and group travel freezes can quickly depress RevPAR in affected regions; Choice Hotels operates over 7,400 franchised and managed properties across 40+ countries, giving scale but also exposure.
Choice’s diversified brand mix and geographies help hedge risk but require agile demand redistribution, crisis communications and flexible cancellation policies to stabilize bookings and protect cash flow.

Public health preparedness
Government outbreak responses (restrictions, travel advisories) directly shift occupancy—U.S. hotel occupancy averaged ~64% in 2023–24—impacting Choice’s ~7,100 franchised hotels and revenue flow. Clear sanitation and ventilation policies shape guest confidence and add compliance costs; Choice’s standardized cleaning and HVAC protocols reduce franchisee adaptation time and legal risk. Strategic partnerships with authorities help secure essential-lodging status when demand shifts.
- government restrictions → immediate occupancy swings
- policy clarity ↔ guest confidence & compliance cost
- standardized protocols aid 7,100 franchisees
- authority partnerships = essential-lodging access
Government support for tourism
- Destination marketing lifts demand — UNWTO: 2023 = 88% of 2019 arrivals
- Infrastructure funding — IIJA: $1.2 trillion
- FAA AIP funding ~ $3.3B/year aids regional air links
- Subsidies accelerate renovations and ADA compliance
Political risks and taxes trigger occupancy swings across ~7,400 hotels
Political risks—visa rules, sanctions and travel advisories—drive occupancy volatility for Choice Hotels (≈7,400 properties); 2023 inbound travel ≈1.4B arrivals (~80% of 2019, UNWTO) and US hotel occupancy ~64% in 2023–24. Taxes/levies (roughly 4–17%) and incentives reshape franchise economics; IIJA $1.2T and FAA AIP ~$3.3B/yr influence regional development.
| Metric | Value |
|---|---|
| Properties | ~7,400 |
| Inbound arrivals 2023 | 1.4B (~80% 2019) |
| US occupancy 2023–24 | ~64% |
| Typical room taxes | 4–17% |
| IIJA | $1.2T |
| FAA AIP | ~$3.3B/yr |
What is included in the product
 Detailed Word Document
Explores how macro-environmental factors uniquely affect Choice Hotels across Political, Economic, Social, Technological, Environmental, and Legal dimensions, with data-driven trends, forward-looking insights, and specific sub-points to help executives, consultants, and investors identify risks, opportunities, and strategic actions.

 Customizable Excel Spreadsheet
A concise, visually segmented Choice Hotels PESTLE summary that highlights external risks and opportunities for quick reference, easily editable for regional context and drop-in ready for presentations or team alignment.
Economic factors

Macro cycles and RevPAR
Occupancy and ADR at Choice track macro cycles tied to GDP, employment and corporate travel, with economy and midscale segments historically more resilient though vulnerable to rate pressure in downturns; Choice’s fee-based revenue model scales with franchise performance, amplifying exposure to RevPAR swings; disciplined revenue management and a growing extended-stay mix help cushion downturns and stabilize cash flow.
Interest rates and franchisee finance
Higher policy rates (Fed funds 5.25–5.50% as of June 2025) raise debt service and cap rates, slowing new builds and PIP activity as financing costs climb. Franchisees may defer renovations, risking standards and guest satisfaction. Choice can push conversions and asset-light growth in lower-capex formats. Vendor financing and negotiated supplier terms help sustain pipeline momentum.

Inflation and cost pass-through
Wage, utility and breakfast input inflation have squeezed franchisee margins as operating costs rose faster than room rates; ADR increases typically lag cost spikes when demand softens, compressing flow-through to owners. Choice’s centralized procurement and revenue-management/dynamic-pricing tools boost cost and rate pass-through. Brand tiering across economy to upscale flags lets guests trade down within the portfolio rather than leaving the system, preserving occupancy and capture.

FX and international exposure
Currency swings influence inbound travel and translation of international fees for Choice Hotels, where a stronger US dollar in 2024 weighed on overseas demand for US stays while supporting outbound travel and dollar-reported fee receipts.
Choice’s diversified footprint—about 7,100 franchised properties across roughly 50 countries—helps balance regional cycles and FX moves; local-currency pricing and selective hedging are used to stabilize cash flows and reported royalties.
- FX impact on demand, translation of fees, hedging/local pricing, diversified footprint
OTA mix and distribution costs
High reliance on OTAs raises commission drag—OTAs commonly charge 15–25% commissions, which erodes margins most when demand softens and ADR falls. Choice’s direct channels—Choice Privileges-driven bookings and mobile app reservations—help protect margins by lowering third-party fees. Choice’s centralized CRS and marketing scale enable shifting mix toward owned channels and negotiating parity and packaged deals to reduce rate leakage and dependency.
- OTA commission range: 15–25%
- Direct channels protect margins
- CRS/scale can increase owned bookings
- Parity/packages reduce leakage
Political risks and taxes trigger occupancy swings across ~7,400 hotels
Choice’s fee‑based, franchised model magnifies RevPAR swings; occupancy/ADR follow GDP and corporate travel cycles while extended‑stay and economy tiers cushion downturns. Higher policy rates (Fed funds 5.25–5.50% as of June 2025) raise cap rates and financing costs, slowing PIP activity. Rising wages/utilities and OTA commissions (15–25%) compress owner margins; Choice’s direct channels and centralized procurement improve pass‑through and mix.
| Metric | Value |
|---|---|
| Fed funds (Jun 2025) | 5.25–5.50% |
| Franchised properties | ≈7,100 |
| Operating countries | ≈50 |
| OTA commission | 15–25% |
What You See Is What You Get
Choice Hotels PESTLE Analysis
This preview of the Choice Hotels PESTLE Analysis is the exact document you’ll receive after purchase—fully formatted and ready to use. The content, layout and structure shown are identical to the downloadable file. No placeholders or teasers. You’ll get this final, professionally structured report immediately after checkout.

Make Smarter Strategic Decisions with a Complete PESTEL View
Discover key political, economic, social, technological, legal and environmental forces shaping Choice Hotels and its growth prospects. Our concise PESTLE highlights regulatory risks, market trends and operational threats you need to know. Buy the full analysis to get the complete, actionable report instantly.
Political factors
Travel and visa policies
Inbound tourism, which reached about 1.4 billion international arrivals in 2023 (roughly 80% of 2019 levels, UNWTO), hinges on visa processing speeds, reciprocity and geopolitical stability. Tightened entry rules or embassy backlogs can curb international demand to Choice Hotels franchisees—Choice operates over 7,100 properties worldwide. The brand must flex marketing between domestic and international segments to smooth volatility and coordinate with destination marketing organizations and lobbying bodies to mitigate policy shocks.
Local incentives and taxes
Hotel occupancy taxes, tourism levies and municipal incentives—often ranging across jurisdictions from roughly 4% to 17% on room revenue—directly shape Choice Hotels' franchise economics and RevPAR. Political decisions to add or remove abatements alter new-construction and conversion pipelines, affecting Choice’s pipeline of thousands of franchised rooms. Shifts in property tax assessments can compress margins in lower ADR markets, so Choice steers development to jurisdictions with stable, favorable policy.
Geopolitical risk and security
Conflicts, sanctions and terrorism alerts reroute travel and raise insurance and security costs, forcing higher operating overheads for hoteliers and insurers alike.
Corporate and group travel freezes can quickly depress RevPAR in affected regions; Choice Hotels operates over 7,400 franchised and managed properties across 40+ countries, giving scale but also exposure.
Choice’s diversified brand mix and geographies help hedge risk but require agile demand redistribution, crisis communications and flexible cancellation policies to stabilize bookings and protect cash flow.
Public health preparedness
Government outbreak responses (restrictions, travel advisories) directly shift occupancy—U.S. hotel occupancy averaged ~64% in 2023–24—impacting Choice’s ~7,100 franchised hotels and revenue flow. Clear sanitation and ventilation policies shape guest confidence and add compliance costs; Choice’s standardized cleaning and HVAC protocols reduce franchisee adaptation time and legal risk. Strategic partnerships with authorities help secure essential-lodging status when demand shifts.
- government restrictions → immediate occupancy swings
- policy clarity ↔ guest confidence & compliance cost
- standardized protocols aid 7,100 franchisees
- authority partnerships = essential-lodging access
Government support for tourism
- Destination marketing lifts demand — UNWTO: 2023 = 88% of 2019 arrivals
- Infrastructure funding — IIJA: $1.2 trillion
- FAA AIP funding ~ $3.3B/year aids regional air links
- Subsidies accelerate renovations and ADA compliance
Political risks and taxes trigger occupancy swings across ~7,400 hotels
Political risks—visa rules, sanctions and travel advisories—drive occupancy volatility for Choice Hotels (≈7,400 properties); 2023 inbound travel ≈1.4B arrivals (~80% of 2019, UNWTO) and US hotel occupancy ~64% in 2023–24. Taxes/levies (roughly 4–17%) and incentives reshape franchise economics; IIJA $1.2T and FAA AIP ~$3.3B/yr influence regional development.
| Metric | Value |
|---|---|
| Properties | ~7,400 |
| Inbound arrivals 2023 | 1.4B (~80% 2019) |
| US occupancy 2023–24 | ~64% |
| Typical room taxes | 4–17% |
| IIJA | $1.2T |
| FAA AIP | ~$3.3B/yr |
What is included in the product
Detailed Word Document
Explores how macro-environmental factors uniquely affect Choice Hotels across Political, Economic, Social, Technological, Environmental, and Legal dimensions, with data-driven trends, forward-looking insights, and specific sub-points to help executives, consultants, and investors identify risks, opportunities, and strategic actions.
Customizable Excel Spreadsheet
A concise, visually segmented Choice Hotels PESTLE summary that highlights external risks and opportunities for quick reference, easily editable for regional context and drop-in ready for presentations or team alignment.
Economic factors
Macro cycles and RevPAR
Occupancy and ADR at Choice track macro cycles tied to GDP, employment and corporate travel, with economy and midscale segments historically more resilient though vulnerable to rate pressure in downturns; Choice’s fee-based revenue model scales with franchise performance, amplifying exposure to RevPAR swings; disciplined revenue management and a growing extended-stay mix help cushion downturns and stabilize cash flow.
Interest rates and franchisee finance
Higher policy rates (Fed funds 5.25–5.50% as of June 2025) raise debt service and cap rates, slowing new builds and PIP activity as financing costs climb. Franchisees may defer renovations, risking standards and guest satisfaction. Choice can push conversions and asset-light growth in lower-capex formats. Vendor financing and negotiated supplier terms help sustain pipeline momentum.
Inflation and cost pass-through
Wage, utility and breakfast input inflation have squeezed franchisee margins as operating costs rose faster than room rates; ADR increases typically lag cost spikes when demand softens, compressing flow-through to owners. Choice’s centralized procurement and revenue-management/dynamic-pricing tools boost cost and rate pass-through. Brand tiering across economy to upscale flags lets guests trade down within the portfolio rather than leaving the system, preserving occupancy and capture.
FX and international exposure
Currency swings influence inbound travel and translation of international fees for Choice Hotels, where a stronger US dollar in 2024 weighed on overseas demand for US stays while supporting outbound travel and dollar-reported fee receipts.
Choice’s diversified footprint—about 7,100 franchised properties across roughly 50 countries—helps balance regional cycles and FX moves; local-currency pricing and selective hedging are used to stabilize cash flows and reported royalties.
- FX impact on demand, translation of fees, hedging/local pricing, diversified footprint
OTA mix and distribution costs
High reliance on OTAs raises commission drag—OTAs commonly charge 15–25% commissions, which erodes margins most when demand softens and ADR falls. Choice’s direct channels—Choice Privileges-driven bookings and mobile app reservations—help protect margins by lowering third-party fees. Choice’s centralized CRS and marketing scale enable shifting mix toward owned channels and negotiating parity and packaged deals to reduce rate leakage and dependency.
- OTA commission range: 15–25%
- Direct channels protect margins
- CRS/scale can increase owned bookings
- Parity/packages reduce leakage
Political risks and taxes trigger occupancy swings across ~7,400 hotels
Choice’s fee‑based, franchised model magnifies RevPAR swings; occupancy/ADR follow GDP and corporate travel cycles while extended‑stay and economy tiers cushion downturns. Higher policy rates (Fed funds 5.25–5.50% as of June 2025) raise cap rates and financing costs, slowing PIP activity. Rising wages/utilities and OTA commissions (15–25%) compress owner margins; Choice’s direct channels and centralized procurement improve pass‑through and mix.
| Metric | Value |
|---|---|
| Fed funds (Jun 2025) | 5.25–5.50% |
| Franchised properties | ≈7,100 |
| Operating countries | ≈50 |
| OTA commission | 15–25% |
What You See Is What You Get
Choice Hotels PESTLE Analysis
This preview of the Choice Hotels PESTLE Analysis is the exact document you’ll receive after purchase—fully formatted and ready to use. The content, layout and structure shown are identical to the downloadable file. No placeholders or teasers. You’ll get this final, professionally structured report immediately after checkout.
Original: $10.00
-65%$10.00
$3.50Description
Make Smarter Strategic Decisions with a Complete PESTEL View
Discover key political, economic, social, technological, legal and environmental forces shaping Choice Hotels and its growth prospects. Our concise PESTLE highlights regulatory risks, market trends and operational threats you need to know. Buy the full analysis to get the complete, actionable report instantly.
Political factors
Travel and visa policies
Inbound tourism, which reached about 1.4 billion international arrivals in 2023 (roughly 80% of 2019 levels, UNWTO), hinges on visa processing speeds, reciprocity and geopolitical stability. Tightened entry rules or embassy backlogs can curb international demand to Choice Hotels franchisees—Choice operates over 7,100 properties worldwide. The brand must flex marketing between domestic and international segments to smooth volatility and coordinate with destination marketing organizations and lobbying bodies to mitigate policy shocks.
Local incentives and taxes
Hotel occupancy taxes, tourism levies and municipal incentives—often ranging across jurisdictions from roughly 4% to 17% on room revenue—directly shape Choice Hotels' franchise economics and RevPAR. Political decisions to add or remove abatements alter new-construction and conversion pipelines, affecting Choice’s pipeline of thousands of franchised rooms. Shifts in property tax assessments can compress margins in lower ADR markets, so Choice steers development to jurisdictions with stable, favorable policy.
Geopolitical risk and security
Conflicts, sanctions and terrorism alerts reroute travel and raise insurance and security costs, forcing higher operating overheads for hoteliers and insurers alike.
Corporate and group travel freezes can quickly depress RevPAR in affected regions; Choice Hotels operates over 7,400 franchised and managed properties across 40+ countries, giving scale but also exposure.
Choice’s diversified brand mix and geographies help hedge risk but require agile demand redistribution, crisis communications and flexible cancellation policies to stabilize bookings and protect cash flow.
Public health preparedness
Government outbreak responses (restrictions, travel advisories) directly shift occupancy—U.S. hotel occupancy averaged ~64% in 2023–24—impacting Choice’s ~7,100 franchised hotels and revenue flow. Clear sanitation and ventilation policies shape guest confidence and add compliance costs; Choice’s standardized cleaning and HVAC protocols reduce franchisee adaptation time and legal risk. Strategic partnerships with authorities help secure essential-lodging status when demand shifts.
- government restrictions → immediate occupancy swings
- policy clarity ↔ guest confidence & compliance cost
- standardized protocols aid 7,100 franchisees
- authority partnerships = essential-lodging access
Government support for tourism
- Destination marketing lifts demand — UNWTO: 2023 = 88% of 2019 arrivals
- Infrastructure funding — IIJA: $1.2 trillion
- FAA AIP funding ~ $3.3B/year aids regional air links
- Subsidies accelerate renovations and ADA compliance
Political risks and taxes trigger occupancy swings across ~7,400 hotels
Political risks—visa rules, sanctions and travel advisories—drive occupancy volatility for Choice Hotels (≈7,400 properties); 2023 inbound travel ≈1.4B arrivals (~80% of 2019, UNWTO) and US hotel occupancy ~64% in 2023–24. Taxes/levies (roughly 4–17%) and incentives reshape franchise economics; IIJA $1.2T and FAA AIP ~$3.3B/yr influence regional development.
| Metric | Value |
|---|---|
| Properties | ~7,400 |
| Inbound arrivals 2023 | 1.4B (~80% 2019) |
| US occupancy 2023–24 | ~64% |
| Typical room taxes | 4–17% |
| IIJA | $1.2T |
| FAA AIP | ~$3.3B/yr |
What is included in the product
Detailed Word Document
Explores how macro-environmental factors uniquely affect Choice Hotels across Political, Economic, Social, Technological, Environmental, and Legal dimensions, with data-driven trends, forward-looking insights, and specific sub-points to help executives, consultants, and investors identify risks, opportunities, and strategic actions.
Customizable Excel Spreadsheet
A concise, visually segmented Choice Hotels PESTLE summary that highlights external risks and opportunities for quick reference, easily editable for regional context and drop-in ready for presentations or team alignment.
Economic factors
Macro cycles and RevPAR
Occupancy and ADR at Choice track macro cycles tied to GDP, employment and corporate travel, with economy and midscale segments historically more resilient though vulnerable to rate pressure in downturns; Choice’s fee-based revenue model scales with franchise performance, amplifying exposure to RevPAR swings; disciplined revenue management and a growing extended-stay mix help cushion downturns and stabilize cash flow.
Interest rates and franchisee finance
Higher policy rates (Fed funds 5.25–5.50% as of June 2025) raise debt service and cap rates, slowing new builds and PIP activity as financing costs climb. Franchisees may defer renovations, risking standards and guest satisfaction. Choice can push conversions and asset-light growth in lower-capex formats. Vendor financing and negotiated supplier terms help sustain pipeline momentum.
Inflation and cost pass-through
Wage, utility and breakfast input inflation have squeezed franchisee margins as operating costs rose faster than room rates; ADR increases typically lag cost spikes when demand softens, compressing flow-through to owners. Choice’s centralized procurement and revenue-management/dynamic-pricing tools boost cost and rate pass-through. Brand tiering across economy to upscale flags lets guests trade down within the portfolio rather than leaving the system, preserving occupancy and capture.
FX and international exposure
Currency swings influence inbound travel and translation of international fees for Choice Hotels, where a stronger US dollar in 2024 weighed on overseas demand for US stays while supporting outbound travel and dollar-reported fee receipts.
Choice’s diversified footprint—about 7,100 franchised properties across roughly 50 countries—helps balance regional cycles and FX moves; local-currency pricing and selective hedging are used to stabilize cash flows and reported royalties.
- FX impact on demand, translation of fees, hedging/local pricing, diversified footprint
OTA mix and distribution costs
High reliance on OTAs raises commission drag—OTAs commonly charge 15–25% commissions, which erodes margins most when demand softens and ADR falls. Choice’s direct channels—Choice Privileges-driven bookings and mobile app reservations—help protect margins by lowering third-party fees. Choice’s centralized CRS and marketing scale enable shifting mix toward owned channels and negotiating parity and packaged deals to reduce rate leakage and dependency.
- OTA commission range: 15–25%
- Direct channels protect margins
- CRS/scale can increase owned bookings
- Parity/packages reduce leakage
Political risks and taxes trigger occupancy swings across ~7,400 hotels
Choice’s fee‑based, franchised model magnifies RevPAR swings; occupancy/ADR follow GDP and corporate travel cycles while extended‑stay and economy tiers cushion downturns. Higher policy rates (Fed funds 5.25–5.50% as of June 2025) raise cap rates and financing costs, slowing PIP activity. Rising wages/utilities and OTA commissions (15–25%) compress owner margins; Choice’s direct channels and centralized procurement improve pass‑through and mix.
| Metric | Value |
|---|---|
| Fed funds (Jun 2025) | 5.25–5.50% |
| Franchised properties | ≈7,100 |
| Operating countries | ≈50 |
| OTA commission | 15–25% |
What You See Is What You Get
Choice Hotels PESTLE Analysis
This preview of the Choice Hotels PESTLE Analysis is the exact document you’ll receive after purchase—fully formatted and ready to use. The content, layout and structure shown are identical to the downloadable file. No placeholders or teasers. You’ll get this final, professionally structured report immediately after checkout.











