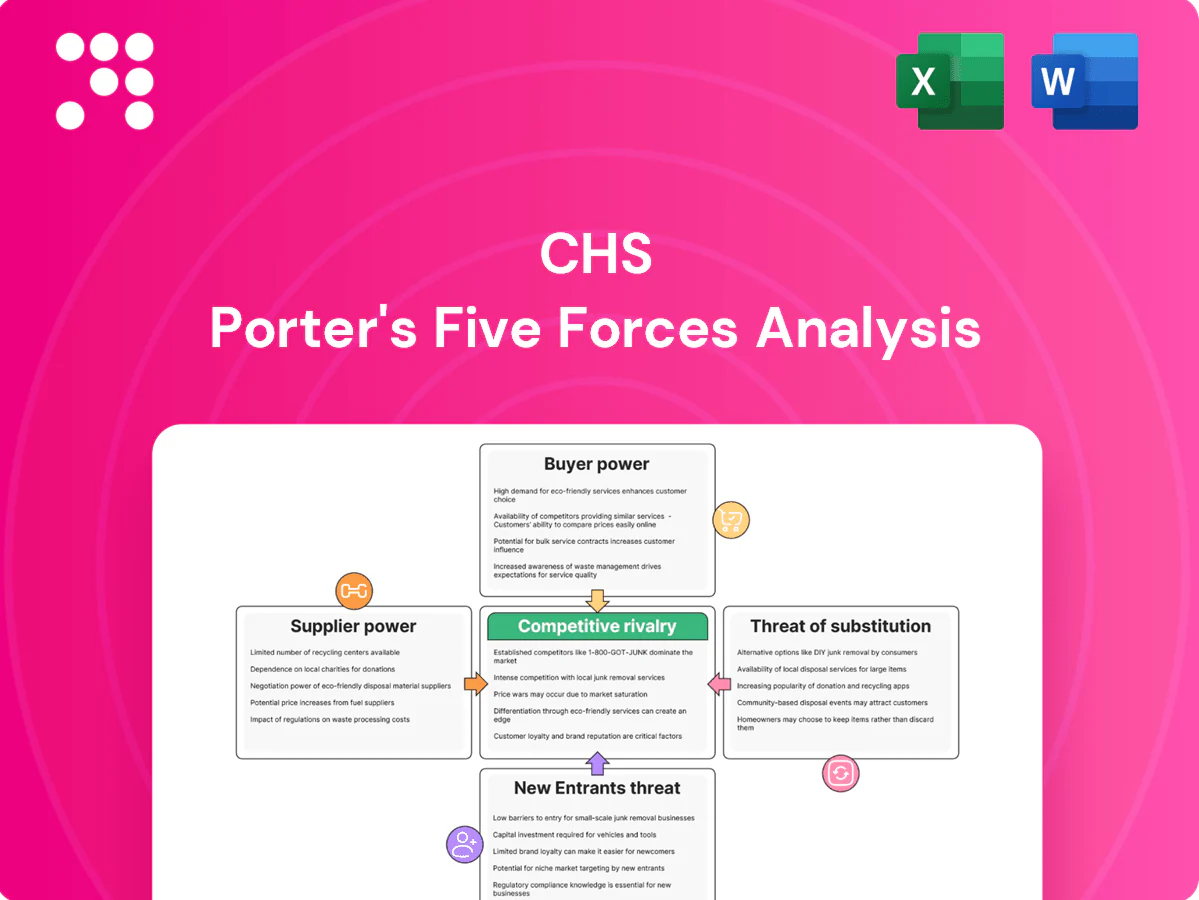
CHS Porter's Five Forces Analysis

Don't Miss the Bigger Picture
CHS’s Porter's Five Forces snapshot highlights competitive intensity, supplier and buyer leverage, substitute risks, and entry barriers shaping its margins and strategy. This brief teases key pressures and strategic levers. Unlock the full Porter's Five Forces Analysis to access force-by-force ratings, visuals, and actionable insights for smarter decisions.
Suppliers Bargaining Power

Concentrated device and pharma vendors
Large med-tech and pharma suppliers wield strong pricing power over essential implants, drugs and disposables; the top four orthopedics vendors account for roughly 80% of joint-replacement share and specialty drugs comprised over 50% of hospital drug spend in 2024. GPO contracting—used by over 90% of US hospitals—helps CHS aggregate demand but cannot fully neutralize specialty monopolies. Supply shortages or recalls can sharply tighten availability and push costs higher, while switching is constrained by clinical equivalence, physician preference and regulatory standards.
Clinician and nursing labor scarcity
Nurse and specialized clinician shortages have driven higher wages, signing bonuses and heavy agency reliance, squeezing CHS margins and reducing service capacity. Post-pandemic burnout and increased union activity limit staffing flexibility and elevate retention costs. Recruitment is harder in rural markets, forcing premium compensation or service consolidation to maintain coverage.

Physician affiliation and referrals
Independent physicians still control patient flow and procedure mix, and as of 2024 hospital employment of physicians exceeded half of US doctors, shifting but not eliminating referral power. Alignment via employment, JV ASCs and call-coverage deals can require significant capital and guarantee payments, raising costs for CHS. Strong specialists can still negotiate favorable terms or divert cases, so CHS maintains service-line completeness to reduce leverage from key practices.

IT, EHR, and revenue-cycle platforms
Utilities and facility services
Utilities and facility services (oxygen, sterilization, laundry) are mission-critical with few substitutes, giving suppliers structural power despite buyers' scale; AHA 2024 reported non-labor supply cost inflation around 6% year-over-year, pressuring margins. Local utility monopolies limit bilateral leverage, while payer reimbursement lags mean input inflation flows through slowly. Multi-year sourcing, backup suppliers and contingency plans reduce single-point failure risk.
- Essential services: low substitution
- Supplier power: localized monopolies
- 2024 supply inflation: ~6% (AHA)
- Mitigation: multi-year contracts, contingencies
Supplier dominance pressures hospitals - concentrated ortho, specialty drugs, IT vendor lock-in
Suppliers exert strong leverage: top-4 orthopedics ~80% joint-replacement share and specialty drugs >50% of hospital drug spend (2024); GPOs cover >90% of US hospitals but cannot fully offset monopolies. Clinician and IT vendors (Epic+Cerner ~60% 2024) create high switching costs; non-labor supply inflation ~6% (AHA 2024).
| Metric | Value |
|---|---|
| Top-4 ortho share (2024) | ~80% |
| Specialty drug hospital spend (2024) | >50% |
| GPO hospital coverage | >90% |
| Epic+Cerner market (2024) | ~60% |
| Supply inflation (AHA 2024) | ~6% |
What is included in the product
 Detailed Word Document
Tailored Porter's Five Forces analysis of CHS that uncovers competitive intensity, supplier and buyer power, threat of substitutes, and barriers to entry. Highlights disruptive risks and strategic levers affecting CHS's pricing, profitability, and market positioning.

 Customizable Excel Spreadsheet
A concise, one-sheet CHS Porter’s Five Forces view that translates complex industry pressures into actionable insights—perfect for quick decision-making and slide-ready reporting.
Customers Bargaining Power

Commercial payers’ rate leverage
National and regional insurers negotiate network rates aggressively; in 2024 the largest commercial payers represent roughly two-thirds of market enrollment, amplifying buyer leverage. In non-urban markets CHS often holds must-have status, which tempers payer discounts. Growth of narrow networks and tiering has strengthened payer bargaining power, and contracting outcomes drive meaningful margin variability across CHS markets.
Government reimbursement dependence
CHS faces heavy government reimbursement dependence as Medicare and Medicaid administer prices with limited negotiation, often comprising over 40% of payor mix and averaging ~52% Medicare share in rural facilities. Rural/non-urban mix compresses yields versus commercial rates. Sequestration (roughly a 2% cut) and policy shifts directly hit revenue. Supplemental and state-specific payments (eg DSH/RAI) provide relief but are volatile and uncertain.

Employer and PBM-influenced steerage
Employers push site-of-care shifts and bundled payments to cut costs, steering cases toward outpatient centers and ambulatory surgery sites. PBMs and payers—three PBMs cover roughly 80% of US prescription volume—favor outpatient settings and biosimilars, reducing inpatient volumes. Reference pricing and centers-of-excellence programs increasingly redirect high-margin cases to lower-cost providers. CMS hospital price-transparency rules (effective 2021) enable tougher buyer comparisons.

Patient cost sensitivity
Rising patient cost sensitivity drives price shopping for shoppable services as average employer single deductibles climbed to about $1,900 in 2024, increasing out-of-pocket exposure and bargaining power. Reputation, quality scores and convenience now heavily influence choice, while financial assistance and flexible payment plans lower revenue leakage. Poor experiences amplify patient outmigration to competitors and retail health entrants.
- High deductibles ~ $1,900 (2024)
- Price shopping up for shoppable services
- Reputation, quality, convenience sway choice
- Financial aid reduces leakage
- Poor experience increases churn
Case-mix and acuity dependence
- Buyers shift inpatient→outpatient
- ASCs ≈30% elective ortho (2024)
- Trauma/cardiac/ICU sustain indispensability
- Data + VBCs can restore leverage if outcomes excel
Buyers wield leverage: top payers ~66%, public mix > 40%, ASC shift
Buyers wield strong leverage: top commercial payers cover ~66% enrollment, driving aggressive rate negotiation. Public payors (Medicare/Medicaid) exceed 40% of mix, compressing yields. Site-of-care shifts (ASC share ~30% elective ortho) and rising deductibles (~$1,900) amplify price sensitivity and steer volumes.
| Metric | 2024 |
|---|---|
| Top payer share | ~66% |
| Public payor mix | >40% |
| ASC elective ortho | ~30% |
| Avg employer single deductible | $1,900 |
Same Document Delivered
CHS Porter's Five Forces Analysis
This preview shows the exact CHS Porter's Five Forces Analysis you'll receive immediately after purchase—no placeholders or mockups. The document is fully formatted, professionally written, and ready for download and use the moment you buy. You'll get instant access to this identical file with no additional setup required.

Don't Miss the Bigger Picture
CHS’s Porter's Five Forces snapshot highlights competitive intensity, supplier and buyer leverage, substitute risks, and entry barriers shaping its margins and strategy. This brief teases key pressures and strategic levers. Unlock the full Porter's Five Forces Analysis to access force-by-force ratings, visuals, and actionable insights for smarter decisions.
Suppliers Bargaining Power
Concentrated device and pharma vendors
Large med-tech and pharma suppliers wield strong pricing power over essential implants, drugs and disposables; the top four orthopedics vendors account for roughly 80% of joint-replacement share and specialty drugs comprised over 50% of hospital drug spend in 2024. GPO contracting—used by over 90% of US hospitals—helps CHS aggregate demand but cannot fully neutralize specialty monopolies. Supply shortages or recalls can sharply tighten availability and push costs higher, while switching is constrained by clinical equivalence, physician preference and regulatory standards.
Clinician and nursing labor scarcity
Nurse and specialized clinician shortages have driven higher wages, signing bonuses and heavy agency reliance, squeezing CHS margins and reducing service capacity. Post-pandemic burnout and increased union activity limit staffing flexibility and elevate retention costs. Recruitment is harder in rural markets, forcing premium compensation or service consolidation to maintain coverage.
Physician affiliation and referrals
Independent physicians still control patient flow and procedure mix, and as of 2024 hospital employment of physicians exceeded half of US doctors, shifting but not eliminating referral power. Alignment via employment, JV ASCs and call-coverage deals can require significant capital and guarantee payments, raising costs for CHS. Strong specialists can still negotiate favorable terms or divert cases, so CHS maintains service-line completeness to reduce leverage from key practices.
IT, EHR, and revenue-cycle platforms
Utilities and facility services
Utilities and facility services (oxygen, sterilization, laundry) are mission-critical with few substitutes, giving suppliers structural power despite buyers' scale; AHA 2024 reported non-labor supply cost inflation around 6% year-over-year, pressuring margins. Local utility monopolies limit bilateral leverage, while payer reimbursement lags mean input inflation flows through slowly. Multi-year sourcing, backup suppliers and contingency plans reduce single-point failure risk.
- Essential services: low substitution
- Supplier power: localized monopolies
- 2024 supply inflation: ~6% (AHA)
- Mitigation: multi-year contracts, contingencies
Supplier dominance pressures hospitals - concentrated ortho, specialty drugs, IT vendor lock-in
Suppliers exert strong leverage: top-4 orthopedics ~80% joint-replacement share and specialty drugs >50% of hospital drug spend (2024); GPOs cover >90% of US hospitals but cannot fully offset monopolies. Clinician and IT vendors (Epic+Cerner ~60% 2024) create high switching costs; non-labor supply inflation ~6% (AHA 2024).
| Metric | Value |
|---|---|
| Top-4 ortho share (2024) | ~80% |
| Specialty drug hospital spend (2024) | >50% |
| GPO hospital coverage | >90% |
| Epic+Cerner market (2024) | ~60% |
| Supply inflation (AHA 2024) | ~6% |
What is included in the product
Detailed Word Document
Tailored Porter's Five Forces analysis of CHS that uncovers competitive intensity, supplier and buyer power, threat of substitutes, and barriers to entry. Highlights disruptive risks and strategic levers affecting CHS's pricing, profitability, and market positioning.
Customizable Excel Spreadsheet
A concise, one-sheet CHS Porter’s Five Forces view that translates complex industry pressures into actionable insights—perfect for quick decision-making and slide-ready reporting.
Customers Bargaining Power
Commercial payers’ rate leverage
National and regional insurers negotiate network rates aggressively; in 2024 the largest commercial payers represent roughly two-thirds of market enrollment, amplifying buyer leverage. In non-urban markets CHS often holds must-have status, which tempers payer discounts. Growth of narrow networks and tiering has strengthened payer bargaining power, and contracting outcomes drive meaningful margin variability across CHS markets.
Government reimbursement dependence
CHS faces heavy government reimbursement dependence as Medicare and Medicaid administer prices with limited negotiation, often comprising over 40% of payor mix and averaging ~52% Medicare share in rural facilities. Rural/non-urban mix compresses yields versus commercial rates. Sequestration (roughly a 2% cut) and policy shifts directly hit revenue. Supplemental and state-specific payments (eg DSH/RAI) provide relief but are volatile and uncertain.
Employer and PBM-influenced steerage
Employers push site-of-care shifts and bundled payments to cut costs, steering cases toward outpatient centers and ambulatory surgery sites. PBMs and payers—three PBMs cover roughly 80% of US prescription volume—favor outpatient settings and biosimilars, reducing inpatient volumes. Reference pricing and centers-of-excellence programs increasingly redirect high-margin cases to lower-cost providers. CMS hospital price-transparency rules (effective 2021) enable tougher buyer comparisons.
Patient cost sensitivity
Rising patient cost sensitivity drives price shopping for shoppable services as average employer single deductibles climbed to about $1,900 in 2024, increasing out-of-pocket exposure and bargaining power. Reputation, quality scores and convenience now heavily influence choice, while financial assistance and flexible payment plans lower revenue leakage. Poor experiences amplify patient outmigration to competitors and retail health entrants.
- High deductibles ~ $1,900 (2024)
- Price shopping up for shoppable services
- Reputation, quality, convenience sway choice
- Financial aid reduces leakage
- Poor experience increases churn
Case-mix and acuity dependence
- Buyers shift inpatient→outpatient
- ASCs ≈30% elective ortho (2024)
- Trauma/cardiac/ICU sustain indispensability
- Data + VBCs can restore leverage if outcomes excel
Buyers wield leverage: top payers ~66%, public mix > 40%, ASC shift
Buyers wield strong leverage: top commercial payers cover ~66% enrollment, driving aggressive rate negotiation. Public payors (Medicare/Medicaid) exceed 40% of mix, compressing yields. Site-of-care shifts (ASC share ~30% elective ortho) and rising deductibles (~$1,900) amplify price sensitivity and steer volumes.
| Metric | 2024 |
|---|---|
| Top payer share | ~66% |
| Public payor mix | >40% |
| ASC elective ortho | ~30% |
| Avg employer single deductible | $1,900 |
Same Document Delivered
CHS Porter's Five Forces Analysis
This preview shows the exact CHS Porter's Five Forces Analysis you'll receive immediately after purchase—no placeholders or mockups. The document is fully formatted, professionally written, and ready for download and use the moment you buy. You'll get instant access to this identical file with no additional setup required.
Original: $10.00
-65%$10.00
$3.50Description
Don't Miss the Bigger Picture
CHS’s Porter's Five Forces snapshot highlights competitive intensity, supplier and buyer leverage, substitute risks, and entry barriers shaping its margins and strategy. This brief teases key pressures and strategic levers. Unlock the full Porter's Five Forces Analysis to access force-by-force ratings, visuals, and actionable insights for smarter decisions.
Suppliers Bargaining Power
Concentrated device and pharma vendors
Large med-tech and pharma suppliers wield strong pricing power over essential implants, drugs and disposables; the top four orthopedics vendors account for roughly 80% of joint-replacement share and specialty drugs comprised over 50% of hospital drug spend in 2024. GPO contracting—used by over 90% of US hospitals—helps CHS aggregate demand but cannot fully neutralize specialty monopolies. Supply shortages or recalls can sharply tighten availability and push costs higher, while switching is constrained by clinical equivalence, physician preference and regulatory standards.
Clinician and nursing labor scarcity
Nurse and specialized clinician shortages have driven higher wages, signing bonuses and heavy agency reliance, squeezing CHS margins and reducing service capacity. Post-pandemic burnout and increased union activity limit staffing flexibility and elevate retention costs. Recruitment is harder in rural markets, forcing premium compensation or service consolidation to maintain coverage.
Physician affiliation and referrals
Independent physicians still control patient flow and procedure mix, and as of 2024 hospital employment of physicians exceeded half of US doctors, shifting but not eliminating referral power. Alignment via employment, JV ASCs and call-coverage deals can require significant capital and guarantee payments, raising costs for CHS. Strong specialists can still negotiate favorable terms or divert cases, so CHS maintains service-line completeness to reduce leverage from key practices.
IT, EHR, and revenue-cycle platforms
Utilities and facility services
Utilities and facility services (oxygen, sterilization, laundry) are mission-critical with few substitutes, giving suppliers structural power despite buyers' scale; AHA 2024 reported non-labor supply cost inflation around 6% year-over-year, pressuring margins. Local utility monopolies limit bilateral leverage, while payer reimbursement lags mean input inflation flows through slowly. Multi-year sourcing, backup suppliers and contingency plans reduce single-point failure risk.
- Essential services: low substitution
- Supplier power: localized monopolies
- 2024 supply inflation: ~6% (AHA)
- Mitigation: multi-year contracts, contingencies
Supplier dominance pressures hospitals - concentrated ortho, specialty drugs, IT vendor lock-in
Suppliers exert strong leverage: top-4 orthopedics ~80% joint-replacement share and specialty drugs >50% of hospital drug spend (2024); GPOs cover >90% of US hospitals but cannot fully offset monopolies. Clinician and IT vendors (Epic+Cerner ~60% 2024) create high switching costs; non-labor supply inflation ~6% (AHA 2024).
| Metric | Value |
|---|---|
| Top-4 ortho share (2024) | ~80% |
| Specialty drug hospital spend (2024) | >50% |
| GPO hospital coverage | >90% |
| Epic+Cerner market (2024) | ~60% |
| Supply inflation (AHA 2024) | ~6% |
What is included in the product
Detailed Word Document
Tailored Porter's Five Forces analysis of CHS that uncovers competitive intensity, supplier and buyer power, threat of substitutes, and barriers to entry. Highlights disruptive risks and strategic levers affecting CHS's pricing, profitability, and market positioning.
Customizable Excel Spreadsheet
A concise, one-sheet CHS Porter’s Five Forces view that translates complex industry pressures into actionable insights—perfect for quick decision-making and slide-ready reporting.
Customers Bargaining Power
Commercial payers’ rate leverage
National and regional insurers negotiate network rates aggressively; in 2024 the largest commercial payers represent roughly two-thirds of market enrollment, amplifying buyer leverage. In non-urban markets CHS often holds must-have status, which tempers payer discounts. Growth of narrow networks and tiering has strengthened payer bargaining power, and contracting outcomes drive meaningful margin variability across CHS markets.
Government reimbursement dependence
CHS faces heavy government reimbursement dependence as Medicare and Medicaid administer prices with limited negotiation, often comprising over 40% of payor mix and averaging ~52% Medicare share in rural facilities. Rural/non-urban mix compresses yields versus commercial rates. Sequestration (roughly a 2% cut) and policy shifts directly hit revenue. Supplemental and state-specific payments (eg DSH/RAI) provide relief but are volatile and uncertain.
Employer and PBM-influenced steerage
Employers push site-of-care shifts and bundled payments to cut costs, steering cases toward outpatient centers and ambulatory surgery sites. PBMs and payers—three PBMs cover roughly 80% of US prescription volume—favor outpatient settings and biosimilars, reducing inpatient volumes. Reference pricing and centers-of-excellence programs increasingly redirect high-margin cases to lower-cost providers. CMS hospital price-transparency rules (effective 2021) enable tougher buyer comparisons.
Patient cost sensitivity
Rising patient cost sensitivity drives price shopping for shoppable services as average employer single deductibles climbed to about $1,900 in 2024, increasing out-of-pocket exposure and bargaining power. Reputation, quality scores and convenience now heavily influence choice, while financial assistance and flexible payment plans lower revenue leakage. Poor experiences amplify patient outmigration to competitors and retail health entrants.
- High deductibles ~ $1,900 (2024)
- Price shopping up for shoppable services
- Reputation, quality, convenience sway choice
- Financial aid reduces leakage
- Poor experience increases churn
Case-mix and acuity dependence
- Buyers shift inpatient→outpatient
- ASCs ≈30% elective ortho (2024)
- Trauma/cardiac/ICU sustain indispensability
- Data + VBCs can restore leverage if outcomes excel
Buyers wield leverage: top payers ~66%, public mix > 40%, ASC shift
Buyers wield strong leverage: top commercial payers cover ~66% enrollment, driving aggressive rate negotiation. Public payors (Medicare/Medicaid) exceed 40% of mix, compressing yields. Site-of-care shifts (ASC share ~30% elective ortho) and rising deductibles (~$1,900) amplify price sensitivity and steer volumes.
| Metric | 2024 |
|---|---|
| Top payer share | ~66% |
| Public payor mix | >40% |
| ASC elective ortho | ~30% |
| Avg employer single deductible | $1,900 |
Same Document Delivered
CHS Porter's Five Forces Analysis
This preview shows the exact CHS Porter's Five Forces Analysis you'll receive immediately after purchase—no placeholders or mockups. The document is fully formatted, professionally written, and ready for download and use the moment you buy. You'll get instant access to this identical file with no additional setup required.











