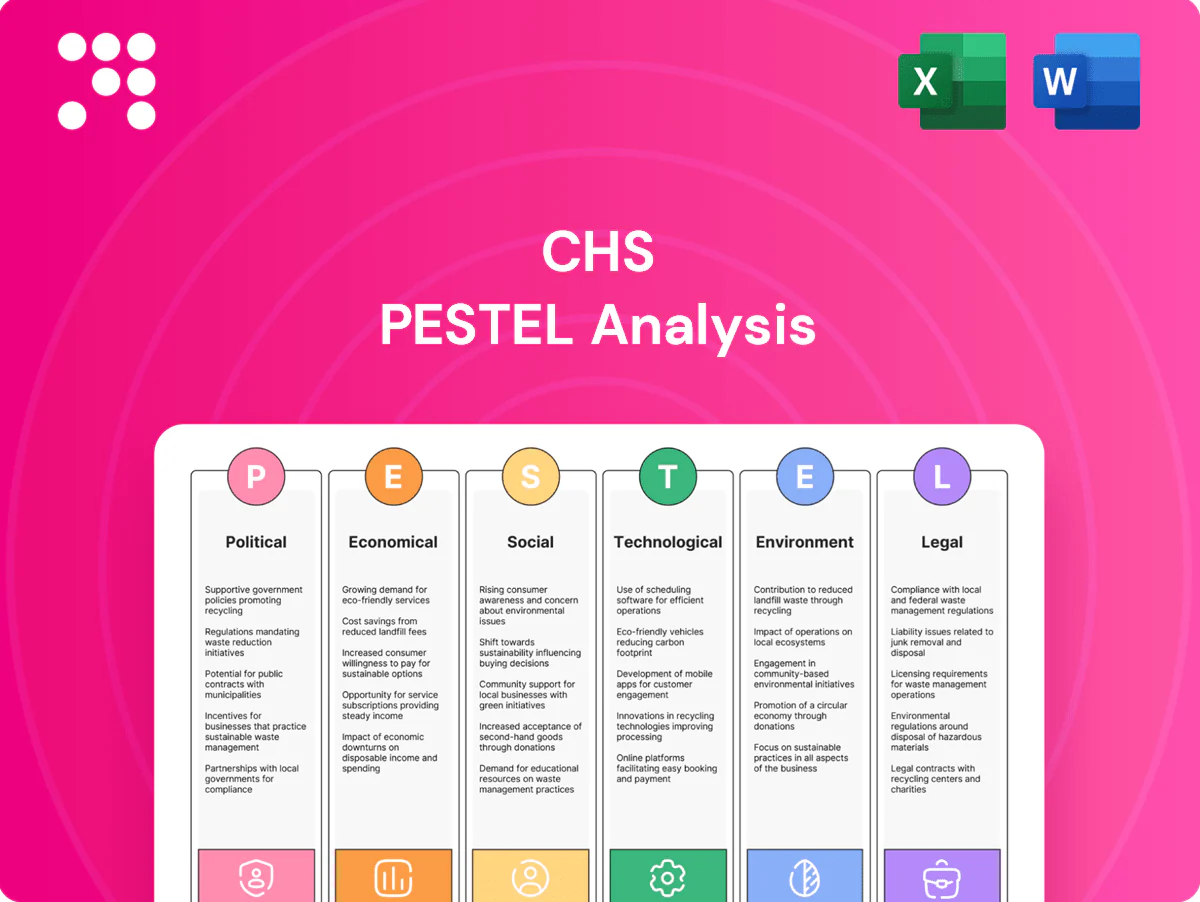
CHS PESTLE Analysis

Make Smarter Strategic Decisions with a Complete PESTEL View
Unlock how political shifts, economic trends, and tech disruptions are reshaping CHS with our concise PESTLE analysis—perfect for investors and strategists seeking actionable insights. This ready-to-use report highlights risks and opportunities to strengthen decisions; purchase the full PESTLE now for the complete, editable deep-dive.
Political factors

Federal healthcare policy shifts
Changes to Medicare/Medicaid reimbursement and expansion of value-based care directly impact CHS revenue and cash flow; CMS value-based purchasing withholds 2% of IPPS payments, HRRP penalties can reach up to 3%, and HAC penalties up to 1%, altering margins. Shifts in DRG definitions, readmission rules and quality metrics materially change case-mix payments. Election outcomes and federal budget priorities can accelerate or delay these rules. Active advocacy and scenario planning are essential.
State Medicaid expansion and waivers
State Medicaid expansion (now adopted by 40 states plus DC) and 1115 waivers materially shift payer mix—expansion added roughly 18 million enrollees since 2014 and cut uncompensated care, boosting volumes and reducing bad debt. CHS’s exposure in predominantly non‑urban markets (over 80% of its hospitals in non‑metropolitan counties) heightens sensitivity to state decisions. Policy reversals or waiver funding gaps can quickly reverse these gains, creating volume and revenue volatility.

Rural health funding and subsidies
Grants for rural hospitals and safety-net support—vital for roughly 1,300 Critical Access Hospitals—alongside the 1,000 Medicare GME slots Congress authorized in 2021 influence CHS sustainability. Federal/state initiatives and FCC/HHS telehealth grants (COVID Telehealth Program ~200M) can bolster telehealth and maternal-care deserts; uncertainty in annual appropriations risks operational planning.

Public health preparedness priorities
Government investments shape hospital readiness: US CDC PHEP funding ~675 million USD (FY2024) and similar grants lower capital burdens but raise operating compliance costs; stockpile replenishment and surge capacity investments drive recurring expenses. Pandemic after-action policies increasingly mandate upgraded HVAC, staffing ratios and reporting standards, raising retrofit and training costs. Coordination with local authorities determines access to shared surge assets and operational resilience.
- Funding: CDC PHEP ~675M (FY2024)
- Stockpiles: recurring replenishment costs
- Compliance: higher operational overhead
- Coordination: shared surge assets improve resilience
Political polarization and regulatory cadence
Withholds, DRG/readmit rules squeeze rural margins; Medicaid expansion shifts payer mix
Reimbursement shifts (VBP/IPPS 2% withhold; HRRP ≤3%; HAC ≤1%) and DRG/readmit rule changes materially affect CHS margins. State Medicaid expansion (40 states+DC; ~18M gained since 2014) alters payer mix, critical for CHS’s >80% non‑metro hospitals. Rural grants, 1,000 GME slots and CDC PHEP ~$675M (FY2024) drive capital/operating needs.
| Metric | Value |
|---|---|
| VBP/IPPS | 2% withhold |
| Medicaid expansion | 40 states+DC; ~18M |
| Non‑metro exposure | >80% hospitals |
| CDC PHEP FY24 | $675M |
What is included in the product
 Detailed Word Document
Explores how external macro-environmental factors uniquely affect the CHS across Political, Economic, Social, Technological, Environmental and Legal dimensions, with each section backed by current data and trends. Designed for executives, consultants and investors, it delivers forward-looking insights and clean formatting ready for plans, decks or reports.

 Customizable Excel Spreadsheet
A concise, visually segmented CHS PESTLE summary that’s editable for region- or business-line notes and easily dropped into presentations or shared for quick alignment across teams—ideal for meetings and strategy sessions.
Economic factors

Payer mix and reimbursement pressure
Payer mix and reimbursement pressure hinge on commercial rates versus Medicare benchmarks and Medicaid base rates, with commercial contracts typically paying materially above Medicare while Medicaid often pays below. Medicare Advantage enrollment reached about 52% of beneficiaries in 2024, shifting volumes toward government payers and compressing margins in many non-urban markets. Contracting leverage with managed care plans and site-of-care shifts to outpatient settings—where a growing share of revenue now originates—are pivotal to revenue capture.
Labor costs and staffing shortages
Nursing and clinician shortages push CHS labor costs higher: registered nurse median wage was $77,600 (BLS May 2023) while premium agency rates commonly run up to 2x permanent wages, inflating spend and squeezing margins. NSI reported RN turnover around 20.7% in 2023, making retention and training programs vital to curb churn. Productivity improvements and care-model redesign, plus labor contracts and local hospital competition, shape regional cost dynamics.

Interest rates and capital structure
Higher interest rates—US federal funds target 5.25–5.50% in mid‑2025—increase interest expense and constrain capex for upgrades and expansions, compressing free cash flow available for growth.
Refinancing windows and covenant headroom drive strategic flexibility, with near‑term maturities raising rollover risk for cooperatives.
Asset divestitures can deleverage the balance sheet but reduce scale; disciplined capital allocation becomes a key differentiator.

Local economic conditions and demand
- Employment & income: median HH income 74,580 (2023)
- Insurance: uninsured ~8.6% (2023)
- Downturns: higher bad debt/charity care
- Rural outmigration: smaller catchment; optimize service lines
Industry consolidation and competitive dynamics
Consolidation among health systems and payers intensifies competition for physicians and patient lives, while insurer vertical integration into care delivery shifts bargaining power toward payers and risk-bearing platforms. CHS can counter by using partnerships and joint ventures to expand outpatient reach and access referral networks. Strategic portfolio pruning can sharpen geographic focus and improve margin stability.
- Partner/JV expansion
- Defensive outpatient growth
- Geographic portfolio pruning
Withholds, DRG/readmit rules squeeze rural margins; Medicaid expansion shifts payer mix
Payer mix shifts (Medicare Advantage ~52% 2024) and reimbursement pressure compress margins; commercial pays above Medicare while Medicaid often pays below.
Labor costs rise—RN median wage $77,600 (BLS May 2023) and RN turnover ~20.7% (2023)—raising agency spend and operating expense.
Higher rates (federal funds 5.25–5.50% mid‑2025) increase interest expense, constrain capex and elevate refinancing risk.
| Metric | Value |
|---|---|
| MA penetration | ~52% (2024) |
| Median HH income | $74,580 (2023) |
| Uninsured | ~8.6% (2023) |
| Fed funds | 5.25–5.50% (mid‑2025) |
Full Version Awaits
CHS PESTLE Analysis
The CHS PESTLE Analysis preview shown here is the exact document you’ll receive after purchase—fully formatted and ready to use. It covers Political, Economic, Social, Technological, Legal, and Environmental factors with clear findings and actionable insights tailored to CHS. No placeholders or teasers—this is the real, finished file. Downloadable immediately after payment.

Make Smarter Strategic Decisions with a Complete PESTEL View
Unlock how political shifts, economic trends, and tech disruptions are reshaping CHS with our concise PESTLE analysis—perfect for investors and strategists seeking actionable insights. This ready-to-use report highlights risks and opportunities to strengthen decisions; purchase the full PESTLE now for the complete, editable deep-dive.
Political factors
Federal healthcare policy shifts
Changes to Medicare/Medicaid reimbursement and expansion of value-based care directly impact CHS revenue and cash flow; CMS value-based purchasing withholds 2% of IPPS payments, HRRP penalties can reach up to 3%, and HAC penalties up to 1%, altering margins. Shifts in DRG definitions, readmission rules and quality metrics materially change case-mix payments. Election outcomes and federal budget priorities can accelerate or delay these rules. Active advocacy and scenario planning are essential.
State Medicaid expansion and waivers
State Medicaid expansion (now adopted by 40 states plus DC) and 1115 waivers materially shift payer mix—expansion added roughly 18 million enrollees since 2014 and cut uncompensated care, boosting volumes and reducing bad debt. CHS’s exposure in predominantly non‑urban markets (over 80% of its hospitals in non‑metropolitan counties) heightens sensitivity to state decisions. Policy reversals or waiver funding gaps can quickly reverse these gains, creating volume and revenue volatility.
Rural health funding and subsidies
Grants for rural hospitals and safety-net support—vital for roughly 1,300 Critical Access Hospitals—alongside the 1,000 Medicare GME slots Congress authorized in 2021 influence CHS sustainability. Federal/state initiatives and FCC/HHS telehealth grants (COVID Telehealth Program ~200M) can bolster telehealth and maternal-care deserts; uncertainty in annual appropriations risks operational planning.
Public health preparedness priorities
Government investments shape hospital readiness: US CDC PHEP funding ~675 million USD (FY2024) and similar grants lower capital burdens but raise operating compliance costs; stockpile replenishment and surge capacity investments drive recurring expenses. Pandemic after-action policies increasingly mandate upgraded HVAC, staffing ratios and reporting standards, raising retrofit and training costs. Coordination with local authorities determines access to shared surge assets and operational resilience.
- Funding: CDC PHEP ~675M (FY2024)
- Stockpiles: recurring replenishment costs
- Compliance: higher operational overhead
- Coordination: shared surge assets improve resilience
Political polarization and regulatory cadence
Withholds, DRG/readmit rules squeeze rural margins; Medicaid expansion shifts payer mix
Reimbursement shifts (VBP/IPPS 2% withhold; HRRP ≤3%; HAC ≤1%) and DRG/readmit rule changes materially affect CHS margins. State Medicaid expansion (40 states+DC; ~18M gained since 2014) alters payer mix, critical for CHS’s >80% non‑metro hospitals. Rural grants, 1,000 GME slots and CDC PHEP ~$675M (FY2024) drive capital/operating needs.
| Metric | Value |
|---|---|
| VBP/IPPS | 2% withhold |
| Medicaid expansion | 40 states+DC; ~18M |
| Non‑metro exposure | >80% hospitals |
| CDC PHEP FY24 | $675M |
What is included in the product
Detailed Word Document
Explores how external macro-environmental factors uniquely affect the CHS across Political, Economic, Social, Technological, Environmental and Legal dimensions, with each section backed by current data and trends. Designed for executives, consultants and investors, it delivers forward-looking insights and clean formatting ready for plans, decks or reports.
Customizable Excel Spreadsheet
A concise, visually segmented CHS PESTLE summary that’s editable for region- or business-line notes and easily dropped into presentations or shared for quick alignment across teams—ideal for meetings and strategy sessions.
Economic factors
Payer mix and reimbursement pressure
Payer mix and reimbursement pressure hinge on commercial rates versus Medicare benchmarks and Medicaid base rates, with commercial contracts typically paying materially above Medicare while Medicaid often pays below. Medicare Advantage enrollment reached about 52% of beneficiaries in 2024, shifting volumes toward government payers and compressing margins in many non-urban markets. Contracting leverage with managed care plans and site-of-care shifts to outpatient settings—where a growing share of revenue now originates—are pivotal to revenue capture.
Labor costs and staffing shortages
Nursing and clinician shortages push CHS labor costs higher: registered nurse median wage was $77,600 (BLS May 2023) while premium agency rates commonly run up to 2x permanent wages, inflating spend and squeezing margins. NSI reported RN turnover around 20.7% in 2023, making retention and training programs vital to curb churn. Productivity improvements and care-model redesign, plus labor contracts and local hospital competition, shape regional cost dynamics.
Interest rates and capital structure
Higher interest rates—US federal funds target 5.25–5.50% in mid‑2025—increase interest expense and constrain capex for upgrades and expansions, compressing free cash flow available for growth.
Refinancing windows and covenant headroom drive strategic flexibility, with near‑term maturities raising rollover risk for cooperatives.
Asset divestitures can deleverage the balance sheet but reduce scale; disciplined capital allocation becomes a key differentiator.
Local economic conditions and demand
- Employment & income: median HH income 74,580 (2023)
- Insurance: uninsured ~8.6% (2023)
- Downturns: higher bad debt/charity care
- Rural outmigration: smaller catchment; optimize service lines
Industry consolidation and competitive dynamics
Consolidation among health systems and payers intensifies competition for physicians and patient lives, while insurer vertical integration into care delivery shifts bargaining power toward payers and risk-bearing platforms. CHS can counter by using partnerships and joint ventures to expand outpatient reach and access referral networks. Strategic portfolio pruning can sharpen geographic focus and improve margin stability.
- Partner/JV expansion
- Defensive outpatient growth
- Geographic portfolio pruning
Withholds, DRG/readmit rules squeeze rural margins; Medicaid expansion shifts payer mix
Payer mix shifts (Medicare Advantage ~52% 2024) and reimbursement pressure compress margins; commercial pays above Medicare while Medicaid often pays below.
Labor costs rise—RN median wage $77,600 (BLS May 2023) and RN turnover ~20.7% (2023)—raising agency spend and operating expense.
Higher rates (federal funds 5.25–5.50% mid‑2025) increase interest expense, constrain capex and elevate refinancing risk.
| Metric | Value |
|---|---|
| MA penetration | ~52% (2024) |
| Median HH income | $74,580 (2023) |
| Uninsured | ~8.6% (2023) |
| Fed funds | 5.25–5.50% (mid‑2025) |
Full Version Awaits
CHS PESTLE Analysis
The CHS PESTLE Analysis preview shown here is the exact document you’ll receive after purchase—fully formatted and ready to use. It covers Political, Economic, Social, Technological, Legal, and Environmental factors with clear findings and actionable insights tailored to CHS. No placeholders or teasers—this is the real, finished file. Downloadable immediately after payment.
Original: $10.00
-65%$10.00
$3.50Description
Make Smarter Strategic Decisions with a Complete PESTEL View
Unlock how political shifts, economic trends, and tech disruptions are reshaping CHS with our concise PESTLE analysis—perfect for investors and strategists seeking actionable insights. This ready-to-use report highlights risks and opportunities to strengthen decisions; purchase the full PESTLE now for the complete, editable deep-dive.
Political factors
Federal healthcare policy shifts
Changes to Medicare/Medicaid reimbursement and expansion of value-based care directly impact CHS revenue and cash flow; CMS value-based purchasing withholds 2% of IPPS payments, HRRP penalties can reach up to 3%, and HAC penalties up to 1%, altering margins. Shifts in DRG definitions, readmission rules and quality metrics materially change case-mix payments. Election outcomes and federal budget priorities can accelerate or delay these rules. Active advocacy and scenario planning are essential.
State Medicaid expansion and waivers
State Medicaid expansion (now adopted by 40 states plus DC) and 1115 waivers materially shift payer mix—expansion added roughly 18 million enrollees since 2014 and cut uncompensated care, boosting volumes and reducing bad debt. CHS’s exposure in predominantly non‑urban markets (over 80% of its hospitals in non‑metropolitan counties) heightens sensitivity to state decisions. Policy reversals or waiver funding gaps can quickly reverse these gains, creating volume and revenue volatility.
Rural health funding and subsidies
Grants for rural hospitals and safety-net support—vital for roughly 1,300 Critical Access Hospitals—alongside the 1,000 Medicare GME slots Congress authorized in 2021 influence CHS sustainability. Federal/state initiatives and FCC/HHS telehealth grants (COVID Telehealth Program ~200M) can bolster telehealth and maternal-care deserts; uncertainty in annual appropriations risks operational planning.
Public health preparedness priorities
Government investments shape hospital readiness: US CDC PHEP funding ~675 million USD (FY2024) and similar grants lower capital burdens but raise operating compliance costs; stockpile replenishment and surge capacity investments drive recurring expenses. Pandemic after-action policies increasingly mandate upgraded HVAC, staffing ratios and reporting standards, raising retrofit and training costs. Coordination with local authorities determines access to shared surge assets and operational resilience.
- Funding: CDC PHEP ~675M (FY2024)
- Stockpiles: recurring replenishment costs
- Compliance: higher operational overhead
- Coordination: shared surge assets improve resilience
Political polarization and regulatory cadence
Withholds, DRG/readmit rules squeeze rural margins; Medicaid expansion shifts payer mix
Reimbursement shifts (VBP/IPPS 2% withhold; HRRP ≤3%; HAC ≤1%) and DRG/readmit rule changes materially affect CHS margins. State Medicaid expansion (40 states+DC; ~18M gained since 2014) alters payer mix, critical for CHS’s >80% non‑metro hospitals. Rural grants, 1,000 GME slots and CDC PHEP ~$675M (FY2024) drive capital/operating needs.
| Metric | Value |
|---|---|
| VBP/IPPS | 2% withhold |
| Medicaid expansion | 40 states+DC; ~18M |
| Non‑metro exposure | >80% hospitals |
| CDC PHEP FY24 | $675M |
What is included in the product
Detailed Word Document
Explores how external macro-environmental factors uniquely affect the CHS across Political, Economic, Social, Technological, Environmental and Legal dimensions, with each section backed by current data and trends. Designed for executives, consultants and investors, it delivers forward-looking insights and clean formatting ready for plans, decks or reports.
Customizable Excel Spreadsheet
A concise, visually segmented CHS PESTLE summary that’s editable for region- or business-line notes and easily dropped into presentations or shared for quick alignment across teams—ideal for meetings and strategy sessions.
Economic factors
Payer mix and reimbursement pressure
Payer mix and reimbursement pressure hinge on commercial rates versus Medicare benchmarks and Medicaid base rates, with commercial contracts typically paying materially above Medicare while Medicaid often pays below. Medicare Advantage enrollment reached about 52% of beneficiaries in 2024, shifting volumes toward government payers and compressing margins in many non-urban markets. Contracting leverage with managed care plans and site-of-care shifts to outpatient settings—where a growing share of revenue now originates—are pivotal to revenue capture.
Labor costs and staffing shortages
Nursing and clinician shortages push CHS labor costs higher: registered nurse median wage was $77,600 (BLS May 2023) while premium agency rates commonly run up to 2x permanent wages, inflating spend and squeezing margins. NSI reported RN turnover around 20.7% in 2023, making retention and training programs vital to curb churn. Productivity improvements and care-model redesign, plus labor contracts and local hospital competition, shape regional cost dynamics.
Interest rates and capital structure
Higher interest rates—US federal funds target 5.25–5.50% in mid‑2025—increase interest expense and constrain capex for upgrades and expansions, compressing free cash flow available for growth.
Refinancing windows and covenant headroom drive strategic flexibility, with near‑term maturities raising rollover risk for cooperatives.
Asset divestitures can deleverage the balance sheet but reduce scale; disciplined capital allocation becomes a key differentiator.
Local economic conditions and demand
- Employment & income: median HH income 74,580 (2023)
- Insurance: uninsured ~8.6% (2023)
- Downturns: higher bad debt/charity care
- Rural outmigration: smaller catchment; optimize service lines
Industry consolidation and competitive dynamics
Consolidation among health systems and payers intensifies competition for physicians and patient lives, while insurer vertical integration into care delivery shifts bargaining power toward payers and risk-bearing platforms. CHS can counter by using partnerships and joint ventures to expand outpatient reach and access referral networks. Strategic portfolio pruning can sharpen geographic focus and improve margin stability.
- Partner/JV expansion
- Defensive outpatient growth
- Geographic portfolio pruning
Withholds, DRG/readmit rules squeeze rural margins; Medicaid expansion shifts payer mix
Payer mix shifts (Medicare Advantage ~52% 2024) and reimbursement pressure compress margins; commercial pays above Medicare while Medicaid often pays below.
Labor costs rise—RN median wage $77,600 (BLS May 2023) and RN turnover ~20.7% (2023)—raising agency spend and operating expense.
Higher rates (federal funds 5.25–5.50% mid‑2025) increase interest expense, constrain capex and elevate refinancing risk.
| Metric | Value |
|---|---|
| MA penetration | ~52% (2024) |
| Median HH income | $74,580 (2023) |
| Uninsured | ~8.6% (2023) |
| Fed funds | 5.25–5.50% (mid‑2025) |
Full Version Awaits
CHS PESTLE Analysis
The CHS PESTLE Analysis preview shown here is the exact document you’ll receive after purchase—fully formatted and ready to use. It covers Political, Economic, Social, Technological, Legal, and Environmental factors with clear findings and actionable insights tailored to CHS. No placeholders or teasers—this is the real, finished file. Downloadable immediately after payment.











