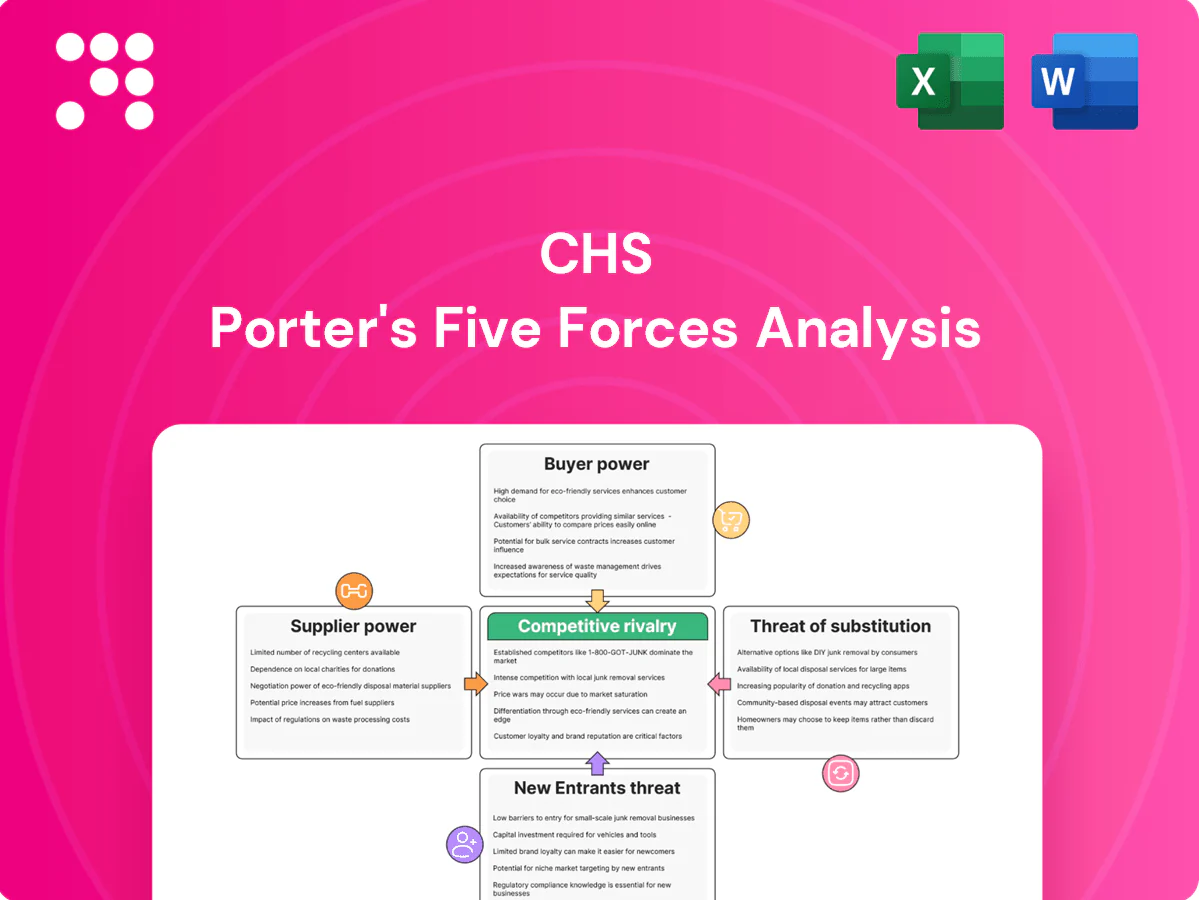
CHS Porter's Five Forces Analysis

Go Beyond the Preview—Access the Full Strategic Report
CHS faces moderate supplier power, pockets of strong buyer influence, and intense rivalry driven by scale and commodity pricing, while barriers to entry limit new competitors but substitutes pose targeted threats; this snapshot highlights core pressures shaping CHS’s strategic choices. Unlock the full Porter's Five Forces Analysis to explore force-by-force ratings, visuals, and actionable recommendations tailored to CHS’s market position.
Suppliers Bargaining Power

Concentrated fertilizer producers
Global nitrogen, phosphate and potash supply remains highly concentrated among majors such as Nutrien, Mosaic, Yara, PhosAgro and OCI, strengthening pricing and allocation control; long‑term offtake contracts reduce but do not eliminate exposure. Geopolitical actions and 2022–24 energy price shocks amplified supplier leverage on nutrient costs. CHS’s hedging programs and scale partially buffer volatility.
Energy and refining dependencies
Diesel, propane and other refined fuels depend on refiners and pipelines with limited substitution; U.S. refinery capacity was about 18.9 million barrels per day in 2024 (EIA), constraining spare supply. OPEC+ production adjustments (~2.5 million bpd cuts in 2023–24) and refinery outages raise premiums and volatility. Take-or-pay logistics and seasonal demand spikes amplify supplier leverage; CHS’s vertical integration lowers but does not eliminate exposure.

Rail, barge, and port infrastructure
Freight carriers and terminals are concentrated—four major U.S. railroads control roughly 70% of rail freight—creating capacity constraints in peak harvests. Disruptions such as low Mississippi River levels and labor issues shift bargaining power to logistics providers; U.S. inland waterways move about 630 million tons annually (Army Corps data). Access fees and surcharges can compress margins rapidly. CHS’s owned and leased elevators and terminals strengthen negotiation yet remain dependent on the broader network.

Ag chem and seed majors
Commodity origination from producers
Member-owners supply CHS with grain but routinely divert to local elevators and merchandisers, limiting CHS leverage; USDA reported 2024 U.S. corn production at about 14.1 billion bushels, tightening basis windows that shift pricing power to producers during shortfalls. Loyalty programs and patronage dividends (CHS returned hundreds of millions across recent years) help stabilize flows, yet weather-driven variability in 2024 kept supplier bargaining power elevated.
Energy shocks and concentrated suppliers squeeze ag inputs; fuel, rail, and seed oligopolies tighten
Supplier power is high: nutrient majors dominate and 2022–24 energy shocks pushed costs; CHS hedging/scale only partly offsets. Fuel limits (U.S. refineries 18.9M bpd) and OPEC+ cuts (~2.5M bpd) raise risk; rail ~70% concentrated and river bottlenecks tighten logistics. Crop protection/seeds ~60–70%/50–60% market share, constraining pricing.
| Metric | 2024 |
|---|---|
| U.S. refinery capacity | 18.9M bpd |
| OPEC+ cuts | ~2.5M bpd |
| Rail concentration | ~70% |
| Crop protection share | 60–70% |
What is included in the product
 Detailed Word Document
Uncovers key drivers of competition, supplier and buyer power, substitutes, and entry barriers specific to CHS, identifying disruptive threats and strategic levers to protect market share and profitability.

 Customizable Excel Spreadsheet
Concise CHS Porter's Five Forces one-sheet that quantifies competitive pressure with customizable scores and an instant radar chart—ready to drop into pitch decks or Excel dashboards without macros.
Customers Bargaining Power

Price-transparent commodities
Global benchmarks and liquid markets make grain, fuels, and nutrients highly price elastic; USDA estimated world grain trade at about 470 million tonnes in 2024, enabling instant price discovery. Buyers compare basis, fees, and timing across rivals in seconds via electronic platforms, shifting margins toward service and logistics rather than price premiums. This transparency amplifies buyer leverage in negotiations.
Large industrial and export buyers
Processors, feed mills and export customers buy in bulk and enforce tight specs; the top four US beef packers controlled roughly 85% of steer and heifer processing in 2024 (USDA), giving buyers leverage to demand aggressive terms and performance penalties. Volume concentration lets large buyers extract lower prices and penalties; trade finance reliability often matters as much as price. CHS’s scale mitigates some pressure, but buyer consolidation sustains bargaining power.

Farmer-members with options
Farmer-members face moderate-to-high bargaining power as they can switch among rival co-ops, independent agribusinesses, or direct-to-terminal delivery channels. As of 2024 many producers leverage on-farm storage to time sales and strengthen basis negotiation, shortening windows for coop pricing control. Patronage payments and bundled agronomy and supply services raise switching costs modestly, but alternatives preserve substantial buyer leverage.

Risk management and finance clients
Hedging and credit customers can rapidly shop banks, FCMs, and fintech platforms, shrinking margins as standardized swaps and futures reduce differentiation; 2024 industry surveys indicate over 50% of treasuries compare three or more providers before selecting a counterparty. Relationship depth and advisory quality remain key retention levers, yet persistent price sensitivity boosts buyer power and compresses fees.
- Buyers compare 3+ providers
- Standardized products lower switching costs
- Advisory depth drives retention
Food ingredient purchasers
CPG and foodservice buyers demand consistent traceability and regulatory compliance, and their scale and contract sophistication compress supplier margins and raise service expectations; Walmart held about 25% of US grocery share in 2024 and US foodservice sales neared $1.2 trillion in 2024, concentrating buying power. Certifications and sustainability data are table stakes, shifting leverage to buyers unless suppliers offer proven specialty value.
- High buyer scale: Walmart ~25% US grocery (2024)
- Foodservice scale: US sales ≈ $1.2T (2024)
- Must-have: traceability, certifications, sustainability data
- Supplier leverage only with verifiable specialty premium
Price pressure from global grain trade ~470 Mt, concentrated buyers; hedgers shop 3+
Global price transparency (world grain trade ~470Mt in 2024) and liquid markets make buyers highly price‑sensitive. Large consolidators (Walmart ~25% grocery; top 4 beef packers ~85% steer/heifer processing in 2024) extract concessions, while farmer-members retain switching options via on‑farm storage and co‑op alternatives. Hedging/treasury clients shop 3+ providers, compressing fees.
| Metric | 2024 |
|---|---|
| World grain trade | ~470 Mt |
| Walmart US grocery share | ~25% |
| Top4 beef packers US | ~85% |
| Buyers comparing providers | 3+ |
Preview Before You Purchase
CHS Porter's Five Forces Analysis
This preview shows the exact CHS Porter's Five Forces Analysis you'll receive immediately after purchase—no placeholders or mockups. The file is fully formatted, professionally written and ready to download and use upon payment. Instant access is provided to this identical document.

Go Beyond the Preview—Access the Full Strategic Report
CHS faces moderate supplier power, pockets of strong buyer influence, and intense rivalry driven by scale and commodity pricing, while barriers to entry limit new competitors but substitutes pose targeted threats; this snapshot highlights core pressures shaping CHS’s strategic choices. Unlock the full Porter's Five Forces Analysis to explore force-by-force ratings, visuals, and actionable recommendations tailored to CHS’s market position.
Suppliers Bargaining Power
Concentrated fertilizer producers
Global nitrogen, phosphate and potash supply remains highly concentrated among majors such as Nutrien, Mosaic, Yara, PhosAgro and OCI, strengthening pricing and allocation control; long‑term offtake contracts reduce but do not eliminate exposure. Geopolitical actions and 2022–24 energy price shocks amplified supplier leverage on nutrient costs. CHS’s hedging programs and scale partially buffer volatility.
Energy and refining dependencies
Diesel, propane and other refined fuels depend on refiners and pipelines with limited substitution; U.S. refinery capacity was about 18.9 million barrels per day in 2024 (EIA), constraining spare supply. OPEC+ production adjustments (~2.5 million bpd cuts in 2023–24) and refinery outages raise premiums and volatility. Take-or-pay logistics and seasonal demand spikes amplify supplier leverage; CHS’s vertical integration lowers but does not eliminate exposure.
Rail, barge, and port infrastructure
Freight carriers and terminals are concentrated—four major U.S. railroads control roughly 70% of rail freight—creating capacity constraints in peak harvests. Disruptions such as low Mississippi River levels and labor issues shift bargaining power to logistics providers; U.S. inland waterways move about 630 million tons annually (Army Corps data). Access fees and surcharges can compress margins rapidly. CHS’s owned and leased elevators and terminals strengthen negotiation yet remain dependent on the broader network.
Ag chem and seed majors
Commodity origination from producers
Member-owners supply CHS with grain but routinely divert to local elevators and merchandisers, limiting CHS leverage; USDA reported 2024 U.S. corn production at about 14.1 billion bushels, tightening basis windows that shift pricing power to producers during shortfalls. Loyalty programs and patronage dividends (CHS returned hundreds of millions across recent years) help stabilize flows, yet weather-driven variability in 2024 kept supplier bargaining power elevated.
Energy shocks and concentrated suppliers squeeze ag inputs; fuel, rail, and seed oligopolies tighten
Supplier power is high: nutrient majors dominate and 2022–24 energy shocks pushed costs; CHS hedging/scale only partly offsets. Fuel limits (U.S. refineries 18.9M bpd) and OPEC+ cuts (~2.5M bpd) raise risk; rail ~70% concentrated and river bottlenecks tighten logistics. Crop protection/seeds ~60–70%/50–60% market share, constraining pricing.
| Metric | 2024 |
|---|---|
| U.S. refinery capacity | 18.9M bpd |
| OPEC+ cuts | ~2.5M bpd |
| Rail concentration | ~70% |
| Crop protection share | 60–70% |
What is included in the product
Detailed Word Document
Uncovers key drivers of competition, supplier and buyer power, substitutes, and entry barriers specific to CHS, identifying disruptive threats and strategic levers to protect market share and profitability.
Customizable Excel Spreadsheet
Concise CHS Porter's Five Forces one-sheet that quantifies competitive pressure with customizable scores and an instant radar chart—ready to drop into pitch decks or Excel dashboards without macros.
Customers Bargaining Power
Price-transparent commodities
Global benchmarks and liquid markets make grain, fuels, and nutrients highly price elastic; USDA estimated world grain trade at about 470 million tonnes in 2024, enabling instant price discovery. Buyers compare basis, fees, and timing across rivals in seconds via electronic platforms, shifting margins toward service and logistics rather than price premiums. This transparency amplifies buyer leverage in negotiations.
Large industrial and export buyers
Processors, feed mills and export customers buy in bulk and enforce tight specs; the top four US beef packers controlled roughly 85% of steer and heifer processing in 2024 (USDA), giving buyers leverage to demand aggressive terms and performance penalties. Volume concentration lets large buyers extract lower prices and penalties; trade finance reliability often matters as much as price. CHS’s scale mitigates some pressure, but buyer consolidation sustains bargaining power.
Farmer-members with options
Farmer-members face moderate-to-high bargaining power as they can switch among rival co-ops, independent agribusinesses, or direct-to-terminal delivery channels. As of 2024 many producers leverage on-farm storage to time sales and strengthen basis negotiation, shortening windows for coop pricing control. Patronage payments and bundled agronomy and supply services raise switching costs modestly, but alternatives preserve substantial buyer leverage.
Risk management and finance clients
Hedging and credit customers can rapidly shop banks, FCMs, and fintech platforms, shrinking margins as standardized swaps and futures reduce differentiation; 2024 industry surveys indicate over 50% of treasuries compare three or more providers before selecting a counterparty. Relationship depth and advisory quality remain key retention levers, yet persistent price sensitivity boosts buyer power and compresses fees.
- Buyers compare 3+ providers
- Standardized products lower switching costs
- Advisory depth drives retention
Food ingredient purchasers
CPG and foodservice buyers demand consistent traceability and regulatory compliance, and their scale and contract sophistication compress supplier margins and raise service expectations; Walmart held about 25% of US grocery share in 2024 and US foodservice sales neared $1.2 trillion in 2024, concentrating buying power. Certifications and sustainability data are table stakes, shifting leverage to buyers unless suppliers offer proven specialty value.
- High buyer scale: Walmart ~25% US grocery (2024)
- Foodservice scale: US sales ≈ $1.2T (2024)
- Must-have: traceability, certifications, sustainability data
- Supplier leverage only with verifiable specialty premium
Price pressure from global grain trade ~470 Mt, concentrated buyers; hedgers shop 3+
Global price transparency (world grain trade ~470Mt in 2024) and liquid markets make buyers highly price‑sensitive. Large consolidators (Walmart ~25% grocery; top 4 beef packers ~85% steer/heifer processing in 2024) extract concessions, while farmer-members retain switching options via on‑farm storage and co‑op alternatives. Hedging/treasury clients shop 3+ providers, compressing fees.
| Metric | 2024 |
|---|---|
| World grain trade | ~470 Mt |
| Walmart US grocery share | ~25% |
| Top4 beef packers US | ~85% |
| Buyers comparing providers | 3+ |
Preview Before You Purchase
CHS Porter's Five Forces Analysis
This preview shows the exact CHS Porter's Five Forces Analysis you'll receive immediately after purchase—no placeholders or mockups. The file is fully formatted, professionally written and ready to download and use upon payment. Instant access is provided to this identical document.
Original: $10.00
-65%$10.00
$3.50Description
Go Beyond the Preview—Access the Full Strategic Report
CHS faces moderate supplier power, pockets of strong buyer influence, and intense rivalry driven by scale and commodity pricing, while barriers to entry limit new competitors but substitutes pose targeted threats; this snapshot highlights core pressures shaping CHS’s strategic choices. Unlock the full Porter's Five Forces Analysis to explore force-by-force ratings, visuals, and actionable recommendations tailored to CHS’s market position.
Suppliers Bargaining Power
Concentrated fertilizer producers
Global nitrogen, phosphate and potash supply remains highly concentrated among majors such as Nutrien, Mosaic, Yara, PhosAgro and OCI, strengthening pricing and allocation control; long‑term offtake contracts reduce but do not eliminate exposure. Geopolitical actions and 2022–24 energy price shocks amplified supplier leverage on nutrient costs. CHS’s hedging programs and scale partially buffer volatility.
Energy and refining dependencies
Diesel, propane and other refined fuels depend on refiners and pipelines with limited substitution; U.S. refinery capacity was about 18.9 million barrels per day in 2024 (EIA), constraining spare supply. OPEC+ production adjustments (~2.5 million bpd cuts in 2023–24) and refinery outages raise premiums and volatility. Take-or-pay logistics and seasonal demand spikes amplify supplier leverage; CHS’s vertical integration lowers but does not eliminate exposure.
Rail, barge, and port infrastructure
Freight carriers and terminals are concentrated—four major U.S. railroads control roughly 70% of rail freight—creating capacity constraints in peak harvests. Disruptions such as low Mississippi River levels and labor issues shift bargaining power to logistics providers; U.S. inland waterways move about 630 million tons annually (Army Corps data). Access fees and surcharges can compress margins rapidly. CHS’s owned and leased elevators and terminals strengthen negotiation yet remain dependent on the broader network.
Ag chem and seed majors
Commodity origination from producers
Member-owners supply CHS with grain but routinely divert to local elevators and merchandisers, limiting CHS leverage; USDA reported 2024 U.S. corn production at about 14.1 billion bushels, tightening basis windows that shift pricing power to producers during shortfalls. Loyalty programs and patronage dividends (CHS returned hundreds of millions across recent years) help stabilize flows, yet weather-driven variability in 2024 kept supplier bargaining power elevated.
Energy shocks and concentrated suppliers squeeze ag inputs; fuel, rail, and seed oligopolies tighten
Supplier power is high: nutrient majors dominate and 2022–24 energy shocks pushed costs; CHS hedging/scale only partly offsets. Fuel limits (U.S. refineries 18.9M bpd) and OPEC+ cuts (~2.5M bpd) raise risk; rail ~70% concentrated and river bottlenecks tighten logistics. Crop protection/seeds ~60–70%/50–60% market share, constraining pricing.
| Metric | 2024 |
|---|---|
| U.S. refinery capacity | 18.9M bpd |
| OPEC+ cuts | ~2.5M bpd |
| Rail concentration | ~70% |
| Crop protection share | 60–70% |
What is included in the product
Detailed Word Document
Uncovers key drivers of competition, supplier and buyer power, substitutes, and entry barriers specific to CHS, identifying disruptive threats and strategic levers to protect market share and profitability.
Customizable Excel Spreadsheet
Concise CHS Porter's Five Forces one-sheet that quantifies competitive pressure with customizable scores and an instant radar chart—ready to drop into pitch decks or Excel dashboards without macros.
Customers Bargaining Power
Price-transparent commodities
Global benchmarks and liquid markets make grain, fuels, and nutrients highly price elastic; USDA estimated world grain trade at about 470 million tonnes in 2024, enabling instant price discovery. Buyers compare basis, fees, and timing across rivals in seconds via electronic platforms, shifting margins toward service and logistics rather than price premiums. This transparency amplifies buyer leverage in negotiations.
Large industrial and export buyers
Processors, feed mills and export customers buy in bulk and enforce tight specs; the top four US beef packers controlled roughly 85% of steer and heifer processing in 2024 (USDA), giving buyers leverage to demand aggressive terms and performance penalties. Volume concentration lets large buyers extract lower prices and penalties; trade finance reliability often matters as much as price. CHS’s scale mitigates some pressure, but buyer consolidation sustains bargaining power.
Farmer-members with options
Farmer-members face moderate-to-high bargaining power as they can switch among rival co-ops, independent agribusinesses, or direct-to-terminal delivery channels. As of 2024 many producers leverage on-farm storage to time sales and strengthen basis negotiation, shortening windows for coop pricing control. Patronage payments and bundled agronomy and supply services raise switching costs modestly, but alternatives preserve substantial buyer leverage.
Risk management and finance clients
Hedging and credit customers can rapidly shop banks, FCMs, and fintech platforms, shrinking margins as standardized swaps and futures reduce differentiation; 2024 industry surveys indicate over 50% of treasuries compare three or more providers before selecting a counterparty. Relationship depth and advisory quality remain key retention levers, yet persistent price sensitivity boosts buyer power and compresses fees.
- Buyers compare 3+ providers
- Standardized products lower switching costs
- Advisory depth drives retention
Food ingredient purchasers
CPG and foodservice buyers demand consistent traceability and regulatory compliance, and their scale and contract sophistication compress supplier margins and raise service expectations; Walmart held about 25% of US grocery share in 2024 and US foodservice sales neared $1.2 trillion in 2024, concentrating buying power. Certifications and sustainability data are table stakes, shifting leverage to buyers unless suppliers offer proven specialty value.
- High buyer scale: Walmart ~25% US grocery (2024)
- Foodservice scale: US sales ≈ $1.2T (2024)
- Must-have: traceability, certifications, sustainability data
- Supplier leverage only with verifiable specialty premium
Price pressure from global grain trade ~470 Mt, concentrated buyers; hedgers shop 3+
Global price transparency (world grain trade ~470Mt in 2024) and liquid markets make buyers highly price‑sensitive. Large consolidators (Walmart ~25% grocery; top 4 beef packers ~85% steer/heifer processing in 2024) extract concessions, while farmer-members retain switching options via on‑farm storage and co‑op alternatives. Hedging/treasury clients shop 3+ providers, compressing fees.
| Metric | 2024 |
|---|---|
| World grain trade | ~470 Mt |
| Walmart US grocery share | ~25% |
| Top4 beef packers US | ~85% |
| Buyers comparing providers | 3+ |
Preview Before You Purchase
CHS Porter's Five Forces Analysis
This preview shows the exact CHS Porter's Five Forces Analysis you'll receive immediately after purchase—no placeholders or mockups. The file is fully formatted, professionally written and ready to download and use upon payment. Instant access is provided to this identical document.











