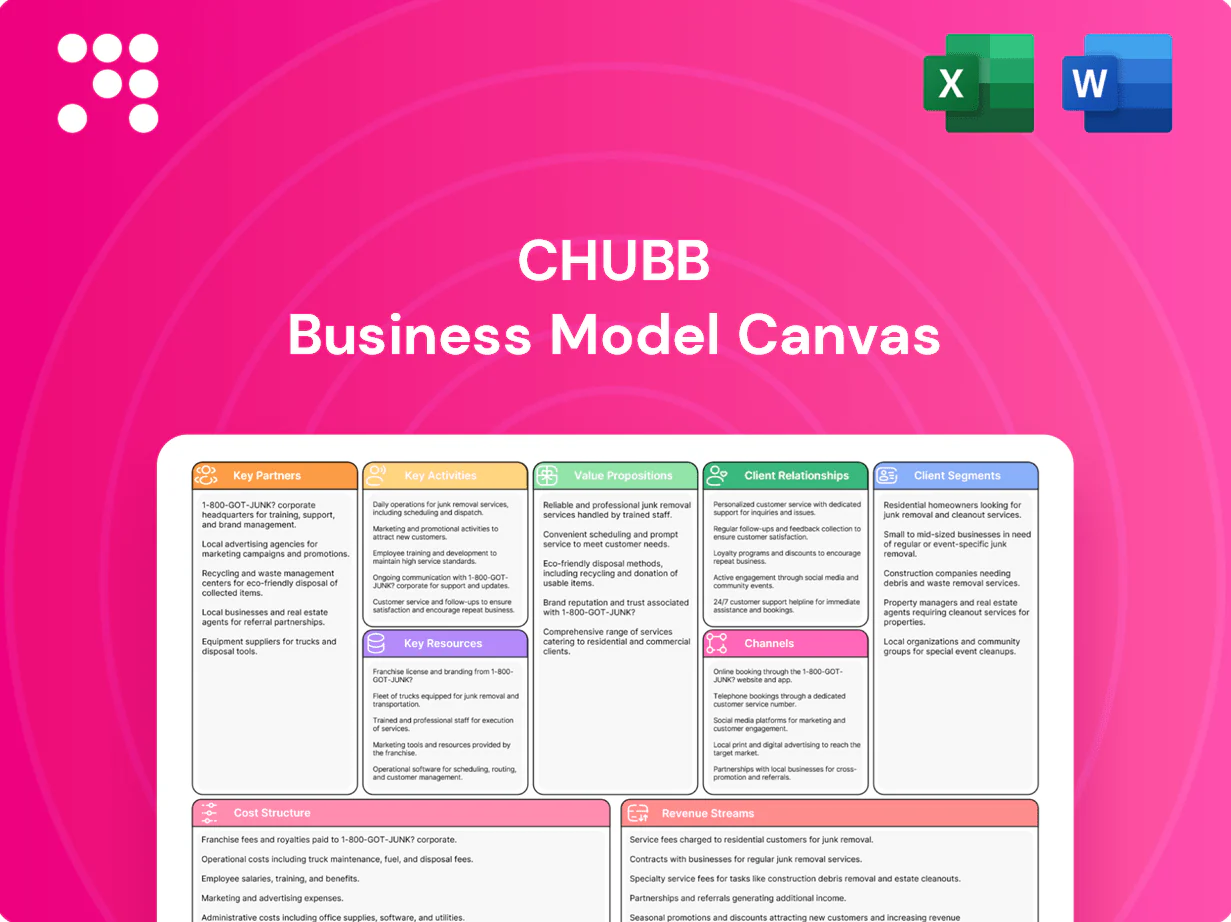
Chubb Business Model Canvas

Insurer Business Model Canvas: Strategic blueprint for value, risk and market growth
Unlock the strategic blueprint behind Chubb with our concise Business Model Canvas, showing how the insurer creates value, manages risk, and captures premium market share. This in-depth, editable canvas is ideal for investors, consultants, and executives. Download the full Word and Excel files to benchmark and apply Chubb’s proven strategies.
Partnerships

Independent agents
Chubb relies on thousands of independent agents to originate and service a large share of its policies, expanding market reach into local and niche customer bases across 54 countries and territories. Agents deliver advisory selling that boosts conversion and retention, while Chubb supports them with training, digital portals, and competitive commission structures tied to performance.
Global brokers
Partnerships with major global brokers give Chubb access to multinational and complex risks, with the top three brokers accounting for roughly 60% of corporate broking revenues in 2024.
Brokers aggregate corporate demand and tailor placements across jurisdictions, creating scale and loss-profiling data that feed product design and pricing feedback loops.
Chubb leverages capacity, specialist underwriting expertise and service SLAs to win placements and respond to broker-driven market signals.

Reinsurers
Reinsurers help Chubb manage peak exposures and earnings volatility by enabling treaties and facultative placements that cede significant catastrophe risk; Chubb’s market capitalization near 80 billion USD in 2024 underpins its access to capacity. Ceding optimizes capital usage and helps stabilize combined ratios, while long-term reinsurance relationships enable rapid response and claims support in major catastrophe scenarios.

Technology and data firms
Alliances with data providers and insurtechs boost Chubb’s underwriting, fraud detection, and claims automation, helping refine risk scoring and pricing accuracy; Chubb’s market cap was about 82 billion USD in 2024, underpinning continued tech investments. Cloud, AI, and automation partners reduce processing times and improve CX, while co-development speeds digital product rollout and go-to-market.
- Data partners: richer risk scoring
- Insurtechs: faster claims automation
- Cloud/AI: operational efficiency
- Co-development: quicker product launch
Affinity and distribution partners
Affinity partners—banks, associations, retailers, travel platforms—provide embedded and co-branded channels that reach targeted segments at lower acquisition cost and lift conversion through integrated offers and cross-sell; Chubb supports these with compliant products, APIs, and service infrastructure.
Chubb operates in 54 countries with ~31,000 employees (2024), enabling global partner scale and local regulatory compliance.
- Channels: banks, retailers, travel platforms
- Benefit: lower acquisition cost, higher conversion
- Chubb: compliant products, APIs, service infra
Global insurer expands via brokers, reinsurers and insurtech; market cap ~82 bn USD
Chubb relies on thousands of independent agents and major global brokers to expand reach and place complex multinational risks.
Reinsurance partnerships manage catastrophe exposure and stabilize combined ratios; market cap ~82 billion USD (2024) supports capacity access.
Data, insurtech and cloud alliances improve underwriting, claims automation and speed to market; employees ~31,000 across 54 countries (2024).
| Metric | 2024 |
|---|---|
| Market cap | ~82 bn USD |
| Employees | ~31,000 |
| Countries | 54 |
| Top-3 brokers share | ~60% corporate broking revs |
What is included in the product
 Detailed Word Document
A comprehensive Business Model Canvas tailored to Chubb’s global insurance operations, detailing customer segments, channels, value propositions, revenue streams, key activities, resources, partners, cost structure, and governance. Designed for analysts and executives, it links competitive advantages with SWOT insights to support strategic decisions, investor presentations, and risk-informed planning.

 Customizable Excel Spreadsheet
Condenses Chubb’s complex insurance and risk-management strategy into a digestible, one-page Business Model Canvas that saves hours of structuring and is editable for fast team collaboration and boardroom-ready presentations.
Activities

Underwriting excellence
Underwriting excellence drives profitability at Chubb through rigorous risk assessment, precise pricing, and selective acceptance aligned to loss-costs. Chubb applies technical underwriting and standardized guidelines across lines to maintain consistency. Authority frameworks empower local decisioning while preserving centralized controls for speed and oversight. As of 2024 Chubb operates in 54 countries and territories, and portfolio management actively adjusts appetite to market cycles.
Claims management
Fast, fair claims handling drives customer loyalty and lowers leakage; in 2024 Chubb paid $17.9 billion in claims, underscoring scale and the need for efficiency.
Digital FNOL, automated triage and curated vendor networks shorten cycle time—digital-first workflows can cut turnaround by up to 40% in practice.
Complex losses leverage specialist adjusters and in-house legal teams while analytics monitor severity and flag fraud patterns for recovery and control.

Risk engineering
Risk engineering delivers loss-prevention services that reduce claim frequency and severity for clients through surveys, control recommendations and benchmarking. In 2024 Chubb engineers’ insights feed underwriting and pricing to better select risks and set premiums. Tangible client value from fewer losses improves retention and underwriting margins.

Capital and reinsurance management
Chubb optimizes capital across legal entities to sustain its S&P AA rating (2024) and support global growth, using intra-group capital fungibility and dividend planning. Reinsurance programs dampen catastrophe and large-loss volatility, transferring peak risks to the market. Scenario testing and enterprise risk management set facultative limits and aggregate exposures. Regulatory capital is actively managed across 50+ jurisdictions.
- Capital allocation: S&P AA (2024)
- Reinsurance: catastrophe smoothing
- ERM: scenario testing & limits
- Regulatory: managed across 50+ jurisdictions
Product and distribution development
Designing tailored coverages meets evolving customer needs while Chubb pushed digital and embedded solutions in 2024, growing digital distribution share by double digits year-over-year; broker-driven models sustain wholesale reach. Pricing, forms and filings are continuously iterated to maintain competitiveness, and targeted training and enablement programs raised distribution productivity across channels.
- Tailored coverages: customer-centric product design
- Distribution mix: embedded, digital, broker-driven
- Iterative pricing/forms: faster filings for competitiveness
- Enablement: training to boost broker and digital productivity
Underwriting, claims and risk engineering drive profits; $17.9B, AA rating
Underwriting discipline, claims excellence and risk engineering drive profitability and retention; Chubb paid $17.9B in claims (2024) and operates in 54 countries. Capital and reinsurance management sustain an S&P AA rating (2024) and limit catastrophe volatility. Digital-first distribution and tailored products expanded reach with double-digit digital growth in 2024.
| Metric | 2024 |
|---|---|
| Claims paid | $17.9B |
| Countries | 54 |
| S&P rating | AA |
| Digital growth | Double-digit |
Delivered as Displayed
Business Model Canvas
The Chubb Business Model Canvas shown here is the exact, live document you’ll receive after purchase, not a mockup or sample. When you complete your order you’ll get this same fully structured, editable file with all content and sections included. No surprises—what you preview is what you’ll own.

Insurer Business Model Canvas: Strategic blueprint for value, risk and market growth
Unlock the strategic blueprint behind Chubb with our concise Business Model Canvas, showing how the insurer creates value, manages risk, and captures premium market share. This in-depth, editable canvas is ideal for investors, consultants, and executives. Download the full Word and Excel files to benchmark and apply Chubb’s proven strategies.
Partnerships
Independent agents
Chubb relies on thousands of independent agents to originate and service a large share of its policies, expanding market reach into local and niche customer bases across 54 countries and territories. Agents deliver advisory selling that boosts conversion and retention, while Chubb supports them with training, digital portals, and competitive commission structures tied to performance.
Global brokers
Partnerships with major global brokers give Chubb access to multinational and complex risks, with the top three brokers accounting for roughly 60% of corporate broking revenues in 2024.
Brokers aggregate corporate demand and tailor placements across jurisdictions, creating scale and loss-profiling data that feed product design and pricing feedback loops.
Chubb leverages capacity, specialist underwriting expertise and service SLAs to win placements and respond to broker-driven market signals.
Reinsurers
Reinsurers help Chubb manage peak exposures and earnings volatility by enabling treaties and facultative placements that cede significant catastrophe risk; Chubb’s market capitalization near 80 billion USD in 2024 underpins its access to capacity. Ceding optimizes capital usage and helps stabilize combined ratios, while long-term reinsurance relationships enable rapid response and claims support in major catastrophe scenarios.
Technology and data firms
Alliances with data providers and insurtechs boost Chubb’s underwriting, fraud detection, and claims automation, helping refine risk scoring and pricing accuracy; Chubb’s market cap was about 82 billion USD in 2024, underpinning continued tech investments. Cloud, AI, and automation partners reduce processing times and improve CX, while co-development speeds digital product rollout and go-to-market.
- Data partners: richer risk scoring
- Insurtechs: faster claims automation
- Cloud/AI: operational efficiency
- Co-development: quicker product launch
Affinity and distribution partners
Affinity partners—banks, associations, retailers, travel platforms—provide embedded and co-branded channels that reach targeted segments at lower acquisition cost and lift conversion through integrated offers and cross-sell; Chubb supports these with compliant products, APIs, and service infrastructure.
Chubb operates in 54 countries with ~31,000 employees (2024), enabling global partner scale and local regulatory compliance.
- Channels: banks, retailers, travel platforms
- Benefit: lower acquisition cost, higher conversion
- Chubb: compliant products, APIs, service infra
Global insurer expands via brokers, reinsurers and insurtech; market cap ~82 bn USD
Chubb relies on thousands of independent agents and major global brokers to expand reach and place complex multinational risks.
Reinsurance partnerships manage catastrophe exposure and stabilize combined ratios; market cap ~82 billion USD (2024) supports capacity access.
Data, insurtech and cloud alliances improve underwriting, claims automation and speed to market; employees ~31,000 across 54 countries (2024).
| Metric | 2024 |
|---|---|
| Market cap | ~82 bn USD |
| Employees | ~31,000 |
| Countries | 54 |
| Top-3 brokers share | ~60% corporate broking revs |
What is included in the product
Detailed Word Document
A comprehensive Business Model Canvas tailored to Chubb’s global insurance operations, detailing customer segments, channels, value propositions, revenue streams, key activities, resources, partners, cost structure, and governance. Designed for analysts and executives, it links competitive advantages with SWOT insights to support strategic decisions, investor presentations, and risk-informed planning.
Customizable Excel Spreadsheet
Condenses Chubb’s complex insurance and risk-management strategy into a digestible, one-page Business Model Canvas that saves hours of structuring and is editable for fast team collaboration and boardroom-ready presentations.
Activities
Underwriting excellence
Underwriting excellence drives profitability at Chubb through rigorous risk assessment, precise pricing, and selective acceptance aligned to loss-costs. Chubb applies technical underwriting and standardized guidelines across lines to maintain consistency. Authority frameworks empower local decisioning while preserving centralized controls for speed and oversight. As of 2024 Chubb operates in 54 countries and territories, and portfolio management actively adjusts appetite to market cycles.
Claims management
Fast, fair claims handling drives customer loyalty and lowers leakage; in 2024 Chubb paid $17.9 billion in claims, underscoring scale and the need for efficiency.
Digital FNOL, automated triage and curated vendor networks shorten cycle time—digital-first workflows can cut turnaround by up to 40% in practice.
Complex losses leverage specialist adjusters and in-house legal teams while analytics monitor severity and flag fraud patterns for recovery and control.
Risk engineering
Risk engineering delivers loss-prevention services that reduce claim frequency and severity for clients through surveys, control recommendations and benchmarking. In 2024 Chubb engineers’ insights feed underwriting and pricing to better select risks and set premiums. Tangible client value from fewer losses improves retention and underwriting margins.
Capital and reinsurance management
Chubb optimizes capital across legal entities to sustain its S&P AA rating (2024) and support global growth, using intra-group capital fungibility and dividend planning. Reinsurance programs dampen catastrophe and large-loss volatility, transferring peak risks to the market. Scenario testing and enterprise risk management set facultative limits and aggregate exposures. Regulatory capital is actively managed across 50+ jurisdictions.
- Capital allocation: S&P AA (2024)
- Reinsurance: catastrophe smoothing
- ERM: scenario testing & limits
- Regulatory: managed across 50+ jurisdictions
Product and distribution development
Designing tailored coverages meets evolving customer needs while Chubb pushed digital and embedded solutions in 2024, growing digital distribution share by double digits year-over-year; broker-driven models sustain wholesale reach. Pricing, forms and filings are continuously iterated to maintain competitiveness, and targeted training and enablement programs raised distribution productivity across channels.
- Tailored coverages: customer-centric product design
- Distribution mix: embedded, digital, broker-driven
- Iterative pricing/forms: faster filings for competitiveness
- Enablement: training to boost broker and digital productivity
Underwriting, claims and risk engineering drive profits; $17.9B, AA rating
Underwriting discipline, claims excellence and risk engineering drive profitability and retention; Chubb paid $17.9B in claims (2024) and operates in 54 countries. Capital and reinsurance management sustain an S&P AA rating (2024) and limit catastrophe volatility. Digital-first distribution and tailored products expanded reach with double-digit digital growth in 2024.
| Metric | 2024 |
|---|---|
| Claims paid | $17.9B |
| Countries | 54 |
| S&P rating | AA |
| Digital growth | Double-digit |
Delivered as Displayed
Business Model Canvas
The Chubb Business Model Canvas shown here is the exact, live document you’ll receive after purchase, not a mockup or sample. When you complete your order you’ll get this same fully structured, editable file with all content and sections included. No surprises—what you preview is what you’ll own.
Description
Insurer Business Model Canvas: Strategic blueprint for value, risk and market growth
Unlock the strategic blueprint behind Chubb with our concise Business Model Canvas, showing how the insurer creates value, manages risk, and captures premium market share. This in-depth, editable canvas is ideal for investors, consultants, and executives. Download the full Word and Excel files to benchmark and apply Chubb’s proven strategies.
Partnerships
Independent agents
Chubb relies on thousands of independent agents to originate and service a large share of its policies, expanding market reach into local and niche customer bases across 54 countries and territories. Agents deliver advisory selling that boosts conversion and retention, while Chubb supports them with training, digital portals, and competitive commission structures tied to performance.
Global brokers
Partnerships with major global brokers give Chubb access to multinational and complex risks, with the top three brokers accounting for roughly 60% of corporate broking revenues in 2024.
Brokers aggregate corporate demand and tailor placements across jurisdictions, creating scale and loss-profiling data that feed product design and pricing feedback loops.
Chubb leverages capacity, specialist underwriting expertise and service SLAs to win placements and respond to broker-driven market signals.
Reinsurers
Reinsurers help Chubb manage peak exposures and earnings volatility by enabling treaties and facultative placements that cede significant catastrophe risk; Chubb’s market capitalization near 80 billion USD in 2024 underpins its access to capacity. Ceding optimizes capital usage and helps stabilize combined ratios, while long-term reinsurance relationships enable rapid response and claims support in major catastrophe scenarios.
Technology and data firms
Alliances with data providers and insurtechs boost Chubb’s underwriting, fraud detection, and claims automation, helping refine risk scoring and pricing accuracy; Chubb’s market cap was about 82 billion USD in 2024, underpinning continued tech investments. Cloud, AI, and automation partners reduce processing times and improve CX, while co-development speeds digital product rollout and go-to-market.
- Data partners: richer risk scoring
- Insurtechs: faster claims automation
- Cloud/AI: operational efficiency
- Co-development: quicker product launch
Affinity and distribution partners
Affinity partners—banks, associations, retailers, travel platforms—provide embedded and co-branded channels that reach targeted segments at lower acquisition cost and lift conversion through integrated offers and cross-sell; Chubb supports these with compliant products, APIs, and service infrastructure.
Chubb operates in 54 countries with ~31,000 employees (2024), enabling global partner scale and local regulatory compliance.
- Channels: banks, retailers, travel platforms
- Benefit: lower acquisition cost, higher conversion
- Chubb: compliant products, APIs, service infra
Global insurer expands via brokers, reinsurers and insurtech; market cap ~82 bn USD
Chubb relies on thousands of independent agents and major global brokers to expand reach and place complex multinational risks.
Reinsurance partnerships manage catastrophe exposure and stabilize combined ratios; market cap ~82 billion USD (2024) supports capacity access.
Data, insurtech and cloud alliances improve underwriting, claims automation and speed to market; employees ~31,000 across 54 countries (2024).
| Metric | 2024 |
|---|---|
| Market cap | ~82 bn USD |
| Employees | ~31,000 |
| Countries | 54 |
| Top-3 brokers share | ~60% corporate broking revs |
What is included in the product
Detailed Word Document
A comprehensive Business Model Canvas tailored to Chubb’s global insurance operations, detailing customer segments, channels, value propositions, revenue streams, key activities, resources, partners, cost structure, and governance. Designed for analysts and executives, it links competitive advantages with SWOT insights to support strategic decisions, investor presentations, and risk-informed planning.
Customizable Excel Spreadsheet
Condenses Chubb’s complex insurance and risk-management strategy into a digestible, one-page Business Model Canvas that saves hours of structuring and is editable for fast team collaboration and boardroom-ready presentations.
Activities
Underwriting excellence
Underwriting excellence drives profitability at Chubb through rigorous risk assessment, precise pricing, and selective acceptance aligned to loss-costs. Chubb applies technical underwriting and standardized guidelines across lines to maintain consistency. Authority frameworks empower local decisioning while preserving centralized controls for speed and oversight. As of 2024 Chubb operates in 54 countries and territories, and portfolio management actively adjusts appetite to market cycles.
Claims management
Fast, fair claims handling drives customer loyalty and lowers leakage; in 2024 Chubb paid $17.9 billion in claims, underscoring scale and the need for efficiency.
Digital FNOL, automated triage and curated vendor networks shorten cycle time—digital-first workflows can cut turnaround by up to 40% in practice.
Complex losses leverage specialist adjusters and in-house legal teams while analytics monitor severity and flag fraud patterns for recovery and control.
Risk engineering
Risk engineering delivers loss-prevention services that reduce claim frequency and severity for clients through surveys, control recommendations and benchmarking. In 2024 Chubb engineers’ insights feed underwriting and pricing to better select risks and set premiums. Tangible client value from fewer losses improves retention and underwriting margins.
Capital and reinsurance management
Chubb optimizes capital across legal entities to sustain its S&P AA rating (2024) and support global growth, using intra-group capital fungibility and dividend planning. Reinsurance programs dampen catastrophe and large-loss volatility, transferring peak risks to the market. Scenario testing and enterprise risk management set facultative limits and aggregate exposures. Regulatory capital is actively managed across 50+ jurisdictions.
- Capital allocation: S&P AA (2024)
- Reinsurance: catastrophe smoothing
- ERM: scenario testing & limits
- Regulatory: managed across 50+ jurisdictions
Product and distribution development
Designing tailored coverages meets evolving customer needs while Chubb pushed digital and embedded solutions in 2024, growing digital distribution share by double digits year-over-year; broker-driven models sustain wholesale reach. Pricing, forms and filings are continuously iterated to maintain competitiveness, and targeted training and enablement programs raised distribution productivity across channels.
- Tailored coverages: customer-centric product design
- Distribution mix: embedded, digital, broker-driven
- Iterative pricing/forms: faster filings for competitiveness
- Enablement: training to boost broker and digital productivity
Underwriting, claims and risk engineering drive profits; $17.9B, AA rating
Underwriting discipline, claims excellence and risk engineering drive profitability and retention; Chubb paid $17.9B in claims (2024) and operates in 54 countries. Capital and reinsurance management sustain an S&P AA rating (2024) and limit catastrophe volatility. Digital-first distribution and tailored products expanded reach with double-digit digital growth in 2024.
| Metric | 2024 |
|---|---|
| Claims paid | $17.9B |
| Countries | 54 |
| S&P rating | AA |
| Digital growth | Double-digit |
Delivered as Displayed
Business Model Canvas
The Chubb Business Model Canvas shown here is the exact, live document you’ll receive after purchase, not a mockup or sample. When you complete your order you’ll get this same fully structured, editable file with all content and sections included. No surprises—what you preview is what you’ll own.











