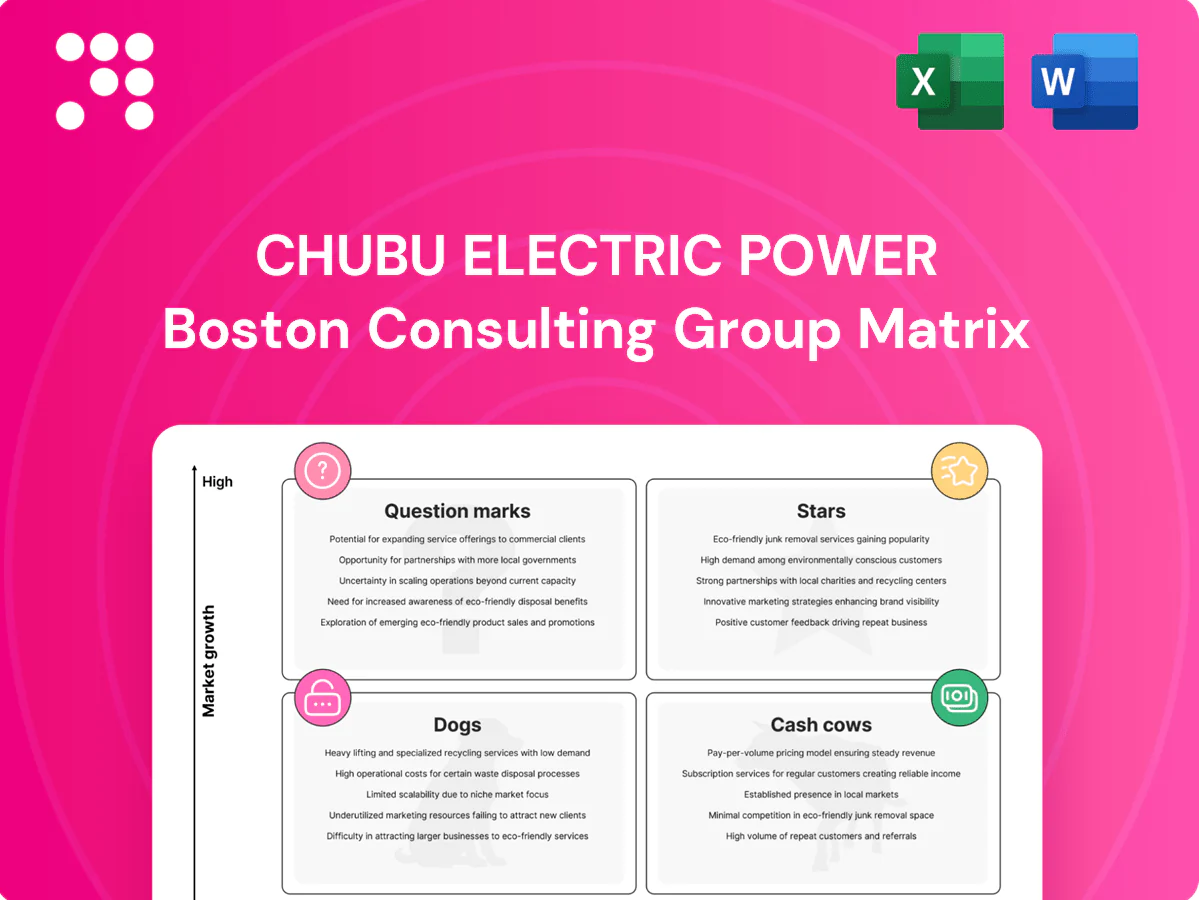
Chubu Electric Power Boston Consulting Group Matrix

See the Bigger Picture
Curious where Chubu Electric’s businesses fall—Stars, Cash Cows, Dogs, or Question Marks? This snapshot hints at strengths and risks, but the full BCG Matrix gives quadrant-by-quadrant clarity, data-backed recommendations, and a ready-to-use roadmap for allocating capital and optimizing the portfolio. Buy the complete report for a polished Word analysis plus an Excel summary you can present or plug into planning right away. Skip the guesswork—get the full strategic picture now.
Stars

Renewables build-out (wind, solar, hydro upgrades)
High-growth renewables market and Chubu has leaned in: its renewables generation share is rising fast as policy and corporate demand push clean power. Japan’s 6th Basic Energy Plan targets 36–38% renewables by 2030, creating strong market pull. Chubu, committed to carbon neutrality by 2050, soaks up capex now for wind, solar and hydro upgrades; sustaining share will flip investment into heavy cash later, so keep investing.
Energy solutions for industry (efficiency, DR, on-site)
Factories demand immediate cost cuts and decarbonization, driving uptake of efficiency, demand response and on-site generation; Chubu’s service-led offerings deliver stickier contracts and higher margins in this expanding industrial energy segment. Scaling requires stronger marketing, systems-integration talent and strategic partnerships; with disciplined execution the business can mature into a dependable, recurring-earnings contributor.

Distributed energy & microgrids
Resilience sells as demand for distributed energy and microgrids accelerates in Japan, with the global microgrid market growing at roughly a 12% CAGR to 2030 and rising regional investment in 2024. Chubu Electric’s regional trust and engineering depth, backed by group sales of about 3.5 trillion yen (FY2023), gives it an edge winning municipal and industrial projects. Projects typically tie up cash during 12–36 month builds but convert to recurring O&M revenue with double-digit margins. Keep the flywheel spinning by prioritizing selective, high-IRR sites.

Utility-scale storage projects
Utility-scale storage projects are rising as renewables expand, and early wins in Japan boost Chubu Electric’s local credibility and market share; 2024 BNEF data shows battery-pack prices approaching ~100 USD/kWh, improving project economics. Capex intensity and standardization risks demand strict project discipline and contracting. When scaled correctly, storage can become the backbone enabling future cash cows.
- Demand: driven by renewables integration
- Economics: pack prices ~100 USD/kWh (2024 BNEF)
- Risk: high capex, evolving standards
- Opportunity: platform for future cash flows
International clean-energy ventures
Selective overseas growth can compound faster than the home market; global clean-energy investment topped about $1.1 trillion in 2024, making early scale abroad high-reward for Chubu. Early positions in quality platforms can set leadership, but integration risk is real and initial cash burn often heavy. Back only the assets where Chubu’s operational edge actually moves the needle.
- Selective overseas expansion
- Prioritise platform leadership
- Mitigate integration & cash-burn
- Back assets with clear operational edge
Renewables surge - Japan aims 36-38% by 2030, storage fuels growth
High-growth renewables (Japan target 36–38% by 2030) makes Chubu’s renewables and storage investments Stars with rapid revenue and share expansion. Industrial energy and microgrids drive higher-margin, recurring contracts, converting heavy capex into future cash cows. Discipline on project selection and selective overseas scale key to sustaining ROI.
| Metric | Value | Implication |
|---|---|---|
| Japan renewables target | 36–38% by 2030 | Market pull |
| Group sales | ¥3.5T FY2023 | Balance-sheet support |
| Battery price | ~100 USD/kWh (2024) | Improving economics |
| Global clean energy | $1.1T (2024) | Scale opportunity |
What is included in the product
 Detailed Word Document
In-depth BCG review of Chubu Electric units, mapping Stars, Cash Cows, Question Marks and Dogs with investment guidance.

 Customizable Excel Spreadsheet
One-page Chubu Electric BCG Matrix placing each business unit in a quadrant for quick C-suite decisions and deck-ready exports.
Cash Cows

Transmission & distribution network (regulated core)
Transmission and distribution network (regulated core) sits in a mature market with Chubu Electric holding a dominant regional position, providing steady cash flows. Stable regulated returns plus operational efficiency gains lift yield while capex focuses on reliability rather than promotion. Low marketing needs allow cash extraction to fund modernization; prioritize cost-out, smart-grid upgrades and avoid gold-plating.
Regional electricity retail base
Regional electricity retail is a cash cow for Chubu Electric, with roughly 8 million core customers as of 2024 in a near‑zero growth market (0–1% p.a.); high stickiness and low churn keep acquisition costs down. Pricing and active churn management sustain retail gross margins near 5–8%, while marketing spend is restrained (under 1% of revenue) to protect share. Excess cash funds newer growth bets without starving service quality.

Thermal generation fleet (efficient units)
Not glamorous but prints cash in a stable demand band as baseload providers; fuel-cost and fuel-availability optimization are the primary levers for margin protection. Growth is flat while emissions regulation is the binding constraint—Japan targets a 46% GHG cut by 2030 (vs 2013) and carbon neutrality by 2050. Run efficiently, hedge fuel and FX smartly, and harvest cash to fund the low-carbon transition.

Hydropower legacy assets
Hydropower legacy assets deliver low variable cost, predictable baseload output and multi-decade lifespans, making them classic cash cows for Chubu Electric; margins remained solid with steady positive free cash flow in FY2024. Market growth is modest, demand stable, and promotional spend minimal, so strategy is maintain core fleet, uprate selectively and keep cash flowing.
- Low variable cost
- Predictable output
- Long-lived assets
- Modest market growth
- Selective uprates
City gas and heat supply (established customers)
City gas and heat supply serves a high-share, service-driven customer base with steady demand and limited growth; cross-sell into energy solutions and maintenance contracts expands lifetime value. Capex is largely maintenance and selective upgrades to networks and CHP units, keeping reliability high and margins tidy, making this a dependable cash engine for Chubu Electric.
- High share, steady demand
- Limited organic growth; cross-sell potential
- Capex focused on maintenance/upgrades
- High reliability, consistent margins
Regulated T&D, 8M customers and hydropower fund decarbonization
Chubu Electric cash cows—regulated T&D, retail (8 million customers in 2024), baseload thermal, hydropower and city gas—generate stable free cash flow; retail gross margins ~5–8% and marketing <1% of revenue. Focus: cost-out, reliability capex, selective uprates and fuel/FX hedging to fund decarbonization (Japan: 46% GHG cut by 2030 vs 2013). Hydropower and gas deliver predictable margins and low promotion needs.
| Asset | 2024 datapoint | Role |
|---|---|---|
| Retail | 8,000,000 customers; margin 5–8% | Cash generator |
| Marketing | <1% revenue | Low spend |
| Hydropower | Positive FCF FY2024 | Baseload, low var cost |
| Policy | 46% GHG cut by 2030 (vs 2013) | Constraint on thermal |
What You’re Viewing Is Included
Chubu Electric Power BCG Matrix
The Chubu Electric Power BCG Matrix you’re previewing here is the exact file you’ll receive after purchase. No watermarks, no placeholders—just a fully formatted, analysis-ready report tailored to utility strategy and portfolio management. Buy once and download immediately for editing, printing, or presenting. It’s the final deliverable—clear, professional, and ready to plug into your planning.

See the Bigger Picture
Curious where Chubu Electric’s businesses fall—Stars, Cash Cows, Dogs, or Question Marks? This snapshot hints at strengths and risks, but the full BCG Matrix gives quadrant-by-quadrant clarity, data-backed recommendations, and a ready-to-use roadmap for allocating capital and optimizing the portfolio. Buy the complete report for a polished Word analysis plus an Excel summary you can present or plug into planning right away. Skip the guesswork—get the full strategic picture now.
Stars
Renewables build-out (wind, solar, hydro upgrades)
High-growth renewables market and Chubu has leaned in: its renewables generation share is rising fast as policy and corporate demand push clean power. Japan’s 6th Basic Energy Plan targets 36–38% renewables by 2030, creating strong market pull. Chubu, committed to carbon neutrality by 2050, soaks up capex now for wind, solar and hydro upgrades; sustaining share will flip investment into heavy cash later, so keep investing.
Energy solutions for industry (efficiency, DR, on-site)
Factories demand immediate cost cuts and decarbonization, driving uptake of efficiency, demand response and on-site generation; Chubu’s service-led offerings deliver stickier contracts and higher margins in this expanding industrial energy segment. Scaling requires stronger marketing, systems-integration talent and strategic partnerships; with disciplined execution the business can mature into a dependable, recurring-earnings contributor.
Distributed energy & microgrids
Resilience sells as demand for distributed energy and microgrids accelerates in Japan, with the global microgrid market growing at roughly a 12% CAGR to 2030 and rising regional investment in 2024. Chubu Electric’s regional trust and engineering depth, backed by group sales of about 3.5 trillion yen (FY2023), gives it an edge winning municipal and industrial projects. Projects typically tie up cash during 12–36 month builds but convert to recurring O&M revenue with double-digit margins. Keep the flywheel spinning by prioritizing selective, high-IRR sites.
Utility-scale storage projects
Utility-scale storage projects are rising as renewables expand, and early wins in Japan boost Chubu Electric’s local credibility and market share; 2024 BNEF data shows battery-pack prices approaching ~100 USD/kWh, improving project economics. Capex intensity and standardization risks demand strict project discipline and contracting. When scaled correctly, storage can become the backbone enabling future cash cows.
- Demand: driven by renewables integration
- Economics: pack prices ~100 USD/kWh (2024 BNEF)
- Risk: high capex, evolving standards
- Opportunity: platform for future cash flows
International clean-energy ventures
Selective overseas growth can compound faster than the home market; global clean-energy investment topped about $1.1 trillion in 2024, making early scale abroad high-reward for Chubu. Early positions in quality platforms can set leadership, but integration risk is real and initial cash burn often heavy. Back only the assets where Chubu’s operational edge actually moves the needle.
- Selective overseas expansion
- Prioritise platform leadership
- Mitigate integration & cash-burn
- Back assets with clear operational edge
Renewables surge - Japan aims 36-38% by 2030, storage fuels growth
High-growth renewables (Japan target 36–38% by 2030) makes Chubu’s renewables and storage investments Stars with rapid revenue and share expansion. Industrial energy and microgrids drive higher-margin, recurring contracts, converting heavy capex into future cash cows. Discipline on project selection and selective overseas scale key to sustaining ROI.
| Metric | Value | Implication |
|---|---|---|
| Japan renewables target | 36–38% by 2030 | Market pull |
| Group sales | ¥3.5T FY2023 | Balance-sheet support |
| Battery price | ~100 USD/kWh (2024) | Improving economics |
| Global clean energy | $1.1T (2024) | Scale opportunity |
What is included in the product
Detailed Word Document
In-depth BCG review of Chubu Electric units, mapping Stars, Cash Cows, Question Marks and Dogs with investment guidance.
Customizable Excel Spreadsheet
One-page Chubu Electric BCG Matrix placing each business unit in a quadrant for quick C-suite decisions and deck-ready exports.
Cash Cows
Transmission & distribution network (regulated core)
Transmission and distribution network (regulated core) sits in a mature market with Chubu Electric holding a dominant regional position, providing steady cash flows. Stable regulated returns plus operational efficiency gains lift yield while capex focuses on reliability rather than promotion. Low marketing needs allow cash extraction to fund modernization; prioritize cost-out, smart-grid upgrades and avoid gold-plating.
Regional electricity retail base
Regional electricity retail is a cash cow for Chubu Electric, with roughly 8 million core customers as of 2024 in a near‑zero growth market (0–1% p.a.); high stickiness and low churn keep acquisition costs down. Pricing and active churn management sustain retail gross margins near 5–8%, while marketing spend is restrained (under 1% of revenue) to protect share. Excess cash funds newer growth bets without starving service quality.
Thermal generation fleet (efficient units)
Not glamorous but prints cash in a stable demand band as baseload providers; fuel-cost and fuel-availability optimization are the primary levers for margin protection. Growth is flat while emissions regulation is the binding constraint—Japan targets a 46% GHG cut by 2030 (vs 2013) and carbon neutrality by 2050. Run efficiently, hedge fuel and FX smartly, and harvest cash to fund the low-carbon transition.
Hydropower legacy assets
Hydropower legacy assets deliver low variable cost, predictable baseload output and multi-decade lifespans, making them classic cash cows for Chubu Electric; margins remained solid with steady positive free cash flow in FY2024. Market growth is modest, demand stable, and promotional spend minimal, so strategy is maintain core fleet, uprate selectively and keep cash flowing.
- Low variable cost
- Predictable output
- Long-lived assets
- Modest market growth
- Selective uprates
City gas and heat supply (established customers)
City gas and heat supply serves a high-share, service-driven customer base with steady demand and limited growth; cross-sell into energy solutions and maintenance contracts expands lifetime value. Capex is largely maintenance and selective upgrades to networks and CHP units, keeping reliability high and margins tidy, making this a dependable cash engine for Chubu Electric.
- High share, steady demand
- Limited organic growth; cross-sell potential
- Capex focused on maintenance/upgrades
- High reliability, consistent margins
Regulated T&D, 8M customers and hydropower fund decarbonization
Chubu Electric cash cows—regulated T&D, retail (8 million customers in 2024), baseload thermal, hydropower and city gas—generate stable free cash flow; retail gross margins ~5–8% and marketing <1% of revenue. Focus: cost-out, reliability capex, selective uprates and fuel/FX hedging to fund decarbonization (Japan: 46% GHG cut by 2030 vs 2013). Hydropower and gas deliver predictable margins and low promotion needs.
| Asset | 2024 datapoint | Role |
|---|---|---|
| Retail | 8,000,000 customers; margin 5–8% | Cash generator |
| Marketing | <1% revenue | Low spend |
| Hydropower | Positive FCF FY2024 | Baseload, low var cost |
| Policy | 46% GHG cut by 2030 (vs 2013) | Constraint on thermal |
What You’re Viewing Is Included
Chubu Electric Power BCG Matrix
The Chubu Electric Power BCG Matrix you’re previewing here is the exact file you’ll receive after purchase. No watermarks, no placeholders—just a fully formatted, analysis-ready report tailored to utility strategy and portfolio management. Buy once and download immediately for editing, printing, or presenting. It’s the final deliverable—clear, professional, and ready to plug into your planning.
Original: $10.00
-65%$10.00
$3.50Description
See the Bigger Picture
Curious where Chubu Electric’s businesses fall—Stars, Cash Cows, Dogs, or Question Marks? This snapshot hints at strengths and risks, but the full BCG Matrix gives quadrant-by-quadrant clarity, data-backed recommendations, and a ready-to-use roadmap for allocating capital and optimizing the portfolio. Buy the complete report for a polished Word analysis plus an Excel summary you can present or plug into planning right away. Skip the guesswork—get the full strategic picture now.
Stars
Renewables build-out (wind, solar, hydro upgrades)
High-growth renewables market and Chubu has leaned in: its renewables generation share is rising fast as policy and corporate demand push clean power. Japan’s 6th Basic Energy Plan targets 36–38% renewables by 2030, creating strong market pull. Chubu, committed to carbon neutrality by 2050, soaks up capex now for wind, solar and hydro upgrades; sustaining share will flip investment into heavy cash later, so keep investing.
Energy solutions for industry (efficiency, DR, on-site)
Factories demand immediate cost cuts and decarbonization, driving uptake of efficiency, demand response and on-site generation; Chubu’s service-led offerings deliver stickier contracts and higher margins in this expanding industrial energy segment. Scaling requires stronger marketing, systems-integration talent and strategic partnerships; with disciplined execution the business can mature into a dependable, recurring-earnings contributor.
Distributed energy & microgrids
Resilience sells as demand for distributed energy and microgrids accelerates in Japan, with the global microgrid market growing at roughly a 12% CAGR to 2030 and rising regional investment in 2024. Chubu Electric’s regional trust and engineering depth, backed by group sales of about 3.5 trillion yen (FY2023), gives it an edge winning municipal and industrial projects. Projects typically tie up cash during 12–36 month builds but convert to recurring O&M revenue with double-digit margins. Keep the flywheel spinning by prioritizing selective, high-IRR sites.
Utility-scale storage projects
Utility-scale storage projects are rising as renewables expand, and early wins in Japan boost Chubu Electric’s local credibility and market share; 2024 BNEF data shows battery-pack prices approaching ~100 USD/kWh, improving project economics. Capex intensity and standardization risks demand strict project discipline and contracting. When scaled correctly, storage can become the backbone enabling future cash cows.
- Demand: driven by renewables integration
- Economics: pack prices ~100 USD/kWh (2024 BNEF)
- Risk: high capex, evolving standards
- Opportunity: platform for future cash flows
International clean-energy ventures
Selective overseas growth can compound faster than the home market; global clean-energy investment topped about $1.1 trillion in 2024, making early scale abroad high-reward for Chubu. Early positions in quality platforms can set leadership, but integration risk is real and initial cash burn often heavy. Back only the assets where Chubu’s operational edge actually moves the needle.
- Selective overseas expansion
- Prioritise platform leadership
- Mitigate integration & cash-burn
- Back assets with clear operational edge
Renewables surge - Japan aims 36-38% by 2030, storage fuels growth
High-growth renewables (Japan target 36–38% by 2030) makes Chubu’s renewables and storage investments Stars with rapid revenue and share expansion. Industrial energy and microgrids drive higher-margin, recurring contracts, converting heavy capex into future cash cows. Discipline on project selection and selective overseas scale key to sustaining ROI.
| Metric | Value | Implication |
|---|---|---|
| Japan renewables target | 36–38% by 2030 | Market pull |
| Group sales | ¥3.5T FY2023 | Balance-sheet support |
| Battery price | ~100 USD/kWh (2024) | Improving economics |
| Global clean energy | $1.1T (2024) | Scale opportunity |
What is included in the product
Detailed Word Document
In-depth BCG review of Chubu Electric units, mapping Stars, Cash Cows, Question Marks and Dogs with investment guidance.
Customizable Excel Spreadsheet
One-page Chubu Electric BCG Matrix placing each business unit in a quadrant for quick C-suite decisions and deck-ready exports.
Cash Cows
Transmission & distribution network (regulated core)
Transmission and distribution network (regulated core) sits in a mature market with Chubu Electric holding a dominant regional position, providing steady cash flows. Stable regulated returns plus operational efficiency gains lift yield while capex focuses on reliability rather than promotion. Low marketing needs allow cash extraction to fund modernization; prioritize cost-out, smart-grid upgrades and avoid gold-plating.
Regional electricity retail base
Regional electricity retail is a cash cow for Chubu Electric, with roughly 8 million core customers as of 2024 in a near‑zero growth market (0–1% p.a.); high stickiness and low churn keep acquisition costs down. Pricing and active churn management sustain retail gross margins near 5–8%, while marketing spend is restrained (under 1% of revenue) to protect share. Excess cash funds newer growth bets without starving service quality.
Thermal generation fleet (efficient units)
Not glamorous but prints cash in a stable demand band as baseload providers; fuel-cost and fuel-availability optimization are the primary levers for margin protection. Growth is flat while emissions regulation is the binding constraint—Japan targets a 46% GHG cut by 2030 (vs 2013) and carbon neutrality by 2050. Run efficiently, hedge fuel and FX smartly, and harvest cash to fund the low-carbon transition.
Hydropower legacy assets
Hydropower legacy assets deliver low variable cost, predictable baseload output and multi-decade lifespans, making them classic cash cows for Chubu Electric; margins remained solid with steady positive free cash flow in FY2024. Market growth is modest, demand stable, and promotional spend minimal, so strategy is maintain core fleet, uprate selectively and keep cash flowing.
- Low variable cost
- Predictable output
- Long-lived assets
- Modest market growth
- Selective uprates
City gas and heat supply (established customers)
City gas and heat supply serves a high-share, service-driven customer base with steady demand and limited growth; cross-sell into energy solutions and maintenance contracts expands lifetime value. Capex is largely maintenance and selective upgrades to networks and CHP units, keeping reliability high and margins tidy, making this a dependable cash engine for Chubu Electric.
- High share, steady demand
- Limited organic growth; cross-sell potential
- Capex focused on maintenance/upgrades
- High reliability, consistent margins
Regulated T&D, 8M customers and hydropower fund decarbonization
Chubu Electric cash cows—regulated T&D, retail (8 million customers in 2024), baseload thermal, hydropower and city gas—generate stable free cash flow; retail gross margins ~5–8% and marketing <1% of revenue. Focus: cost-out, reliability capex, selective uprates and fuel/FX hedging to fund decarbonization (Japan: 46% GHG cut by 2030 vs 2013). Hydropower and gas deliver predictable margins and low promotion needs.
| Asset | 2024 datapoint | Role |
|---|---|---|
| Retail | 8,000,000 customers; margin 5–8% | Cash generator |
| Marketing | <1% revenue | Low spend |
| Hydropower | Positive FCF FY2024 | Baseload, low var cost |
| Policy | 46% GHG cut by 2030 (vs 2013) | Constraint on thermal |
What You’re Viewing Is Included
Chubu Electric Power BCG Matrix
The Chubu Electric Power BCG Matrix you’re previewing here is the exact file you’ll receive after purchase. No watermarks, no placeholders—just a fully formatted, analysis-ready report tailored to utility strategy and portfolio management. Buy once and download immediately for editing, printing, or presenting. It’s the final deliverable—clear, professional, and ready to plug into your planning.











