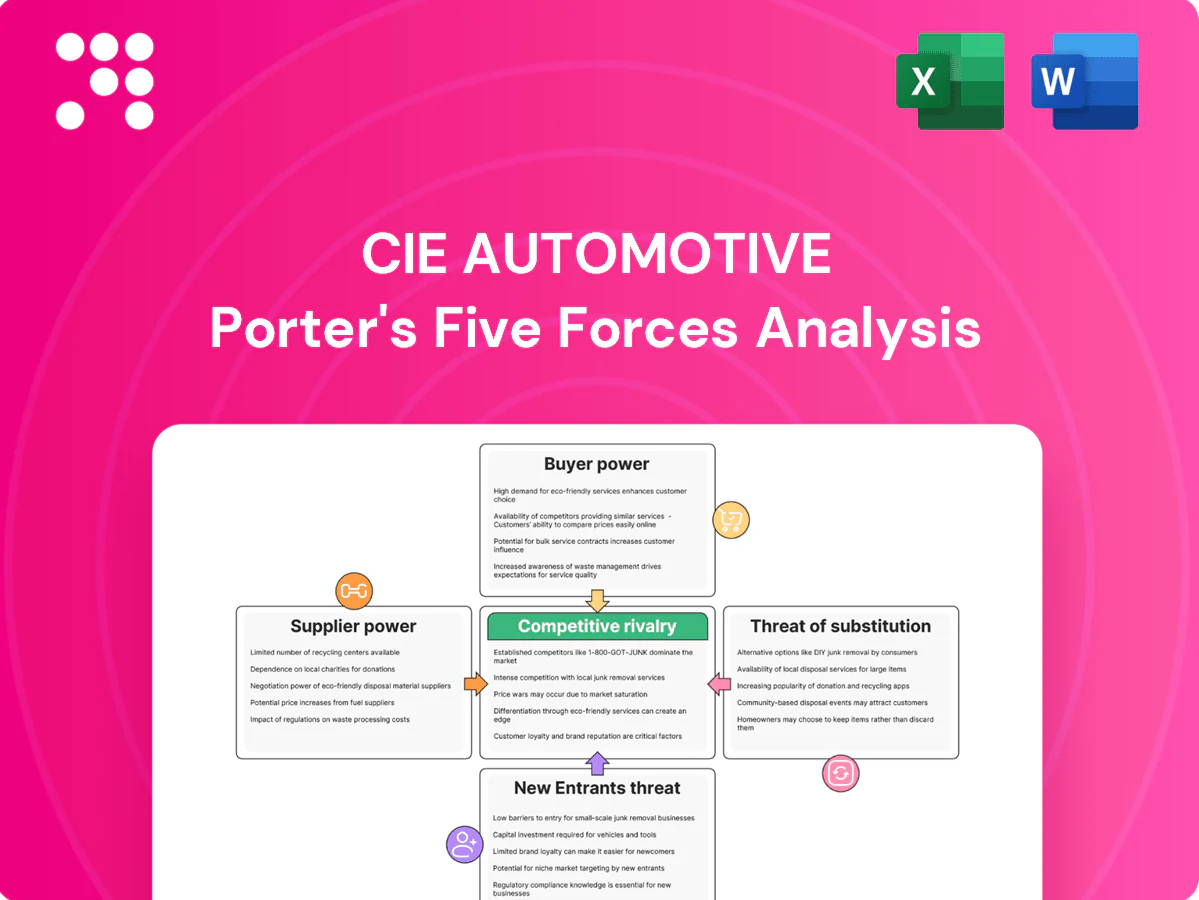
CIE Automotive Porter's Five Forces Analysis

From Overview to Strategy Blueprint
CIE Automotive faces mixed competitive pressures: strong supplier relationships and scale advantages temper supplier power, while buyer concentration and aftermarket substitutes elevate competitive intensity and margin risks. Regional diversification and technological capabilities help mitigate threats from new entrants, but cyclical auto demand and raw material volatility remain key vulnerabilities. This snapshot highlights critical forces and strategic implications. Unlock the full Porter's Five Forces Analysis to explore CIE Automotive’s competitive dynamics, market pressures, and strategic advantages in detail.
Suppliers Bargaining Power

Concentrated raw materials (steel, aluminum, resins)
Metals and engineered polymer supply is relatively concentrated—China accounted for about 56% of global crude steel output and roughly 60% of primary aluminum production in 2023—giving large mills and chemical majors leverage on pricing and allocation. Volatile commodity cycles force cost pass-through negotiations; CIE mitigates via multi-sourcing and hedging, but critical grades limit substitution. Long-term contracts stabilize supply, yet surcharges and extended lead times still pressure margins.
Specialized equipment, tooling, and dies dependency
Forging presses, die-casting machines and precision tooling are capital-intensive (equipment often >€1m) and provided by a concentrated set of OEMs, creating supplier leverage; tool lead times commonly run 8–24 weeks, adding switching frictions and schedule risk. Suppliers exert power via maintenance, spare parts and upgrades that affect uptime and margins. CIE (2023 revenue €3.6bn) mitigates exposure with in-house tooling and standardized platforms where feasible.

Energy intensity and utility exposure
Casting, forging and machining are highly energy-intensive, so energy suppliers and market prices materially influence CIE Automotive’s cost base; European industrial power spikes (up to ~4x in 2022) eased to roughly €100/MWh by 2024 (Eurostat), shifting margins and utilization.
Long-term power purchase agreements and capex on electrification and efficiency lower exposure and damp volatility, though decarbonization premiums (roughly +5–15% near-term) can raise supplier leverage.

ESG and specialty inputs constraints
ESG-driven demand for low-carbon aluminium/steel and certified recycled plastics tightens supplier leverage as compliant volumes remain constrained in 2024; OEMs' sustainability targets push qualification upstream, concentrating spend with a smaller pool of vetted vendors and raising scarcity pricing that CIE’s scale and supplier programs mitigate but do not remove.
- Concentration of compliant suppliers
- Upstream qualification cascade
- Certification/traceability dependence
- CIE scale lowers but not eliminates premiums
Logistics and regionalization dynamics
Freight capacity tightness and port congestion in 2024 pushed CIE Automotive toward regional carriers, with nearshoring increasing demand for reliable local logistics; just-in-time production means a single disruption can add 1–3% to production costs. Dual-shore inventories and supplier development reduce exposure, but specialty alloys and tooling still drive cross-border flows, keeping logistics providers' leverage high.
Supplier power: China steel 56%, Al 60%
Supplier power is high due to metals concentration (China ~56% steel, ~60% aluminum in 2023), capital‑intensive tooling (>€1m, 8–24 week lead times) and constrained low‑carbon material supply in 2024; energy swings (≈€100/MWh in 2024) and freight/port delays raise costs. CIE (2023 revenue €3.6bn) mitigates via multi‑sourcing, in‑house tooling and long contracts, but premiums persist.
| Factor | 2023/24 Metric | Impact |
|---|---|---|
| Metals concentration | China steel 56%, Al 60% (2023) | High price/leverage |
| Tooling | >€1m; 8–24w lead | Switching friction |
| Energy | ~€100/MWh (2024) | Cost variability |
| ESG supply | Limited compliant volumes (2024) | Premiums |
What is included in the product
 Detailed Word Document
Tailored Porter's Five Forces analysis for CIE Automotive that uncovers key competitive drivers, supplier and buyer power, threat of substitutes and new entrants, and identifies disruptive risks and strategic levers to protect margins.

 Customizable Excel Spreadsheet
Concise Porter's Five Forces for CIE Automotive—one-sheet clarity that quickly highlights supplier, buyer, and competitor pressures to remove strategic blind spots; easily customizable to reflect M&A, supply-chain shocks, or new regulations for immediate boardroom use.
Customers Bargaining Power

Highly concentrated OEM buyer base
Global automakers and Tier‑1s form a highly concentrated OEM buyer base that buys in large volumes and runs aggressive competitive sourcing, exerting strong price pressure; vendor scorecards and annual productivity givebacks are standard. Volume leverage forces customers to demand cost transparency and indexation. CIE counters with process excellence, multi‑technology bundling and a global footprint to defend margins.
Design-in and platform lock-in
Once CIE’s parts are validated on a platform, switching mid-cycle is costly for OEMs—PPAP approvals commonly take 6–12 months and tooling amortization typically spans 3–5 years, creating strong inertia that tempers buyer power.
At new award cycles (often every 3–7 years) buyers regain leverage, but superior launch performance and targeted value engineering materially increase CIE’s retention odds.

Quality, delivery, and penalties regime
Strict IATF 16949 and PPAP regimes plus zero-defect expectations let buyers impose chargebacks and expedite costs, directly pressuring suppliers. OTIF targets typically exceed 95% and PPM thresholds often sit below 100 ppm, with misses hitting margins and future contract awards. This extends buyer power beyond price into service-level enforcement. Robust operational excellence and digital traceability are critical defenses.

EV transition reshaping content
Shift to EVs changes component mix, cutting traditional ICE parts and boosting lightweight, thermal management and powertrain electrification components; industry estimates put global BEV+PHEV new-car share at about 18% in 2024, intensifying buyer rebids and supplier consolidation. Early EV co-development can lock CIE into platforms and reduce switching; lagging on EV tech increases buyer substitution risk.
- Buyers leverage transition: rebids, consolidation
- EV mix: more lightweight/thermal parts
- Co-development: reduces switching
- Tech lag: raises substitution options
Global sourcing and should-cost analytics
OEMs run global RFQs using should-cost models that pit regions and processes against each other, increasing transparency and compressing margins on commoditized parts.
Differentiation through complex geometries, automation and verified sustainability data preserves pricing power for suppliers like CIE Automotive.
Local content rules in markets such as North America and the EU moderate buyer leverage by protecting regional sourcing.
- Global RFQs: standardized should-cost models
- Margin pressure: commoditized parts see compression
- Countermeasures: complexity, automation, sustainability
- Regulatory buffer: local content rules reduce leverage
RFQ:OTIF>95%,PPM<100 ppm;EV rebids(18%)
OEMs buy large volumes via global RFQs and should‑costing, driving price transparency and annual productivity demands; OTIF targets >95% and PPM thresholds often <100 ppm pressure supplier margins. Platform validation and lengthy PPAP/tooling cycles create switching inertia, but EV rebids (BEV+PHEV ~18% of new cars in 2024) amplify buyer leverage.
| Metric | 2024 value | Impact |
|---|---|---|
| BEV+PHEV share | ~18% | more rebids, consolidation |
| OTIF target | >95% | service-level enforcement |
| PPM threshold | <100 ppm | chargebacks/margin risk |
Preview the Actual Deliverable
CIE Automotive Porter's Five Forces Analysis
This preview shows the exact CIE Automotive Porter’s Five Forces analysis you’ll receive—no placeholders or excerpts. It is the full, professionally formatted document ready for immediate download after purchase. Use it as-is for strategic review, valuation inputs, or presentation support. What you see here is precisely what will be delivered to you.

From Overview to Strategy Blueprint
CIE Automotive faces mixed competitive pressures: strong supplier relationships and scale advantages temper supplier power, while buyer concentration and aftermarket substitutes elevate competitive intensity and margin risks. Regional diversification and technological capabilities help mitigate threats from new entrants, but cyclical auto demand and raw material volatility remain key vulnerabilities. This snapshot highlights critical forces and strategic implications. Unlock the full Porter's Five Forces Analysis to explore CIE Automotive’s competitive dynamics, market pressures, and strategic advantages in detail.
Suppliers Bargaining Power
Concentrated raw materials (steel, aluminum, resins)
Metals and engineered polymer supply is relatively concentrated—China accounted for about 56% of global crude steel output and roughly 60% of primary aluminum production in 2023—giving large mills and chemical majors leverage on pricing and allocation. Volatile commodity cycles force cost pass-through negotiations; CIE mitigates via multi-sourcing and hedging, but critical grades limit substitution. Long-term contracts stabilize supply, yet surcharges and extended lead times still pressure margins.
Specialized equipment, tooling, and dies dependency
Forging presses, die-casting machines and precision tooling are capital-intensive (equipment often >€1m) and provided by a concentrated set of OEMs, creating supplier leverage; tool lead times commonly run 8–24 weeks, adding switching frictions and schedule risk. Suppliers exert power via maintenance, spare parts and upgrades that affect uptime and margins. CIE (2023 revenue €3.6bn) mitigates exposure with in-house tooling and standardized platforms where feasible.
Energy intensity and utility exposure
Casting, forging and machining are highly energy-intensive, so energy suppliers and market prices materially influence CIE Automotive’s cost base; European industrial power spikes (up to ~4x in 2022) eased to roughly €100/MWh by 2024 (Eurostat), shifting margins and utilization.
Long-term power purchase agreements and capex on electrification and efficiency lower exposure and damp volatility, though decarbonization premiums (roughly +5–15% near-term) can raise supplier leverage.
ESG and specialty inputs constraints
ESG-driven demand for low-carbon aluminium/steel and certified recycled plastics tightens supplier leverage as compliant volumes remain constrained in 2024; OEMs' sustainability targets push qualification upstream, concentrating spend with a smaller pool of vetted vendors and raising scarcity pricing that CIE’s scale and supplier programs mitigate but do not remove.
- Concentration of compliant suppliers
- Upstream qualification cascade
- Certification/traceability dependence
- CIE scale lowers but not eliminates premiums
Logistics and regionalization dynamics
Freight capacity tightness and port congestion in 2024 pushed CIE Automotive toward regional carriers, with nearshoring increasing demand for reliable local logistics; just-in-time production means a single disruption can add 1–3% to production costs. Dual-shore inventories and supplier development reduce exposure, but specialty alloys and tooling still drive cross-border flows, keeping logistics providers' leverage high.
Supplier power: China steel 56%, Al 60%
Supplier power is high due to metals concentration (China ~56% steel, ~60% aluminum in 2023), capital‑intensive tooling (>€1m, 8–24 week lead times) and constrained low‑carbon material supply in 2024; energy swings (≈€100/MWh in 2024) and freight/port delays raise costs. CIE (2023 revenue €3.6bn) mitigates via multi‑sourcing, in‑house tooling and long contracts, but premiums persist.
| Factor | 2023/24 Metric | Impact |
|---|---|---|
| Metals concentration | China steel 56%, Al 60% (2023) | High price/leverage |
| Tooling | >€1m; 8–24w lead | Switching friction |
| Energy | ~€100/MWh (2024) | Cost variability |
| ESG supply | Limited compliant volumes (2024) | Premiums |
What is included in the product
Detailed Word Document
Tailored Porter's Five Forces analysis for CIE Automotive that uncovers key competitive drivers, supplier and buyer power, threat of substitutes and new entrants, and identifies disruptive risks and strategic levers to protect margins.
Customizable Excel Spreadsheet
Concise Porter's Five Forces for CIE Automotive—one-sheet clarity that quickly highlights supplier, buyer, and competitor pressures to remove strategic blind spots; easily customizable to reflect M&A, supply-chain shocks, or new regulations for immediate boardroom use.
Customers Bargaining Power
Highly concentrated OEM buyer base
Global automakers and Tier‑1s form a highly concentrated OEM buyer base that buys in large volumes and runs aggressive competitive sourcing, exerting strong price pressure; vendor scorecards and annual productivity givebacks are standard. Volume leverage forces customers to demand cost transparency and indexation. CIE counters with process excellence, multi‑technology bundling and a global footprint to defend margins.
Design-in and platform lock-in
Once CIE’s parts are validated on a platform, switching mid-cycle is costly for OEMs—PPAP approvals commonly take 6–12 months and tooling amortization typically spans 3–5 years, creating strong inertia that tempers buyer power.
At new award cycles (often every 3–7 years) buyers regain leverage, but superior launch performance and targeted value engineering materially increase CIE’s retention odds.
Quality, delivery, and penalties regime
Strict IATF 16949 and PPAP regimes plus zero-defect expectations let buyers impose chargebacks and expedite costs, directly pressuring suppliers. OTIF targets typically exceed 95% and PPM thresholds often sit below 100 ppm, with misses hitting margins and future contract awards. This extends buyer power beyond price into service-level enforcement. Robust operational excellence and digital traceability are critical defenses.
EV transition reshaping content
Shift to EVs changes component mix, cutting traditional ICE parts and boosting lightweight, thermal management and powertrain electrification components; industry estimates put global BEV+PHEV new-car share at about 18% in 2024, intensifying buyer rebids and supplier consolidation. Early EV co-development can lock CIE into platforms and reduce switching; lagging on EV tech increases buyer substitution risk.
- Buyers leverage transition: rebids, consolidation
- EV mix: more lightweight/thermal parts
- Co-development: reduces switching
- Tech lag: raises substitution options
Global sourcing and should-cost analytics
OEMs run global RFQs using should-cost models that pit regions and processes against each other, increasing transparency and compressing margins on commoditized parts.
Differentiation through complex geometries, automation and verified sustainability data preserves pricing power for suppliers like CIE Automotive.
Local content rules in markets such as North America and the EU moderate buyer leverage by protecting regional sourcing.
- Global RFQs: standardized should-cost models
- Margin pressure: commoditized parts see compression
- Countermeasures: complexity, automation, sustainability
- Regulatory buffer: local content rules reduce leverage
RFQ:OTIF>95%,PPM<100 ppm;EV rebids(18%)
OEMs buy large volumes via global RFQs and should‑costing, driving price transparency and annual productivity demands; OTIF targets >95% and PPM thresholds often <100 ppm pressure supplier margins. Platform validation and lengthy PPAP/tooling cycles create switching inertia, but EV rebids (BEV+PHEV ~18% of new cars in 2024) amplify buyer leverage.
| Metric | 2024 value | Impact |
|---|---|---|
| BEV+PHEV share | ~18% | more rebids, consolidation |
| OTIF target | >95% | service-level enforcement |
| PPM threshold | <100 ppm | chargebacks/margin risk |
Preview the Actual Deliverable
CIE Automotive Porter's Five Forces Analysis
This preview shows the exact CIE Automotive Porter’s Five Forces analysis you’ll receive—no placeholders or excerpts. It is the full, professionally formatted document ready for immediate download after purchase. Use it as-is for strategic review, valuation inputs, or presentation support. What you see here is precisely what will be delivered to you.
Description
From Overview to Strategy Blueprint
CIE Automotive faces mixed competitive pressures: strong supplier relationships and scale advantages temper supplier power, while buyer concentration and aftermarket substitutes elevate competitive intensity and margin risks. Regional diversification and technological capabilities help mitigate threats from new entrants, but cyclical auto demand and raw material volatility remain key vulnerabilities. This snapshot highlights critical forces and strategic implications. Unlock the full Porter's Five Forces Analysis to explore CIE Automotive’s competitive dynamics, market pressures, and strategic advantages in detail.
Suppliers Bargaining Power
Concentrated raw materials (steel, aluminum, resins)
Metals and engineered polymer supply is relatively concentrated—China accounted for about 56% of global crude steel output and roughly 60% of primary aluminum production in 2023—giving large mills and chemical majors leverage on pricing and allocation. Volatile commodity cycles force cost pass-through negotiations; CIE mitigates via multi-sourcing and hedging, but critical grades limit substitution. Long-term contracts stabilize supply, yet surcharges and extended lead times still pressure margins.
Specialized equipment, tooling, and dies dependency
Forging presses, die-casting machines and precision tooling are capital-intensive (equipment often >€1m) and provided by a concentrated set of OEMs, creating supplier leverage; tool lead times commonly run 8–24 weeks, adding switching frictions and schedule risk. Suppliers exert power via maintenance, spare parts and upgrades that affect uptime and margins. CIE (2023 revenue €3.6bn) mitigates exposure with in-house tooling and standardized platforms where feasible.
Energy intensity and utility exposure
Casting, forging and machining are highly energy-intensive, so energy suppliers and market prices materially influence CIE Automotive’s cost base; European industrial power spikes (up to ~4x in 2022) eased to roughly €100/MWh by 2024 (Eurostat), shifting margins and utilization.
Long-term power purchase agreements and capex on electrification and efficiency lower exposure and damp volatility, though decarbonization premiums (roughly +5–15% near-term) can raise supplier leverage.
ESG and specialty inputs constraints
ESG-driven demand for low-carbon aluminium/steel and certified recycled plastics tightens supplier leverage as compliant volumes remain constrained in 2024; OEMs' sustainability targets push qualification upstream, concentrating spend with a smaller pool of vetted vendors and raising scarcity pricing that CIE’s scale and supplier programs mitigate but do not remove.
- Concentration of compliant suppliers
- Upstream qualification cascade
- Certification/traceability dependence
- CIE scale lowers but not eliminates premiums
Logistics and regionalization dynamics
Freight capacity tightness and port congestion in 2024 pushed CIE Automotive toward regional carriers, with nearshoring increasing demand for reliable local logistics; just-in-time production means a single disruption can add 1–3% to production costs. Dual-shore inventories and supplier development reduce exposure, but specialty alloys and tooling still drive cross-border flows, keeping logistics providers' leverage high.
Supplier power: China steel 56%, Al 60%
Supplier power is high due to metals concentration (China ~56% steel, ~60% aluminum in 2023), capital‑intensive tooling (>€1m, 8–24 week lead times) and constrained low‑carbon material supply in 2024; energy swings (≈€100/MWh in 2024) and freight/port delays raise costs. CIE (2023 revenue €3.6bn) mitigates via multi‑sourcing, in‑house tooling and long contracts, but premiums persist.
| Factor | 2023/24 Metric | Impact |
|---|---|---|
| Metals concentration | China steel 56%, Al 60% (2023) | High price/leverage |
| Tooling | >€1m; 8–24w lead | Switching friction |
| Energy | ~€100/MWh (2024) | Cost variability |
| ESG supply | Limited compliant volumes (2024) | Premiums |
What is included in the product
Detailed Word Document
Tailored Porter's Five Forces analysis for CIE Automotive that uncovers key competitive drivers, supplier and buyer power, threat of substitutes and new entrants, and identifies disruptive risks and strategic levers to protect margins.
Customizable Excel Spreadsheet
Concise Porter's Five Forces for CIE Automotive—one-sheet clarity that quickly highlights supplier, buyer, and competitor pressures to remove strategic blind spots; easily customizable to reflect M&A, supply-chain shocks, or new regulations for immediate boardroom use.
Customers Bargaining Power
Highly concentrated OEM buyer base
Global automakers and Tier‑1s form a highly concentrated OEM buyer base that buys in large volumes and runs aggressive competitive sourcing, exerting strong price pressure; vendor scorecards and annual productivity givebacks are standard. Volume leverage forces customers to demand cost transparency and indexation. CIE counters with process excellence, multi‑technology bundling and a global footprint to defend margins.
Design-in and platform lock-in
Once CIE’s parts are validated on a platform, switching mid-cycle is costly for OEMs—PPAP approvals commonly take 6–12 months and tooling amortization typically spans 3–5 years, creating strong inertia that tempers buyer power.
At new award cycles (often every 3–7 years) buyers regain leverage, but superior launch performance and targeted value engineering materially increase CIE’s retention odds.
Quality, delivery, and penalties regime
Strict IATF 16949 and PPAP regimes plus zero-defect expectations let buyers impose chargebacks and expedite costs, directly pressuring suppliers. OTIF targets typically exceed 95% and PPM thresholds often sit below 100 ppm, with misses hitting margins and future contract awards. This extends buyer power beyond price into service-level enforcement. Robust operational excellence and digital traceability are critical defenses.
EV transition reshaping content
Shift to EVs changes component mix, cutting traditional ICE parts and boosting lightweight, thermal management and powertrain electrification components; industry estimates put global BEV+PHEV new-car share at about 18% in 2024, intensifying buyer rebids and supplier consolidation. Early EV co-development can lock CIE into platforms and reduce switching; lagging on EV tech increases buyer substitution risk.
- Buyers leverage transition: rebids, consolidation
- EV mix: more lightweight/thermal parts
- Co-development: reduces switching
- Tech lag: raises substitution options
Global sourcing and should-cost analytics
OEMs run global RFQs using should-cost models that pit regions and processes against each other, increasing transparency and compressing margins on commoditized parts.
Differentiation through complex geometries, automation and verified sustainability data preserves pricing power for suppliers like CIE Automotive.
Local content rules in markets such as North America and the EU moderate buyer leverage by protecting regional sourcing.
- Global RFQs: standardized should-cost models
- Margin pressure: commoditized parts see compression
- Countermeasures: complexity, automation, sustainability
- Regulatory buffer: local content rules reduce leverage
RFQ:OTIF>95%,PPM<100 ppm;EV rebids(18%)
OEMs buy large volumes via global RFQs and should‑costing, driving price transparency and annual productivity demands; OTIF targets >95% and PPM thresholds often <100 ppm pressure supplier margins. Platform validation and lengthy PPAP/tooling cycles create switching inertia, but EV rebids (BEV+PHEV ~18% of new cars in 2024) amplify buyer leverage.
| Metric | 2024 value | Impact |
|---|---|---|
| BEV+PHEV share | ~18% | more rebids, consolidation |
| OTIF target | >95% | service-level enforcement |
| PPM threshold | <100 ppm | chargebacks/margin risk |
Preview the Actual Deliverable
CIE Automotive Porter's Five Forces Analysis
This preview shows the exact CIE Automotive Porter’s Five Forces analysis you’ll receive—no placeholders or excerpts. It is the full, professionally formatted document ready for immediate download after purchase. Use it as-is for strategic review, valuation inputs, or presentation support. What you see here is precisely what will be delivered to you.











