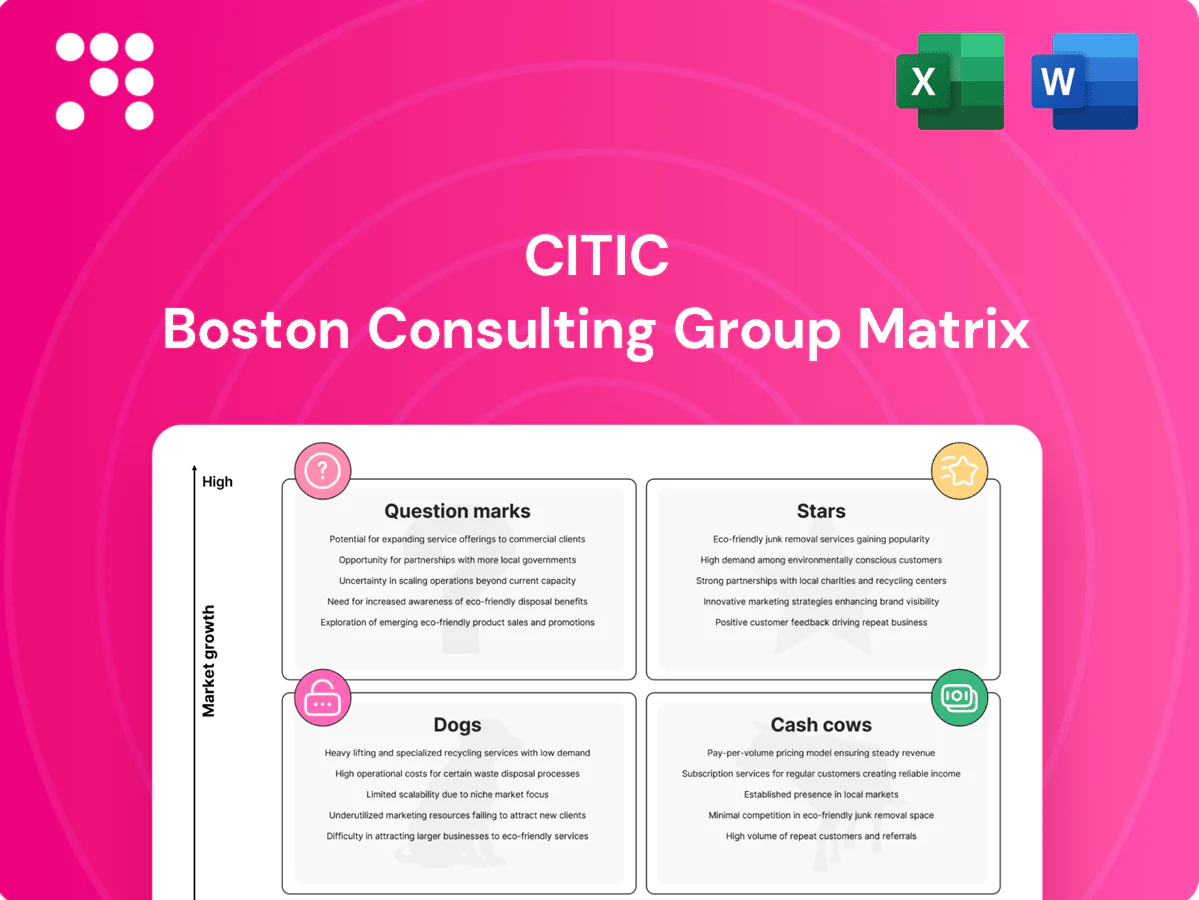
CITIC Boston Consulting Group Matrix

Actionable Strategy Starts Here
Curious where CITIC’s businesses sit—Stars, Cash Cows, Dogs, or Question Marks? This quick look teases the shape of their portfolio, but the full CITIC BCG Matrix gives quadrant-by-quadrant placements, data-backed recommendations, and practical moves you can act on. Purchase the complete report for a ready-to-use Word analysis plus an Excel summary—skip the guesswork and get a clear roadmap for where to invest, divest, or defend next.
Stars

CITIC Securities leadership
China’s capital markets continue expanding—A‑share market cap topped about USD 11 trillion in 2024—placing CITIC Securities at or near the top of brokerage, ECM and advisory league tables; high growth, visibility and elevated spend on talent and tech drive volume, but cash in equals cash out as they underwrite new issuance cycles and capture institutional flows; this is a classic BCG Star that can mature into a cash cow.
Aluminum wheels (Dicastal) scale
CITIC Dicastal leads the aluminum wheel category as OEM demand for lightweighting accelerates, with EVs accounting for roughly 14% of global new car sales in 2023 and pushing strong volume growth across EV platforms. Capacity expansion, automation and multi‑region plants are capital‑intensive and have tightened cash flow despite attractive margins. Market share remains defensible through proprietary tech and entrenched OEM relationships, so continued investment is required to stay first in line as EV penetration climbs.

Belt & Road engineering wins
Selective Belt & Road EPC wins are surging as CITIC pairs project financing with EPC, converting new awards into backlog growth while execution intensifies working capital and bonding use.
Share is strong in targeted corridors and CITICs reputation keeps opening doors; prudent bidding and funded project controls are essential to turn volume into durable returns.

Resources trading & logistics
Resources trading & logistics sits in Stars as commodity flows tied to steel, energy and base metals expand with China+ outbound demand; 2024 YTD seaborne iron ore and oil trade lifted volumes ~5–7% regionally, and CITIC’s integrated sourcing, shipping and risk-management gives it heft and market share.
It scales fast but requires capex in systems and inventory buffers; unit economics suggest >$10bn annual throughput to monetize network effects, producing strategic influence now and cash generation later.
- China+ demand growth: 2024 YTD up ~5–7%
- CITIC advantage: integrated sourcing, shipping, risk management
- Need: systems upgrades and inventory buffers
- Payoff: influence now, cash later; scale target >$10bn throughput
Renewables platforms
Renewables platforms are Stars: wind, solar and storage pipelines are scaling rapidly from a low base as policy tailwinds and grid upgrades drive volumes; early projects set cost curves and contracting standards, with 2024 battery-pack cost ~142 USD/kWh (BNEF) and utility-scale solar capex ~600k USD/MW, so fund aggressively while securing offtake and O&M edge to cement leadership.
- High capex: onshore wind ~1.2m USD/MW; solar ~600k USD/MW; storage pack ~142 USD/kWh (2024)
- Growth: accelerating pipelines driven by policy and grid upgrades
- Strategy: aggressive funding + offtake/O&M to lock market share
Securities, EV supply, resources & renewables — focus on funding, scale, underwriting cash
CITIC Stars: Securities—China A‑share cap ~USD 11T in 2024, leading ECM/advisory but underwriting keeps cash neutral. Dicastal—EVs ~14% of global new car sales (2023), high margin but capex‑heavy for capacity/automation. Resources—seaborne flows +5–7% 2024 YTD; scale needed >USD10bn throughput. Renewables—battery ~$142 USD/kWh, solar ~$600k USD/MW, wind ~$1.2m USD/MW; aggressive funding + offtake/O&M required.
| Business | 2024/2023 metric | Key need |
|---|---|---|
| Securities | A‑share cap ~USD11T (2024) | Manage underwriting cash |
| Dicastal | EV share ~14% (2023) | Capex for automation |
| Resources | Flows +5–7% (2024 YTD) | Scale to >USD10bn |
| Renewables | Battery ~$142/kWh; solar ~$600k/MW | Secure offtake/O&M |
What is included in the product
 Detailed Word Document
In-depth CITIC BCG Matrix review: quadrant-wise insights on Stars, Cash Cows, Question Marks, Dogs with investment, risk and trend guidance.

 Customizable Excel Spreadsheet
One-page CITIC BCG Matrix highlighting growth vs share to stop guesswork and speed C-level decisions.
Cash Cows

CITIC Bank core retail
CITIC Bank core retail is a mature business with a wide customer base and a strong deposit franchise; as of 2024 retail deposits exceeded RMB 2 trillion, underpinning stable funding. Growth is steady, not spectacular, with low single-digit retail loan growth in 2024 while cost-of-funds advantages sustain spreads. It needs modest marketing and digital upkeep versus Stars and serves as a reliable cash generator to fund strategic bets elsewhere.
Corporate lending franchise
Corporate lending franchise leverages deep SOE and large-cap relationships, with corporate loans representing roughly 58% of CITIC's loan book in 2024, producing stable fee and interest income. Growth is low but market share is high in defined niches such as infrastructure and state-linked corporates. Strong credit discipline and pricing power sustain net interest margin near 1.9% in 2024, keeping margins decent. Maintain strict risk controls and harvest cash via steady dividend and loan repayments.

Investment property rents
Stabilized office and industrial assets in China tier‑one cities generated predictable NOI, with average prime office occupancy around 85% in 2024 and rental income contributing a steady share of CITIC’s recurring revenue. Growth is limited, with mid-single-digit rent uplifts typical, while disciplined lease rolls and active occupancy management sustain cash yields near historical levels. Capex remains largely maintenance-driven; management strategy is to milk the portfolio and recycle assets only when risk‑adjusted spreads widen materially.

Special steel & materials
Special steel & materials serve established downstream niches where technical specs drive repeat orders and contract lifecycles; volumes are steady in a mature market and most mills show heavily depreciated assets, enabling margin gains from efficiency rather than capex.
Small efficiency tweaks (process optimization, scrap recovery) can lift EBITDA margins by several percentage points while keeping capital spend low; keep mills tight and convert operating cash into the balance sheet.
- Repeat orders dominate sales mix; niche specs sustain pricing
- Market maturity → steady volumes, low growth
- Plants largely depreciated → low replacement capex
- Efficiency gains = margin upside; prioritize cash preservation
Leasing and factoring
Leasing and factoring at CITIC function as asset-backed, repeat-client cash cows with controlled credit risk; portfolio turns and fee income remained stable in 2024 while growth stayed measured, supporting predictable cash generation.
Operational systems and light incremental capex sustain low marginal costs; surplus cash is deployed selectively to underwrite higher-upside investments further up the BCG matrix.
- Asset-backed, repeat clients
- Stable fee income, measured growth (2024)
- Low incremental capex, mature systems
- Cash redeployed to higher-upside plays
Cash-generating core: retail deposits RMB 2.0tn+, corp loans ~58%
CITIC cash cows—core retail, corporate lending, stabilized real estate, steel and leasing—generated steady cash in 2024: retail deposits >RMB 2tn; corporate loans ~58% of book; NIM ~1.9%; prime office occupancy ~85%. Low growth, low incremental capex, high cash conversion; surplus redeployed to higher‑growth bets.
| Item | 2024 |
|---|---|
| Retail deposits | RMB 2.0tn+ |
| Corp loans (% book) | ~58% |
| NIM | ~1.9% |
| Office occ. | ~85% |
What You See Is What You Get
CITIC BCG Matrix
The file you're previewing here is the exact CITIC BCG Matrix you'll receive after purchase — no watermarks, no placeholders, just the finished, fully formatted report. Built by strategy pros for clear decision-making, it arrives ready to edit, print, or present. Buy once and download immediately; what you see is what you get, delivered straight to your inbox with no surprises.

Actionable Strategy Starts Here
Curious where CITIC’s businesses sit—Stars, Cash Cows, Dogs, or Question Marks? This quick look teases the shape of their portfolio, but the full CITIC BCG Matrix gives quadrant-by-quadrant placements, data-backed recommendations, and practical moves you can act on. Purchase the complete report for a ready-to-use Word analysis plus an Excel summary—skip the guesswork and get a clear roadmap for where to invest, divest, or defend next.
Stars
CITIC Securities leadership
China’s capital markets continue expanding—A‑share market cap topped about USD 11 trillion in 2024—placing CITIC Securities at or near the top of brokerage, ECM and advisory league tables; high growth, visibility and elevated spend on talent and tech drive volume, but cash in equals cash out as they underwrite new issuance cycles and capture institutional flows; this is a classic BCG Star that can mature into a cash cow.
Aluminum wheels (Dicastal) scale
CITIC Dicastal leads the aluminum wheel category as OEM demand for lightweighting accelerates, with EVs accounting for roughly 14% of global new car sales in 2023 and pushing strong volume growth across EV platforms. Capacity expansion, automation and multi‑region plants are capital‑intensive and have tightened cash flow despite attractive margins. Market share remains defensible through proprietary tech and entrenched OEM relationships, so continued investment is required to stay first in line as EV penetration climbs.
Belt & Road engineering wins
Selective Belt & Road EPC wins are surging as CITIC pairs project financing with EPC, converting new awards into backlog growth while execution intensifies working capital and bonding use.
Share is strong in targeted corridors and CITICs reputation keeps opening doors; prudent bidding and funded project controls are essential to turn volume into durable returns.
Resources trading & logistics
Resources trading & logistics sits in Stars as commodity flows tied to steel, energy and base metals expand with China+ outbound demand; 2024 YTD seaborne iron ore and oil trade lifted volumes ~5–7% regionally, and CITIC’s integrated sourcing, shipping and risk-management gives it heft and market share.
It scales fast but requires capex in systems and inventory buffers; unit economics suggest >$10bn annual throughput to monetize network effects, producing strategic influence now and cash generation later.
- China+ demand growth: 2024 YTD up ~5–7%
- CITIC advantage: integrated sourcing, shipping, risk management
- Need: systems upgrades and inventory buffers
- Payoff: influence now, cash later; scale target >$10bn throughput
Renewables platforms
Renewables platforms are Stars: wind, solar and storage pipelines are scaling rapidly from a low base as policy tailwinds and grid upgrades drive volumes; early projects set cost curves and contracting standards, with 2024 battery-pack cost ~142 USD/kWh (BNEF) and utility-scale solar capex ~600k USD/MW, so fund aggressively while securing offtake and O&M edge to cement leadership.
- High capex: onshore wind ~1.2m USD/MW; solar ~600k USD/MW; storage pack ~142 USD/kWh (2024)
- Growth: accelerating pipelines driven by policy and grid upgrades
- Strategy: aggressive funding + offtake/O&M to lock market share
Securities, EV supply, resources & renewables — focus on funding, scale, underwriting cash
CITIC Stars: Securities—China A‑share cap ~USD 11T in 2024, leading ECM/advisory but underwriting keeps cash neutral. Dicastal—EVs ~14% of global new car sales (2023), high margin but capex‑heavy for capacity/automation. Resources—seaborne flows +5–7% 2024 YTD; scale needed >USD10bn throughput. Renewables—battery ~$142 USD/kWh, solar ~$600k USD/MW, wind ~$1.2m USD/MW; aggressive funding + offtake/O&M required.
| Business | 2024/2023 metric | Key need |
|---|---|---|
| Securities | A‑share cap ~USD11T (2024) | Manage underwriting cash |
| Dicastal | EV share ~14% (2023) | Capex for automation |
| Resources | Flows +5–7% (2024 YTD) | Scale to >USD10bn |
| Renewables | Battery ~$142/kWh; solar ~$600k/MW | Secure offtake/O&M |
What is included in the product
Detailed Word Document
In-depth CITIC BCG Matrix review: quadrant-wise insights on Stars, Cash Cows, Question Marks, Dogs with investment, risk and trend guidance.
Customizable Excel Spreadsheet
One-page CITIC BCG Matrix highlighting growth vs share to stop guesswork and speed C-level decisions.
Cash Cows
CITIC Bank core retail
CITIC Bank core retail is a mature business with a wide customer base and a strong deposit franchise; as of 2024 retail deposits exceeded RMB 2 trillion, underpinning stable funding. Growth is steady, not spectacular, with low single-digit retail loan growth in 2024 while cost-of-funds advantages sustain spreads. It needs modest marketing and digital upkeep versus Stars and serves as a reliable cash generator to fund strategic bets elsewhere.
Corporate lending franchise
Corporate lending franchise leverages deep SOE and large-cap relationships, with corporate loans representing roughly 58% of CITIC's loan book in 2024, producing stable fee and interest income. Growth is low but market share is high in defined niches such as infrastructure and state-linked corporates. Strong credit discipline and pricing power sustain net interest margin near 1.9% in 2024, keeping margins decent. Maintain strict risk controls and harvest cash via steady dividend and loan repayments.
Investment property rents
Stabilized office and industrial assets in China tier‑one cities generated predictable NOI, with average prime office occupancy around 85% in 2024 and rental income contributing a steady share of CITIC’s recurring revenue. Growth is limited, with mid-single-digit rent uplifts typical, while disciplined lease rolls and active occupancy management sustain cash yields near historical levels. Capex remains largely maintenance-driven; management strategy is to milk the portfolio and recycle assets only when risk‑adjusted spreads widen materially.
Special steel & materials
Special steel & materials serve established downstream niches where technical specs drive repeat orders and contract lifecycles; volumes are steady in a mature market and most mills show heavily depreciated assets, enabling margin gains from efficiency rather than capex.
Small efficiency tweaks (process optimization, scrap recovery) can lift EBITDA margins by several percentage points while keeping capital spend low; keep mills tight and convert operating cash into the balance sheet.
- Repeat orders dominate sales mix; niche specs sustain pricing
- Market maturity → steady volumes, low growth
- Plants largely depreciated → low replacement capex
- Efficiency gains = margin upside; prioritize cash preservation
Leasing and factoring
Leasing and factoring at CITIC function as asset-backed, repeat-client cash cows with controlled credit risk; portfolio turns and fee income remained stable in 2024 while growth stayed measured, supporting predictable cash generation.
Operational systems and light incremental capex sustain low marginal costs; surplus cash is deployed selectively to underwrite higher-upside investments further up the BCG matrix.
- Asset-backed, repeat clients
- Stable fee income, measured growth (2024)
- Low incremental capex, mature systems
- Cash redeployed to higher-upside plays
Cash-generating core: retail deposits RMB 2.0tn+, corp loans ~58%
CITIC cash cows—core retail, corporate lending, stabilized real estate, steel and leasing—generated steady cash in 2024: retail deposits >RMB 2tn; corporate loans ~58% of book; NIM ~1.9%; prime office occupancy ~85%. Low growth, low incremental capex, high cash conversion; surplus redeployed to higher‑growth bets.
| Item | 2024 |
|---|---|
| Retail deposits | RMB 2.0tn+ |
| Corp loans (% book) | ~58% |
| NIM | ~1.9% |
| Office occ. | ~85% |
What You See Is What You Get
CITIC BCG Matrix
The file you're previewing here is the exact CITIC BCG Matrix you'll receive after purchase — no watermarks, no placeholders, just the finished, fully formatted report. Built by strategy pros for clear decision-making, it arrives ready to edit, print, or present. Buy once and download immediately; what you see is what you get, delivered straight to your inbox with no surprises.
Original: $10.00
-65%$10.00
$3.50Description
Actionable Strategy Starts Here
Curious where CITIC’s businesses sit—Stars, Cash Cows, Dogs, or Question Marks? This quick look teases the shape of their portfolio, but the full CITIC BCG Matrix gives quadrant-by-quadrant placements, data-backed recommendations, and practical moves you can act on. Purchase the complete report for a ready-to-use Word analysis plus an Excel summary—skip the guesswork and get a clear roadmap for where to invest, divest, or defend next.
Stars
CITIC Securities leadership
China’s capital markets continue expanding—A‑share market cap topped about USD 11 trillion in 2024—placing CITIC Securities at or near the top of brokerage, ECM and advisory league tables; high growth, visibility and elevated spend on talent and tech drive volume, but cash in equals cash out as they underwrite new issuance cycles and capture institutional flows; this is a classic BCG Star that can mature into a cash cow.
Aluminum wheels (Dicastal) scale
CITIC Dicastal leads the aluminum wheel category as OEM demand for lightweighting accelerates, with EVs accounting for roughly 14% of global new car sales in 2023 and pushing strong volume growth across EV platforms. Capacity expansion, automation and multi‑region plants are capital‑intensive and have tightened cash flow despite attractive margins. Market share remains defensible through proprietary tech and entrenched OEM relationships, so continued investment is required to stay first in line as EV penetration climbs.
Belt & Road engineering wins
Selective Belt & Road EPC wins are surging as CITIC pairs project financing with EPC, converting new awards into backlog growth while execution intensifies working capital and bonding use.
Share is strong in targeted corridors and CITICs reputation keeps opening doors; prudent bidding and funded project controls are essential to turn volume into durable returns.
Resources trading & logistics
Resources trading & logistics sits in Stars as commodity flows tied to steel, energy and base metals expand with China+ outbound demand; 2024 YTD seaborne iron ore and oil trade lifted volumes ~5–7% regionally, and CITIC’s integrated sourcing, shipping and risk-management gives it heft and market share.
It scales fast but requires capex in systems and inventory buffers; unit economics suggest >$10bn annual throughput to monetize network effects, producing strategic influence now and cash generation later.
- China+ demand growth: 2024 YTD up ~5–7%
- CITIC advantage: integrated sourcing, shipping, risk management
- Need: systems upgrades and inventory buffers
- Payoff: influence now, cash later; scale target >$10bn throughput
Renewables platforms
Renewables platforms are Stars: wind, solar and storage pipelines are scaling rapidly from a low base as policy tailwinds and grid upgrades drive volumes; early projects set cost curves and contracting standards, with 2024 battery-pack cost ~142 USD/kWh (BNEF) and utility-scale solar capex ~600k USD/MW, so fund aggressively while securing offtake and O&M edge to cement leadership.
- High capex: onshore wind ~1.2m USD/MW; solar ~600k USD/MW; storage pack ~142 USD/kWh (2024)
- Growth: accelerating pipelines driven by policy and grid upgrades
- Strategy: aggressive funding + offtake/O&M to lock market share
Securities, EV supply, resources & renewables — focus on funding, scale, underwriting cash
CITIC Stars: Securities—China A‑share cap ~USD 11T in 2024, leading ECM/advisory but underwriting keeps cash neutral. Dicastal—EVs ~14% of global new car sales (2023), high margin but capex‑heavy for capacity/automation. Resources—seaborne flows +5–7% 2024 YTD; scale needed >USD10bn throughput. Renewables—battery ~$142 USD/kWh, solar ~$600k USD/MW, wind ~$1.2m USD/MW; aggressive funding + offtake/O&M required.
| Business | 2024/2023 metric | Key need |
|---|---|---|
| Securities | A‑share cap ~USD11T (2024) | Manage underwriting cash |
| Dicastal | EV share ~14% (2023) | Capex for automation |
| Resources | Flows +5–7% (2024 YTD) | Scale to >USD10bn |
| Renewables | Battery ~$142/kWh; solar ~$600k/MW | Secure offtake/O&M |
What is included in the product
Detailed Word Document
In-depth CITIC BCG Matrix review: quadrant-wise insights on Stars, Cash Cows, Question Marks, Dogs with investment, risk and trend guidance.
Customizable Excel Spreadsheet
One-page CITIC BCG Matrix highlighting growth vs share to stop guesswork and speed C-level decisions.
Cash Cows
CITIC Bank core retail
CITIC Bank core retail is a mature business with a wide customer base and a strong deposit franchise; as of 2024 retail deposits exceeded RMB 2 trillion, underpinning stable funding. Growth is steady, not spectacular, with low single-digit retail loan growth in 2024 while cost-of-funds advantages sustain spreads. It needs modest marketing and digital upkeep versus Stars and serves as a reliable cash generator to fund strategic bets elsewhere.
Corporate lending franchise
Corporate lending franchise leverages deep SOE and large-cap relationships, with corporate loans representing roughly 58% of CITIC's loan book in 2024, producing stable fee and interest income. Growth is low but market share is high in defined niches such as infrastructure and state-linked corporates. Strong credit discipline and pricing power sustain net interest margin near 1.9% in 2024, keeping margins decent. Maintain strict risk controls and harvest cash via steady dividend and loan repayments.
Investment property rents
Stabilized office and industrial assets in China tier‑one cities generated predictable NOI, with average prime office occupancy around 85% in 2024 and rental income contributing a steady share of CITIC’s recurring revenue. Growth is limited, with mid-single-digit rent uplifts typical, while disciplined lease rolls and active occupancy management sustain cash yields near historical levels. Capex remains largely maintenance-driven; management strategy is to milk the portfolio and recycle assets only when risk‑adjusted spreads widen materially.
Special steel & materials
Special steel & materials serve established downstream niches where technical specs drive repeat orders and contract lifecycles; volumes are steady in a mature market and most mills show heavily depreciated assets, enabling margin gains from efficiency rather than capex.
Small efficiency tweaks (process optimization, scrap recovery) can lift EBITDA margins by several percentage points while keeping capital spend low; keep mills tight and convert operating cash into the balance sheet.
- Repeat orders dominate sales mix; niche specs sustain pricing
- Market maturity → steady volumes, low growth
- Plants largely depreciated → low replacement capex
- Efficiency gains = margin upside; prioritize cash preservation
Leasing and factoring
Leasing and factoring at CITIC function as asset-backed, repeat-client cash cows with controlled credit risk; portfolio turns and fee income remained stable in 2024 while growth stayed measured, supporting predictable cash generation.
Operational systems and light incremental capex sustain low marginal costs; surplus cash is deployed selectively to underwrite higher-upside investments further up the BCG matrix.
- Asset-backed, repeat clients
- Stable fee income, measured growth (2024)
- Low incremental capex, mature systems
- Cash redeployed to higher-upside plays
Cash-generating core: retail deposits RMB 2.0tn+, corp loans ~58%
CITIC cash cows—core retail, corporate lending, stabilized real estate, steel and leasing—generated steady cash in 2024: retail deposits >RMB 2tn; corporate loans ~58% of book; NIM ~1.9%; prime office occupancy ~85%. Low growth, low incremental capex, high cash conversion; surplus redeployed to higher‑growth bets.
| Item | 2024 |
|---|---|
| Retail deposits | RMB 2.0tn+ |
| Corp loans (% book) | ~58% |
| NIM | ~1.9% |
| Office occ. | ~85% |
What You See Is What You Get
CITIC BCG Matrix
The file you're previewing here is the exact CITIC BCG Matrix you'll receive after purchase — no watermarks, no placeholders, just the finished, fully formatted report. Built by strategy pros for clear decision-making, it arrives ready to edit, print, or present. Buy once and download immediately; what you see is what you get, delivered straight to your inbox with no surprises.











