CJ ENM Porter's Five Forces Analysis

Don't Miss the Bigger Picture
CJ ENM faces intense buyer power and growing digital substitutes, while content scale and distribution partnerships mitigate supplier threats; entry barriers are moderate but innovation and regulation shape competitive intensity. This brief snapshot only scratches the surface. Unlock the full Porter's Five Forces Analysis to explore CJ ENM’s competitive dynamics in detail.
Suppliers Bargaining Power

Star talent leverage
Top actors, directors, idols and showrunners command premium fees and significant creative control, with leading talent reportedly earning up to KRW 1–2 billion (~$800k–$1.6M) per project, strengthening supplier leverage. Hit-driven dynamics and platform competition amplify negotiating power, while exclusivity demands and schedule bottlenecks can delay slates. CJ ENM mitigates this by signing multi-project deals and expanding in-house development to secure pipelines and reduce single-talent risk.
Agency and label concentration
Major Korean agencies—HYBE, SM, YG, JYP and others—aggregate bargaining power with bundled rosters and extensive IP libraries, raising switching costs for distributors and platforms. Conflicts over revenue splits for global rights remain frequent, especially as licensors push for larger backend shares. Long-term partnerships and co-investments with firms like CJ ENM temper volatility and preserve access to marquee talent.

Production vendors and studios
Specialized VFX, post-production and high-end crews were capacity-constrained in 2024 with industry utilization near 90%, pushing peak-cycle rate hikes of 20–40% and longer timelines. Quality differentiation limits substitution, while CJ ENM’s vertical integration and preferred-vendor programs cut average lead times about 15% and stabilized supply.

Music and format IP holders
Music and format IP holders extract royalties and minimum guarantees; the global music publishing market reached about $8.2 billion in 2024, pushing licensors to demand >10–20% of production upside or sizable MGs. Proven IP lowers commissioning risk, justifying higher terms and making renewals dependent on international performance and ratings. CJ ENM offsets supplier power by investing in original IP and in-house format development to dilute dependence.
- royalties and MGs pressure margins
- proven IP = higher license terms
- renewals tied to international traction
- CJ ENM builds original IP to reduce supplier leverage
Tech and distribution infrastructure
Cloud, CDN and ad-tech providers materially shape delivery cost and quality; public cloud spending reached about 600 billion USD in 2024 and the CDN market was ~21 billion USD in 2024, directly influencing latency and unit delivery costs.
Provider fragmentation and integration complexity across regions increase switching friction and operational overhead for CJ ENM, raising migration cost and time.
Data access and licensing terms constrain ad and content monetization; ad-tech take rates commonly range 10–30%, while multi-vendor architectures and owned platforms reduce vendor lock-in.
- Cloud market 2024 ~600B USD
- CDN market 2024 ~21B USD
- Ad-tech fees ~10–30%
- Multi-vendor + owned infra = lower lock-in
Talent, VFX & music royalties concentrate supplier power; vertical integration and bundles cut costs
Top talent fees (KRW 1–2bn/project) and agency bundling concentrate supplier power; VFX utilization ~90% drove 20–40% rate spikes in 2024; music publishing ~$8.2B (2024) pushes >10–20% license takes; cloud ~$600B and CDN ~$21B (2024) set delivery costs. CJ ENM uses multi-project deals, in-house IP and vertical integration to reduce supplier leverage.
| Supplier | 2024 metric | Impact | Response |
|---|---|---|---|
| Talent/agencies | KRW 1–2bn | High fees, exclusivity | Multi-project deals |
| VFX/crew | Utilization ~90% | 20–40% rate spike | Preferred vendors |
| Music/IP | $8.2B | 10–20% royalties | Original IP |
| Cloud/CDN | $600B/$21B | Delivery costs | Owned infra |
What is included in the product
 Detailed Word Document
Comprehensive Porter's Five Forces analysis for CJ ENM that uncovers competitive drivers, supplier and buyer power, threat of entrants and substitutes, and strategic barriers protecting its media and entertainment market position, highlighting disruptive trends and implications for pricing and profitability.

 Customizable Excel Spreadsheet
A clear one-sheet summary of CJ ENM's five forces—perfect for quick strategic decisions; swap in your own data, duplicate tabs for pre/post scenarios, and customize pressure levels without macros for easy boardroom-ready insights.
Customers Bargaining Power

Global streamers’ clout
Platforms like Netflix, with roughly 260 million subscribers in 2024, wield significant scale in licensing negotiations and press for broader rights and cost-sharing. They use visibility boosts to extract concessions, often linking slate placement to fees. Global OTTs invested over $70 billion in content in 2023, increasing bargaining leverage. CJ ENM's diversified portfolio reduces single-buyer exposure, mitigating this pressure.
Domestic broadcasters and telcos
Domestic broadcasters and telcos (KT, SKT, LG U+) collectively control over 90% of pay-TV distribution, making them key slot and carriage buyers. Competitive bidding often favors CJ ENM hits, allowing premium placement, but price sensitivity remains strong among operators and consumers. Bundling channels and extensive content libraries raises CJ ENMs leverage and ARPU potential, while Korea Communications Commission rules on carriage and exclusivity constrain contract terms.

Advertisers and sponsors
Advertisers and sponsors push CJ ENM for measurable ROI and brand-safe placements, with global ad spend reaching about US$833bn in 2024, raising scrutiny on attribution and viewability. Cyclical ad budgets create heightened pricing pressure during downturns, compressing CPMs and margins. Branded content yields higher margins but demands creative and scheduling flexibility. Data-driven targeting lifts yield and retention by improving conversion efficiency and campaign repeatability.

Fans and end-consumers
Fans show low churn for strong IP but can switch apps easily, making platform convenience critical; price hikes provoke immediate backlash, as seen in streaming markets where retention hinges on perceived value. Quality, timely releases, and community engagement drive stickiness, while merch, concerts and fandom perks reduce price elasticity and increase lifetime value.
- Low churn for hit IP
- Easy app switching
- Price-sensitive, reacts fast
- Engagement + events raise LTV
International distributors
International distributors push for exclusive windows and localized versions, driving CJ ENM to include stricter localization support in contracts; currency volatility and compliance risks often force hedged, milestone-based deal structures. Distributors demand performance clauses and step-up pricing tied to viewership or revenue thresholds, while co-production models are used to align incentives and reduce upfront financing pressure.
- Exclusive windows required
- Hedged, milestone payments
- Performance clauses common
- Co-production reduces upfront risk
Scale OTTs' content leverage vs pay-TV carriage pressure: advertisers demand ROI, fans switch fast
Scale buyers (Netflix ~260M subs in 2024) and global OTTs (>$70bn content spend in 2023) exert strong licensing leverage; domestic pay-TV operators (90%+ distribution) push hard on carriage fees. Advertisers (global ad spend ~$833bn in 2024) demand measurable ROI, while fans show low churn for hit IP but can switch apps quickly.
| Customer | Metric | Impact |
|---|---|---|
| Global OTTs | 260M subs / $70bn spend | High licensing leverage |
| Domestic operators | 90%+ distribution | Carriage pressure |
| Advertisers | $833bn ad spend | ROI-driven pricing |
What You See Is What You Get
CJ ENM Porter's Five Forces Analysis
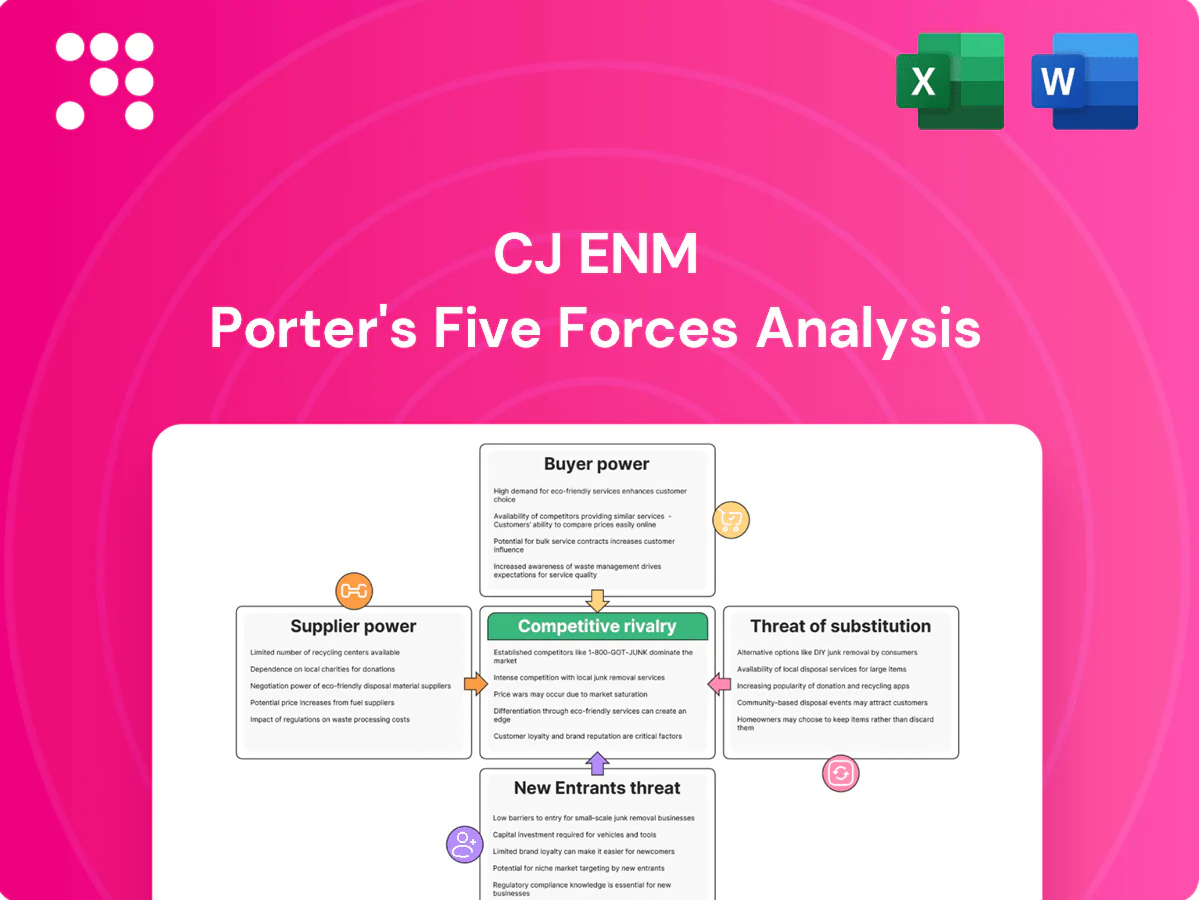
This preview shows the exact CJ ENM Porter's Five Forces analysis you'll receive—no placeholders or mockups. The document is professionally written, fully formatted and ready for immediate download after purchase. What you see here is precisely what you'll get.

Don't Miss the Bigger Picture
CJ ENM faces intense buyer power and growing digital substitutes, while content scale and distribution partnerships mitigate supplier threats; entry barriers are moderate but innovation and regulation shape competitive intensity. This brief snapshot only scratches the surface. Unlock the full Porter's Five Forces Analysis to explore CJ ENM’s competitive dynamics in detail.
Suppliers Bargaining Power
Star talent leverage
Top actors, directors, idols and showrunners command premium fees and significant creative control, with leading talent reportedly earning up to KRW 1–2 billion (~$800k–$1.6M) per project, strengthening supplier leverage. Hit-driven dynamics and platform competition amplify negotiating power, while exclusivity demands and schedule bottlenecks can delay slates. CJ ENM mitigates this by signing multi-project deals and expanding in-house development to secure pipelines and reduce single-talent risk.
Agency and label concentration
Major Korean agencies—HYBE, SM, YG, JYP and others—aggregate bargaining power with bundled rosters and extensive IP libraries, raising switching costs for distributors and platforms. Conflicts over revenue splits for global rights remain frequent, especially as licensors push for larger backend shares. Long-term partnerships and co-investments with firms like CJ ENM temper volatility and preserve access to marquee talent.
Production vendors and studios
Specialized VFX, post-production and high-end crews were capacity-constrained in 2024 with industry utilization near 90%, pushing peak-cycle rate hikes of 20–40% and longer timelines. Quality differentiation limits substitution, while CJ ENM’s vertical integration and preferred-vendor programs cut average lead times about 15% and stabilized supply.
Music and format IP holders
Music and format IP holders extract royalties and minimum guarantees; the global music publishing market reached about $8.2 billion in 2024, pushing licensors to demand >10–20% of production upside or sizable MGs. Proven IP lowers commissioning risk, justifying higher terms and making renewals dependent on international performance and ratings. CJ ENM offsets supplier power by investing in original IP and in-house format development to dilute dependence.
- royalties and MGs pressure margins
- proven IP = higher license terms
- renewals tied to international traction
- CJ ENM builds original IP to reduce supplier leverage
Tech and distribution infrastructure
Cloud, CDN and ad-tech providers materially shape delivery cost and quality; public cloud spending reached about 600 billion USD in 2024 and the CDN market was ~21 billion USD in 2024, directly influencing latency and unit delivery costs.
Provider fragmentation and integration complexity across regions increase switching friction and operational overhead for CJ ENM, raising migration cost and time.
Data access and licensing terms constrain ad and content monetization; ad-tech take rates commonly range 10–30%, while multi-vendor architectures and owned platforms reduce vendor lock-in.
- Cloud market 2024 ~600B USD
- CDN market 2024 ~21B USD
- Ad-tech fees ~10–30%
- Multi-vendor + owned infra = lower lock-in
Talent, VFX & music royalties concentrate supplier power; vertical integration and bundles cut costs
Top talent fees (KRW 1–2bn/project) and agency bundling concentrate supplier power; VFX utilization ~90% drove 20–40% rate spikes in 2024; music publishing ~$8.2B (2024) pushes >10–20% license takes; cloud ~$600B and CDN ~$21B (2024) set delivery costs. CJ ENM uses multi-project deals, in-house IP and vertical integration to reduce supplier leverage.
| Supplier | 2024 metric | Impact | Response |
|---|---|---|---|
| Talent/agencies | KRW 1–2bn | High fees, exclusivity | Multi-project deals |
| VFX/crew | Utilization ~90% | 20–40% rate spike | Preferred vendors |
| Music/IP | $8.2B | 10–20% royalties | Original IP |
| Cloud/CDN | $600B/$21B | Delivery costs | Owned infra |
What is included in the product
Detailed Word Document
Comprehensive Porter's Five Forces analysis for CJ ENM that uncovers competitive drivers, supplier and buyer power, threat of entrants and substitutes, and strategic barriers protecting its media and entertainment market position, highlighting disruptive trends and implications for pricing and profitability.
Customizable Excel Spreadsheet
A clear one-sheet summary of CJ ENM's five forces—perfect for quick strategic decisions; swap in your own data, duplicate tabs for pre/post scenarios, and customize pressure levels without macros for easy boardroom-ready insights.
Customers Bargaining Power
Global streamers’ clout
Platforms like Netflix, with roughly 260 million subscribers in 2024, wield significant scale in licensing negotiations and press for broader rights and cost-sharing. They use visibility boosts to extract concessions, often linking slate placement to fees. Global OTTs invested over $70 billion in content in 2023, increasing bargaining leverage. CJ ENM's diversified portfolio reduces single-buyer exposure, mitigating this pressure.
Domestic broadcasters and telcos
Domestic broadcasters and telcos (KT, SKT, LG U+) collectively control over 90% of pay-TV distribution, making them key slot and carriage buyers. Competitive bidding often favors CJ ENM hits, allowing premium placement, but price sensitivity remains strong among operators and consumers. Bundling channels and extensive content libraries raises CJ ENMs leverage and ARPU potential, while Korea Communications Commission rules on carriage and exclusivity constrain contract terms.
Advertisers and sponsors
Advertisers and sponsors push CJ ENM for measurable ROI and brand-safe placements, with global ad spend reaching about US$833bn in 2024, raising scrutiny on attribution and viewability. Cyclical ad budgets create heightened pricing pressure during downturns, compressing CPMs and margins. Branded content yields higher margins but demands creative and scheduling flexibility. Data-driven targeting lifts yield and retention by improving conversion efficiency and campaign repeatability.
Fans and end-consumers
Fans show low churn for strong IP but can switch apps easily, making platform convenience critical; price hikes provoke immediate backlash, as seen in streaming markets where retention hinges on perceived value. Quality, timely releases, and community engagement drive stickiness, while merch, concerts and fandom perks reduce price elasticity and increase lifetime value.
- Low churn for hit IP
- Easy app switching
- Price-sensitive, reacts fast
- Engagement + events raise LTV
International distributors
International distributors push for exclusive windows and localized versions, driving CJ ENM to include stricter localization support in contracts; currency volatility and compliance risks often force hedged, milestone-based deal structures. Distributors demand performance clauses and step-up pricing tied to viewership or revenue thresholds, while co-production models are used to align incentives and reduce upfront financing pressure.
- Exclusive windows required
- Hedged, milestone payments
- Performance clauses common
- Co-production reduces upfront risk
Scale OTTs' content leverage vs pay-TV carriage pressure: advertisers demand ROI, fans switch fast
Scale buyers (Netflix ~260M subs in 2024) and global OTTs (>$70bn content spend in 2023) exert strong licensing leverage; domestic pay-TV operators (90%+ distribution) push hard on carriage fees. Advertisers (global ad spend ~$833bn in 2024) demand measurable ROI, while fans show low churn for hit IP but can switch apps quickly.
| Customer | Metric | Impact |
|---|---|---|
| Global OTTs | 260M subs / $70bn spend | High licensing leverage |
| Domestic operators | 90%+ distribution | Carriage pressure |
| Advertisers | $833bn ad spend | ROI-driven pricing |
What You See Is What You Get
CJ ENM Porter's Five Forces Analysis
This preview shows the exact CJ ENM Porter's Five Forces analysis you'll receive—no placeholders or mockups. The document is professionally written, fully formatted and ready for immediate download after purchase. What you see here is precisely what you'll get.
Original: $10.00
-65%$10.00
$3.50Description
Don't Miss the Bigger Picture
CJ ENM faces intense buyer power and growing digital substitutes, while content scale and distribution partnerships mitigate supplier threats; entry barriers are moderate but innovation and regulation shape competitive intensity. This brief snapshot only scratches the surface. Unlock the full Porter's Five Forces Analysis to explore CJ ENM’s competitive dynamics in detail.
Suppliers Bargaining Power
Star talent leverage
Top actors, directors, idols and showrunners command premium fees and significant creative control, with leading talent reportedly earning up to KRW 1–2 billion (~$800k–$1.6M) per project, strengthening supplier leverage. Hit-driven dynamics and platform competition amplify negotiating power, while exclusivity demands and schedule bottlenecks can delay slates. CJ ENM mitigates this by signing multi-project deals and expanding in-house development to secure pipelines and reduce single-talent risk.
Agency and label concentration
Major Korean agencies—HYBE, SM, YG, JYP and others—aggregate bargaining power with bundled rosters and extensive IP libraries, raising switching costs for distributors and platforms. Conflicts over revenue splits for global rights remain frequent, especially as licensors push for larger backend shares. Long-term partnerships and co-investments with firms like CJ ENM temper volatility and preserve access to marquee talent.
Production vendors and studios
Specialized VFX, post-production and high-end crews were capacity-constrained in 2024 with industry utilization near 90%, pushing peak-cycle rate hikes of 20–40% and longer timelines. Quality differentiation limits substitution, while CJ ENM’s vertical integration and preferred-vendor programs cut average lead times about 15% and stabilized supply.
Music and format IP holders
Music and format IP holders extract royalties and minimum guarantees; the global music publishing market reached about $8.2 billion in 2024, pushing licensors to demand >10–20% of production upside or sizable MGs. Proven IP lowers commissioning risk, justifying higher terms and making renewals dependent on international performance and ratings. CJ ENM offsets supplier power by investing in original IP and in-house format development to dilute dependence.
- royalties and MGs pressure margins
- proven IP = higher license terms
- renewals tied to international traction
- CJ ENM builds original IP to reduce supplier leverage
Tech and distribution infrastructure
Cloud, CDN and ad-tech providers materially shape delivery cost and quality; public cloud spending reached about 600 billion USD in 2024 and the CDN market was ~21 billion USD in 2024, directly influencing latency and unit delivery costs.
Provider fragmentation and integration complexity across regions increase switching friction and operational overhead for CJ ENM, raising migration cost and time.
Data access and licensing terms constrain ad and content monetization; ad-tech take rates commonly range 10–30%, while multi-vendor architectures and owned platforms reduce vendor lock-in.
- Cloud market 2024 ~600B USD
- CDN market 2024 ~21B USD
- Ad-tech fees ~10–30%
- Multi-vendor + owned infra = lower lock-in
Talent, VFX & music royalties concentrate supplier power; vertical integration and bundles cut costs
Top talent fees (KRW 1–2bn/project) and agency bundling concentrate supplier power; VFX utilization ~90% drove 20–40% rate spikes in 2024; music publishing ~$8.2B (2024) pushes >10–20% license takes; cloud ~$600B and CDN ~$21B (2024) set delivery costs. CJ ENM uses multi-project deals, in-house IP and vertical integration to reduce supplier leverage.
| Supplier | 2024 metric | Impact | Response |
|---|---|---|---|
| Talent/agencies | KRW 1–2bn | High fees, exclusivity | Multi-project deals |
| VFX/crew | Utilization ~90% | 20–40% rate spike | Preferred vendors |
| Music/IP | $8.2B | 10–20% royalties | Original IP |
| Cloud/CDN | $600B/$21B | Delivery costs | Owned infra |
What is included in the product
Detailed Word Document
Comprehensive Porter's Five Forces analysis for CJ ENM that uncovers competitive drivers, supplier and buyer power, threat of entrants and substitutes, and strategic barriers protecting its media and entertainment market position, highlighting disruptive trends and implications for pricing and profitability.
Customizable Excel Spreadsheet
A clear one-sheet summary of CJ ENM's five forces—perfect for quick strategic decisions; swap in your own data, duplicate tabs for pre/post scenarios, and customize pressure levels without macros for easy boardroom-ready insights.
Customers Bargaining Power
Global streamers’ clout
Platforms like Netflix, with roughly 260 million subscribers in 2024, wield significant scale in licensing negotiations and press for broader rights and cost-sharing. They use visibility boosts to extract concessions, often linking slate placement to fees. Global OTTs invested over $70 billion in content in 2023, increasing bargaining leverage. CJ ENM's diversified portfolio reduces single-buyer exposure, mitigating this pressure.
Domestic broadcasters and telcos
Domestic broadcasters and telcos (KT, SKT, LG U+) collectively control over 90% of pay-TV distribution, making them key slot and carriage buyers. Competitive bidding often favors CJ ENM hits, allowing premium placement, but price sensitivity remains strong among operators and consumers. Bundling channels and extensive content libraries raises CJ ENMs leverage and ARPU potential, while Korea Communications Commission rules on carriage and exclusivity constrain contract terms.
Advertisers and sponsors
Advertisers and sponsors push CJ ENM for measurable ROI and brand-safe placements, with global ad spend reaching about US$833bn in 2024, raising scrutiny on attribution and viewability. Cyclical ad budgets create heightened pricing pressure during downturns, compressing CPMs and margins. Branded content yields higher margins but demands creative and scheduling flexibility. Data-driven targeting lifts yield and retention by improving conversion efficiency and campaign repeatability.
Fans and end-consumers
Fans show low churn for strong IP but can switch apps easily, making platform convenience critical; price hikes provoke immediate backlash, as seen in streaming markets where retention hinges on perceived value. Quality, timely releases, and community engagement drive stickiness, while merch, concerts and fandom perks reduce price elasticity and increase lifetime value.
- Low churn for hit IP
- Easy app switching
- Price-sensitive, reacts fast
- Engagement + events raise LTV
International distributors
International distributors push for exclusive windows and localized versions, driving CJ ENM to include stricter localization support in contracts; currency volatility and compliance risks often force hedged, milestone-based deal structures. Distributors demand performance clauses and step-up pricing tied to viewership or revenue thresholds, while co-production models are used to align incentives and reduce upfront financing pressure.
- Exclusive windows required
- Hedged, milestone payments
- Performance clauses common
- Co-production reduces upfront risk
Scale OTTs' content leverage vs pay-TV carriage pressure: advertisers demand ROI, fans switch fast
Scale buyers (Netflix ~260M subs in 2024) and global OTTs (>$70bn content spend in 2023) exert strong licensing leverage; domestic pay-TV operators (90%+ distribution) push hard on carriage fees. Advertisers (global ad spend ~$833bn in 2024) demand measurable ROI, while fans show low churn for hit IP but can switch apps quickly.
| Customer | Metric | Impact |
|---|---|---|
| Global OTTs | 260M subs / $70bn spend | High licensing leverage |
| Domestic operators | 90%+ distribution | Carriage pressure |
| Advertisers | $833bn ad spend | ROI-driven pricing |
What You See Is What You Get
CJ ENM Porter's Five Forces Analysis
This preview shows the exact CJ ENM Porter's Five Forces analysis you'll receive—no placeholders or mockups. The document is professionally written, fully formatted and ready for immediate download after purchase. What you see here is precisely what you'll get.











