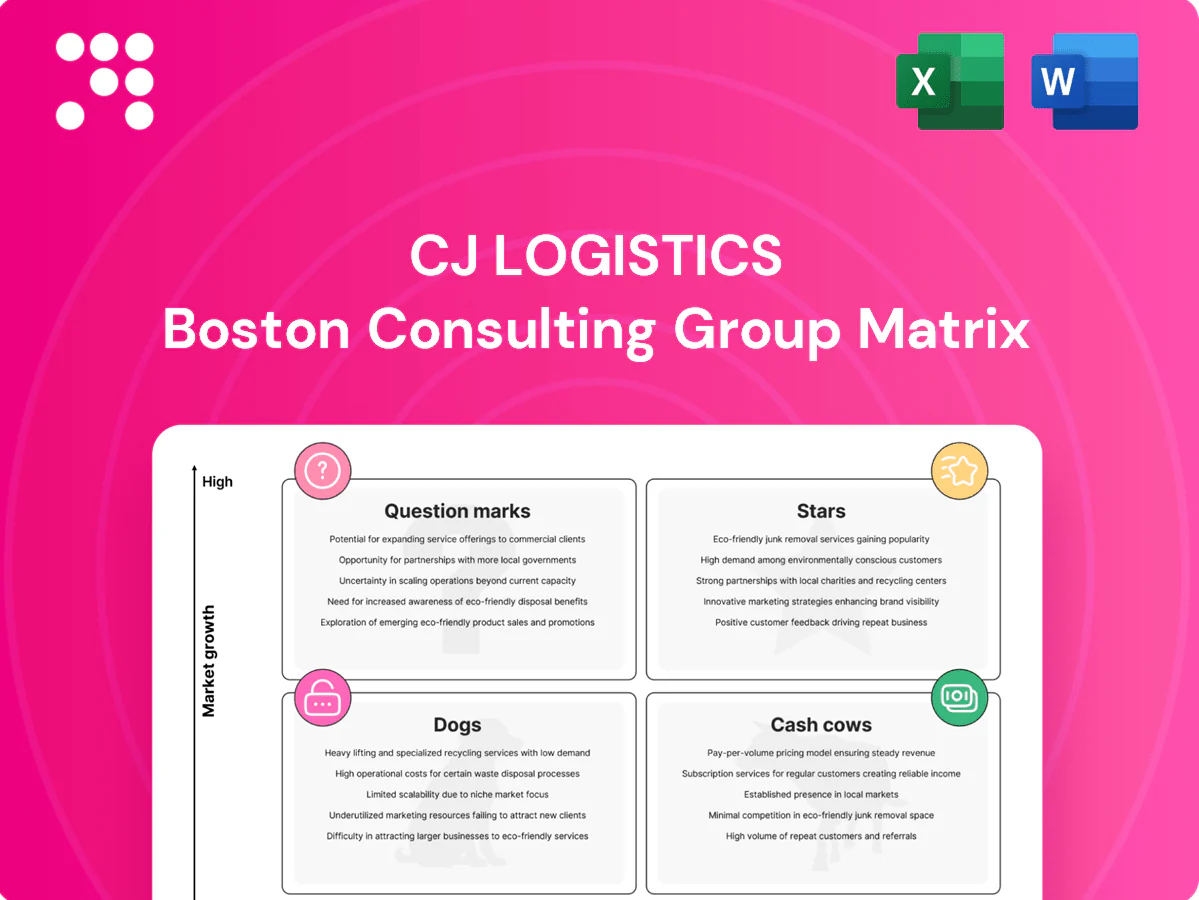
CJ Logistics Boston Consulting Group Matrix

Visual. Strategic. Downloadable.
CJ Logistics’ BCG Matrix snapshot shows which services are fueling growth and which are quietly bleeding cash—think delivery hubs as Stars, legacy freight lines as Cash Cows, and underperforming segments asking for tough choices. Want the granular quadrant map, data-backed moves, and a ready-to-use Word + Excel pack? Purchase the full BCG Matrix for the strategic clarity and execution plan you can act on now.
Stars

Automated e-fulfillment for enterprise e-commerce
High-growth online retail—Asia e-commerce up ~10% YoY in 2024—keeps volumes surging, and CJ’s tech-led automated e-fulfillment sites are winning major accounts. Robotics, smart WMS and sub-24h SLAs position CJ as a category leader across several Asian markets. The model gulps capex and talent, but ongoing share gains justify the burn. Continue investing to lock in scale before the curve flattens.
Domestic express/last‑mile in core markets
Parcel demand continues expanding—Korea parcel volumes rose ~6% in 2024—while CJ’s dense domestic network drives strong share and defensible unit costs. Fast service plus broad pickup/drop coverage keep CJ top‑of‑mind for merchants and support premium time‑definite tiers. Capital intensity remains (fleet, sortation, labor), but operations generate growth and proprietary data advantages. Priority: protect share and upsell premium tiers.

Contract logistics for FMCG and retail
Contract logistics for FMCG and retail is a Stars segment: large multi-year (typically 3–5 year) contracts, integrated warehousing plus transportation, and sticky processes make CJ the incumbent to beat. The segment grows as omnichannel complexity and SKU proliferation rise, driving higher per-SKU handling. Margins strengthen when automation and slotting are tuned—automation often boosts productivity 20–40%—so double down on vertical playbooks and co-invest with anchor clients.

Technology platforms (WMS/TMS/visibility) embedded in ops
Proprietary WMS/TMS/visibility embedded in CJ Logistics ops raises win rates and retention as clients buy the platform and service; company sources report platform-linked accounts have 20–30% higher renewal rates and 15–25% higher yield per lane in 2024. The global supply-chain visibility market was estimated at about $4.1B in 2024 with ~12–13% CAGR, justifying high development costs but favoring share gains. Keep shipping features; monetize analytics layers selectively.
- Platform-driven retention: +20–30% renewal
- Yield uplift: +15–25% per lane
- Market size 2024: ~$4.1B, CAGR ~12–13%
- Capex: high upfront dev; ROI via share and yield
- Strategy: preserve shipping features; tier analytics monetization
Cold-chain logistics for pharma and fresh
Regulated growth markets with rising quality demands reward reliable temperature control; the global pharma cold-chain market has expanded rapidly since 2021 and remains a high-growth segment. CJ’s specialized refrigerated assets, validated SOPs and GDP certifications differentiate it from generalists and support premium service pricing. Capex intensity is high, but scarce capability sustains pricing power and margin resilience. Scaling regional nodes and accelerating certification rollout will cement leadership.
Scale logistics: seize +10% e-commerce, +6% parcel
Stars: high-growth e‑commerce (+10% Asia 2024) and parcel (+6% Korea 2024), platform-linked renewals +20–30%, yield +15–25%, visibility market ~$4.1B (CAGR 12–13%), automation +20–40% productivity; invest to scale, protect share, monetize analytics, expand cold‑chain nodes.
| Metric | 2024 |
|---|---|
| Asia e‑commerce growth | ~+10% YoY |
| Korea parcel growth | ~+6% YoY |
| Renewal uplift | +20–30% |
| Yield uplift | +15–25% |
| Visibility market | ~$4.1B, CAGR 12–13% |
What is included in the product
 Detailed Word Document
Comprehensive BCG review of CJ Logistics' units, highlighting Stars, Cash Cows, Question Marks and Dogs, with invest, hold or divest guidance.

 Customizable Excel Spreadsheet
One-page CJ Logistics BCG Matrix that maps units into quadrants, simplifying portfolio decisions for faster, C-level clarity.
Cash Cows

Domestic contract warehousing in mature sectors
Domestic contract warehousing in mature sectors supplies steady cash for CJ Logistics, accounting for roughly 20–25% of group revenue in 2024 with site utilization above 95% and entrenched long‑term contracts. Growth is modest (low single digits), but years of Kaizen tweaks lift operating margins toward ~8% and reduce turnaround times. Incremental capex remains low (under 2% of segment revenue annually), so facilities milk cash while sales teams selectively upsell value‑added services.
Line‑haul transportation on established lanes
High share on core corridors drives consistent utilization (~90%) and predictable margins (EBITDA ~7%), sustaining cash flow from line‑haul lanes. Market growth is flat (~1% in 2024), but network density reduces cost per mile and protects unit economics. Capex remains disciplined with proven ROI (>12% on lane investments); maintain service quality and renegotiate contracts to index fuel and labor.

Customs brokerage and documentation services
Customs brokerage and documentation services are process-heavy, repeatable operations with sticky client ties and high cash conversion, serving as CJ Logistics’ reliable cash engine. Market growth in 2024 remained tepid at low-single-digit rates, yet rising compliance complexity and tariffs raise switching costs and protect incumbents. Minimal marketing spend is required given entrenched relationships. Bundling with freight increases overall retention and lifetime value.

Value‑added services (kitting, light assembly) for legacy accounts
Value-added kitting and light assembly for legacy accounts delivers predictable volumes and long contracts, marking it a cash cow in CJ Logistics' BCG Matrix. Established SOPs keep operating costs and error rates low, enabling harvest margins and modest price adjustments tied to quality KPIs. Incremental tooling capex is small, preserving steady cash flow and ROI.
- Predictable volumes, long contracts
- Low incremental capex; SOPs reduce errors
- Harvest margin strategy with small quality-linked price increases
Domestic SME parcel in saturated areas
Domestic SME parcel in saturated areas
Market growth is muted, yet CJ’s dense route network and strong brand trust preserve share among SMEs. Customer acquisition costs remain low via word‑of‑mouth and network effects. Margins hold when minimums and surcharges are enforced; focus on targeted retention rather than broad discounting.- Low growth, high share retention
- Low acquisition cost: referral-driven
- Stable margins with minimums/surcharges
- Maintain via targeted retention, not discounts
Warehousing, haul & customs: 20–25% revenue; ROI > 12%
Domestic contract warehousing, core line‑haul, customs brokerage and light assembly supply steady cash for CJ Logistics: ~20–25% group revenue in 2024, utilization 90–95%+, operating margins ~7–8%, capex <2% of segment revenue, and ROI on lane investments >12%.
| Segment | 2024 rev share | Utilization | Margin (EBIT/EBITDA) | Capex | Growth 2024 |
|---|---|---|---|---|---|
| Contract warehousing | 20–25% | 95%+ | ~8% op | <2% rev | low + |
| Line‑haul | — | ~90% | ~7% EBITDA | disc. | ~1% |
| Customs/docs | — | high | high cash conv. | minimal | low‑single % |
| VAD/kitting | — | steady | harvest margins | small | low |
Preview = Final Product
CJ Logistics BCG Matrix
The file you’re previewing is the exact CJ Logistics BCG Matrix you’ll receive after purchase—no watermarks, no placeholders. It’s a fully formatted, analysis-ready report crafted for strategic clarity and immediate use. Buy once and download instantly for editing, printing, or presenting to stakeholders. What you see is what you get—professional, precise, and ready to plug into your planning.

Visual. Strategic. Downloadable.
CJ Logistics’ BCG Matrix snapshot shows which services are fueling growth and which are quietly bleeding cash—think delivery hubs as Stars, legacy freight lines as Cash Cows, and underperforming segments asking for tough choices. Want the granular quadrant map, data-backed moves, and a ready-to-use Word + Excel pack? Purchase the full BCG Matrix for the strategic clarity and execution plan you can act on now.
Stars
Automated e-fulfillment for enterprise e-commerce
High-growth online retail—Asia e-commerce up ~10% YoY in 2024—keeps volumes surging, and CJ’s tech-led automated e-fulfillment sites are winning major accounts. Robotics, smart WMS and sub-24h SLAs position CJ as a category leader across several Asian markets. The model gulps capex and talent, but ongoing share gains justify the burn. Continue investing to lock in scale before the curve flattens.
Domestic express/last‑mile in core markets
Parcel demand continues expanding—Korea parcel volumes rose ~6% in 2024—while CJ’s dense domestic network drives strong share and defensible unit costs. Fast service plus broad pickup/drop coverage keep CJ top‑of‑mind for merchants and support premium time‑definite tiers. Capital intensity remains (fleet, sortation, labor), but operations generate growth and proprietary data advantages. Priority: protect share and upsell premium tiers.
Contract logistics for FMCG and retail
Contract logistics for FMCG and retail is a Stars segment: large multi-year (typically 3–5 year) contracts, integrated warehousing plus transportation, and sticky processes make CJ the incumbent to beat. The segment grows as omnichannel complexity and SKU proliferation rise, driving higher per-SKU handling. Margins strengthen when automation and slotting are tuned—automation often boosts productivity 20–40%—so double down on vertical playbooks and co-invest with anchor clients.
Technology platforms (WMS/TMS/visibility) embedded in ops
Proprietary WMS/TMS/visibility embedded in CJ Logistics ops raises win rates and retention as clients buy the platform and service; company sources report platform-linked accounts have 20–30% higher renewal rates and 15–25% higher yield per lane in 2024. The global supply-chain visibility market was estimated at about $4.1B in 2024 with ~12–13% CAGR, justifying high development costs but favoring share gains. Keep shipping features; monetize analytics layers selectively.
- Platform-driven retention: +20–30% renewal
- Yield uplift: +15–25% per lane
- Market size 2024: ~$4.1B, CAGR ~12–13%
- Capex: high upfront dev; ROI via share and yield
- Strategy: preserve shipping features; tier analytics monetization
Cold-chain logistics for pharma and fresh
Regulated growth markets with rising quality demands reward reliable temperature control; the global pharma cold-chain market has expanded rapidly since 2021 and remains a high-growth segment. CJ’s specialized refrigerated assets, validated SOPs and GDP certifications differentiate it from generalists and support premium service pricing. Capex intensity is high, but scarce capability sustains pricing power and margin resilience. Scaling regional nodes and accelerating certification rollout will cement leadership.
Scale logistics: seize +10% e-commerce, +6% parcel
Stars: high-growth e‑commerce (+10% Asia 2024) and parcel (+6% Korea 2024), platform-linked renewals +20–30%, yield +15–25%, visibility market ~$4.1B (CAGR 12–13%), automation +20–40% productivity; invest to scale, protect share, monetize analytics, expand cold‑chain nodes.
| Metric | 2024 |
|---|---|
| Asia e‑commerce growth | ~+10% YoY |
| Korea parcel growth | ~+6% YoY |
| Renewal uplift | +20–30% |
| Yield uplift | +15–25% |
| Visibility market | ~$4.1B, CAGR 12–13% |
What is included in the product
Detailed Word Document
Comprehensive BCG review of CJ Logistics' units, highlighting Stars, Cash Cows, Question Marks and Dogs, with invest, hold or divest guidance.
Customizable Excel Spreadsheet
One-page CJ Logistics BCG Matrix that maps units into quadrants, simplifying portfolio decisions for faster, C-level clarity.
Cash Cows
Domestic contract warehousing in mature sectors
Domestic contract warehousing in mature sectors supplies steady cash for CJ Logistics, accounting for roughly 20–25% of group revenue in 2024 with site utilization above 95% and entrenched long‑term contracts. Growth is modest (low single digits), but years of Kaizen tweaks lift operating margins toward ~8% and reduce turnaround times. Incremental capex remains low (under 2% of segment revenue annually), so facilities milk cash while sales teams selectively upsell value‑added services.
Line‑haul transportation on established lanes
High share on core corridors drives consistent utilization (~90%) and predictable margins (EBITDA ~7%), sustaining cash flow from line‑haul lanes. Market growth is flat (~1% in 2024), but network density reduces cost per mile and protects unit economics. Capex remains disciplined with proven ROI (>12% on lane investments); maintain service quality and renegotiate contracts to index fuel and labor.
Customs brokerage and documentation services
Customs brokerage and documentation services are process-heavy, repeatable operations with sticky client ties and high cash conversion, serving as CJ Logistics’ reliable cash engine. Market growth in 2024 remained tepid at low-single-digit rates, yet rising compliance complexity and tariffs raise switching costs and protect incumbents. Minimal marketing spend is required given entrenched relationships. Bundling with freight increases overall retention and lifetime value.
Value‑added services (kitting, light assembly) for legacy accounts
Value-added kitting and light assembly for legacy accounts delivers predictable volumes and long contracts, marking it a cash cow in CJ Logistics' BCG Matrix. Established SOPs keep operating costs and error rates low, enabling harvest margins and modest price adjustments tied to quality KPIs. Incremental tooling capex is small, preserving steady cash flow and ROI.
- Predictable volumes, long contracts
- Low incremental capex; SOPs reduce errors
- Harvest margin strategy with small quality-linked price increases
Domestic SME parcel in saturated areas
Domestic SME parcel in saturated areas
Market growth is muted, yet CJ’s dense route network and strong brand trust preserve share among SMEs. Customer acquisition costs remain low via word‑of‑mouth and network effects. Margins hold when minimums and surcharges are enforced; focus on targeted retention rather than broad discounting.- Low growth, high share retention
- Low acquisition cost: referral-driven
- Stable margins with minimums/surcharges
- Maintain via targeted retention, not discounts
Warehousing, haul & customs: 20–25% revenue; ROI > 12%
Domestic contract warehousing, core line‑haul, customs brokerage and light assembly supply steady cash for CJ Logistics: ~20–25% group revenue in 2024, utilization 90–95%+, operating margins ~7–8%, capex <2% of segment revenue, and ROI on lane investments >12%.
| Segment | 2024 rev share | Utilization | Margin (EBIT/EBITDA) | Capex | Growth 2024 |
|---|---|---|---|---|---|
| Contract warehousing | 20–25% | 95%+ | ~8% op | <2% rev | low + |
| Line‑haul | — | ~90% | ~7% EBITDA | disc. | ~1% |
| Customs/docs | — | high | high cash conv. | minimal | low‑single % |
| VAD/kitting | — | steady | harvest margins | small | low |
Preview = Final Product
CJ Logistics BCG Matrix
The file you’re previewing is the exact CJ Logistics BCG Matrix you’ll receive after purchase—no watermarks, no placeholders. It’s a fully formatted, analysis-ready report crafted for strategic clarity and immediate use. Buy once and download instantly for editing, printing, or presenting to stakeholders. What you see is what you get—professional, precise, and ready to plug into your planning.
Description
Visual. Strategic. Downloadable.
CJ Logistics’ BCG Matrix snapshot shows which services are fueling growth and which are quietly bleeding cash—think delivery hubs as Stars, legacy freight lines as Cash Cows, and underperforming segments asking for tough choices. Want the granular quadrant map, data-backed moves, and a ready-to-use Word + Excel pack? Purchase the full BCG Matrix for the strategic clarity and execution plan you can act on now.
Stars
Automated e-fulfillment for enterprise e-commerce
High-growth online retail—Asia e-commerce up ~10% YoY in 2024—keeps volumes surging, and CJ’s tech-led automated e-fulfillment sites are winning major accounts. Robotics, smart WMS and sub-24h SLAs position CJ as a category leader across several Asian markets. The model gulps capex and talent, but ongoing share gains justify the burn. Continue investing to lock in scale before the curve flattens.
Domestic express/last‑mile in core markets
Parcel demand continues expanding—Korea parcel volumes rose ~6% in 2024—while CJ’s dense domestic network drives strong share and defensible unit costs. Fast service plus broad pickup/drop coverage keep CJ top‑of‑mind for merchants and support premium time‑definite tiers. Capital intensity remains (fleet, sortation, labor), but operations generate growth and proprietary data advantages. Priority: protect share and upsell premium tiers.
Contract logistics for FMCG and retail
Contract logistics for FMCG and retail is a Stars segment: large multi-year (typically 3–5 year) contracts, integrated warehousing plus transportation, and sticky processes make CJ the incumbent to beat. The segment grows as omnichannel complexity and SKU proliferation rise, driving higher per-SKU handling. Margins strengthen when automation and slotting are tuned—automation often boosts productivity 20–40%—so double down on vertical playbooks and co-invest with anchor clients.
Technology platforms (WMS/TMS/visibility) embedded in ops
Proprietary WMS/TMS/visibility embedded in CJ Logistics ops raises win rates and retention as clients buy the platform and service; company sources report platform-linked accounts have 20–30% higher renewal rates and 15–25% higher yield per lane in 2024. The global supply-chain visibility market was estimated at about $4.1B in 2024 with ~12–13% CAGR, justifying high development costs but favoring share gains. Keep shipping features; monetize analytics layers selectively.
- Platform-driven retention: +20–30% renewal
- Yield uplift: +15–25% per lane
- Market size 2024: ~$4.1B, CAGR ~12–13%
- Capex: high upfront dev; ROI via share and yield
- Strategy: preserve shipping features; tier analytics monetization
Cold-chain logistics for pharma and fresh
Regulated growth markets with rising quality demands reward reliable temperature control; the global pharma cold-chain market has expanded rapidly since 2021 and remains a high-growth segment. CJ’s specialized refrigerated assets, validated SOPs and GDP certifications differentiate it from generalists and support premium service pricing. Capex intensity is high, but scarce capability sustains pricing power and margin resilience. Scaling regional nodes and accelerating certification rollout will cement leadership.
Scale logistics: seize +10% e-commerce, +6% parcel
Stars: high-growth e‑commerce (+10% Asia 2024) and parcel (+6% Korea 2024), platform-linked renewals +20–30%, yield +15–25%, visibility market ~$4.1B (CAGR 12–13%), automation +20–40% productivity; invest to scale, protect share, monetize analytics, expand cold‑chain nodes.
| Metric | 2024 |
|---|---|
| Asia e‑commerce growth | ~+10% YoY |
| Korea parcel growth | ~+6% YoY |
| Renewal uplift | +20–30% |
| Yield uplift | +15–25% |
| Visibility market | ~$4.1B, CAGR 12–13% |
What is included in the product
Detailed Word Document
Comprehensive BCG review of CJ Logistics' units, highlighting Stars, Cash Cows, Question Marks and Dogs, with invest, hold or divest guidance.
Customizable Excel Spreadsheet
One-page CJ Logistics BCG Matrix that maps units into quadrants, simplifying portfolio decisions for faster, C-level clarity.
Cash Cows
Domestic contract warehousing in mature sectors
Domestic contract warehousing in mature sectors supplies steady cash for CJ Logistics, accounting for roughly 20–25% of group revenue in 2024 with site utilization above 95% and entrenched long‑term contracts. Growth is modest (low single digits), but years of Kaizen tweaks lift operating margins toward ~8% and reduce turnaround times. Incremental capex remains low (under 2% of segment revenue annually), so facilities milk cash while sales teams selectively upsell value‑added services.
Line‑haul transportation on established lanes
High share on core corridors drives consistent utilization (~90%) and predictable margins (EBITDA ~7%), sustaining cash flow from line‑haul lanes. Market growth is flat (~1% in 2024), but network density reduces cost per mile and protects unit economics. Capex remains disciplined with proven ROI (>12% on lane investments); maintain service quality and renegotiate contracts to index fuel and labor.
Customs brokerage and documentation services
Customs brokerage and documentation services are process-heavy, repeatable operations with sticky client ties and high cash conversion, serving as CJ Logistics’ reliable cash engine. Market growth in 2024 remained tepid at low-single-digit rates, yet rising compliance complexity and tariffs raise switching costs and protect incumbents. Minimal marketing spend is required given entrenched relationships. Bundling with freight increases overall retention and lifetime value.
Value‑added services (kitting, light assembly) for legacy accounts
Value-added kitting and light assembly for legacy accounts delivers predictable volumes and long contracts, marking it a cash cow in CJ Logistics' BCG Matrix. Established SOPs keep operating costs and error rates low, enabling harvest margins and modest price adjustments tied to quality KPIs. Incremental tooling capex is small, preserving steady cash flow and ROI.
- Predictable volumes, long contracts
- Low incremental capex; SOPs reduce errors
- Harvest margin strategy with small quality-linked price increases
Domestic SME parcel in saturated areas
Domestic SME parcel in saturated areas
Market growth is muted, yet CJ’s dense route network and strong brand trust preserve share among SMEs. Customer acquisition costs remain low via word‑of‑mouth and network effects. Margins hold when minimums and surcharges are enforced; focus on targeted retention rather than broad discounting.- Low growth, high share retention
- Low acquisition cost: referral-driven
- Stable margins with minimums/surcharges
- Maintain via targeted retention, not discounts
Warehousing, haul & customs: 20–25% revenue; ROI > 12%
Domestic contract warehousing, core line‑haul, customs brokerage and light assembly supply steady cash for CJ Logistics: ~20–25% group revenue in 2024, utilization 90–95%+, operating margins ~7–8%, capex <2% of segment revenue, and ROI on lane investments >12%.
| Segment | 2024 rev share | Utilization | Margin (EBIT/EBITDA) | Capex | Growth 2024 |
|---|---|---|---|---|---|
| Contract warehousing | 20–25% | 95%+ | ~8% op | <2% rev | low + |
| Line‑haul | — | ~90% | ~7% EBITDA | disc. | ~1% |
| Customs/docs | — | high | high cash conv. | minimal | low‑single % |
| VAD/kitting | — | steady | harvest margins | small | low |
Preview = Final Product
CJ Logistics BCG Matrix
The file you’re previewing is the exact CJ Logistics BCG Matrix you’ll receive after purchase—no watermarks, no placeholders. It’s a fully formatted, analysis-ready report crafted for strategic clarity and immediate use. Buy once and download instantly for editing, printing, or presenting to stakeholders. What you see is what you get—professional, precise, and ready to plug into your planning.











