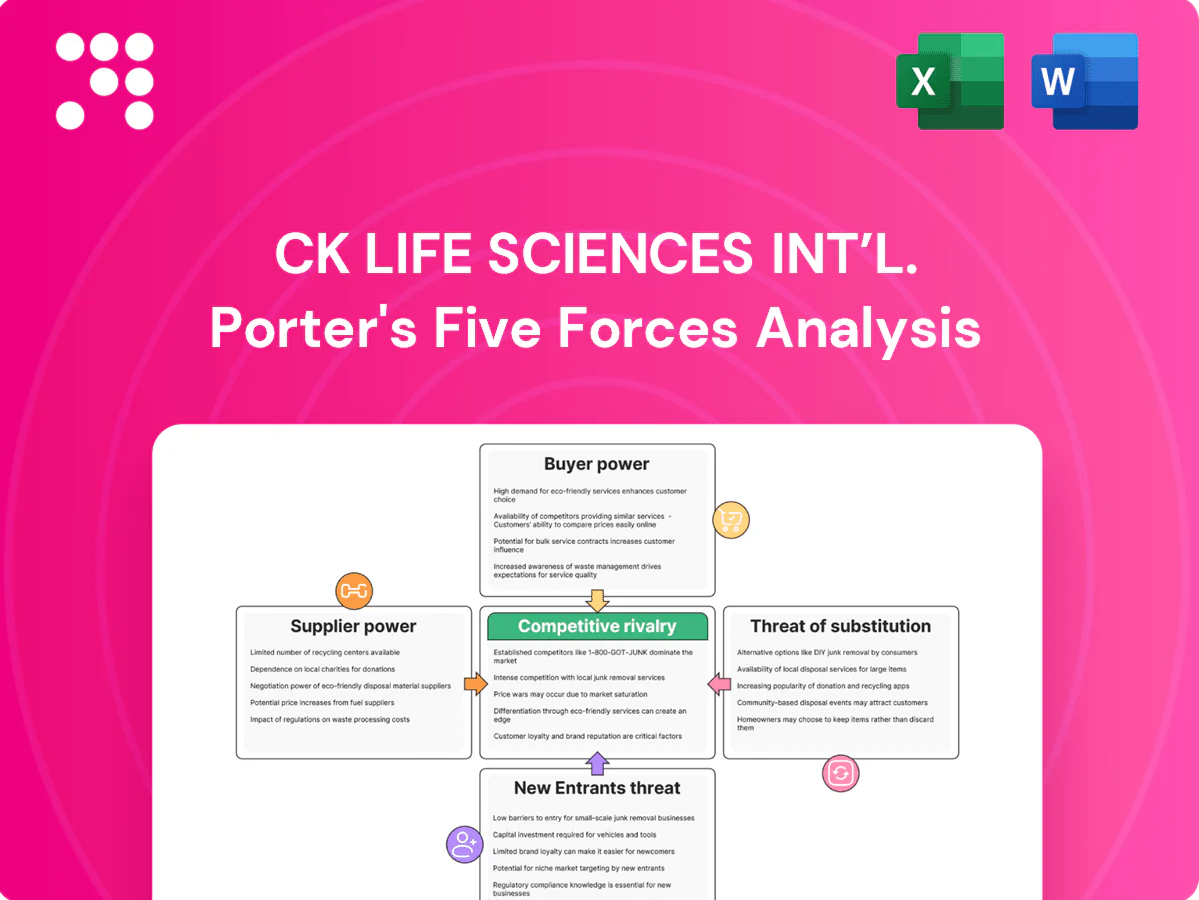
CK Life Sciences Int’l. Porter's Five Forces Analysis

Don't Miss the Bigger Picture
CK Life Sciences faces moderate supplier power and concentrated buyer segments, while regulatory scrutiny and R&D intensity heighten barriers to entry; substitutes and niche competitors shape pricing and growth prospects. This snapshot highlights strategic pressure points and tactical levers. Unlock the full Porter's Five Forces Analysis to get force-by-force ratings, visuals, and actionable guidance for investment or strategy.
Suppliers Bargaining Power

Specialized biotech inputs
CK Life Sciences relies on niche biological reagents, cultures and APIs with few qualified sources; the global biological reagents market was about US$44 billion in 2024, underscoring demand pressures. Supplier scarcity and stringent quality standards increase switching costs and lead times. Long-term quality agreements and dual-sourcing reduce but do not remove dependency. Any supplier disruption can delay R&D timelines and product launches.
CRO/CMO dependency
CK Life Sciences relies heavily on external CRO/CMO partners for trials and scale-up; industry CMO utilization averaged about 85% in 2024, enabling providers to charge small-batch premiums of 20–30% and raising supplier bargaining power over smaller programs. Adopting multi-vendor sourcing and selective in-house capacity lowers dependency but raises fixed costs; regulatory requirements for validated suppliers further constrain supplier switching.

Equipment and consumables
Bioprocess equipment and GMP consumables are sourced from a concentrated vendor base—major suppliers (Sartorius, Merck, Thermo Fisher) control over 60% of the market, with the single-use consumables market surpassing USD 5.5 billion in 2024. Validation and calibration create lock-in, raising switching costs and supplier leverage. Volume discounts exist but hinge on CK Life Sciences’ pipeline throughput. Supply shortages in 2024 propagated simultaneously across pharma and agri-bio supply chains.

IP and licensing holders
Access to patented platforms or traits forces CK Life Sciences to accept milestone and royalty structures that constrain margins and speed to market; licensors commonly enforce field-of-use restrictions and audit rights that limit commercial flexibility. Relying on externally sourced key assets reduces portfolio optionality and increases exposure to renegotiation risk, which can materially alter unit economics and delay market timelines. Strategic IP dependency elevates supplier bargaining power across R&D and commercialization stages.
- Milestone/royalty terms limit margins
- Field-of-use limits market scope
- Audit rights increase compliance burden
- External assets reduce optionality
- Renegotiations can shift unit economics and timing
Agri raw materials
Agri raw materials for bio-stimulants and crop protection need steady feedstocks; global crop protection was about USD 70bn in 2024 and bio-stimulants ~USD 4bn in 2024, intensifying demand. Seasonal variability and commodity swings (often 10–25% y/y in 2023–24) raise COGS, while supplier consolidation (top 4 firms ~50% share) concentrates power. Forward contracts and local sourcing damp volatility but add procurement complexity.
- Feedstock demand: crop protection USD 70bn; bio-stimulants USD 4bn (2024)
- Price swings: 10–25% y/y (2023–24)
- Consolidation: top 4 ~50% market share
- Mitigation: forward contracts, local sourcing (higher complexity)
Supplier leverage: US$44bn reagents, 20–30% small‑batch premiums
Suppliers exert high leverage: niche reagents market ~US$44bn (2024), concentrated vendors (>60%) and CMO utilization ~85% enable 20–30% small-batch premiums. IP licensors impose royalties/milestones and field limits, constraining margins and timing. Feedstock volatility (crop protection US$70bn; bio‑stimulants US$4bn; 10–25% y/y swings 2023–24) raises COGS and procurement complexity.
| Metric | 2024 |
|---|---|
| Reagents market | US$44bn |
| CMO utilization | ~85% |
| Consumables market | US$5.5bn |
| Crop protection | US$70bn |
| Bio‑stimulants | US$4bn |
What is included in the product
 Detailed Word Document
Tailored Porter’s Five Forces analysis for CK Life Sciences Int’l. uncovers competitive intensity, supplier/buyer power, threat of substitutes and entrants, and highlights disruptive threats and strategic levers to protect margins and market share.

 Customizable Excel Spreadsheet
A clear one-sheet Porter’s Five Forces summary for CK Life Sciences Int’l that highlights competitive pressures and relieves analysis bottlenecks for fast decision-making; customizable pressure levels and an instant spider chart make updates simple and ready to paste into pitch decks or broader Excel dashboards without complex tools.
Customers Bargaining Power

Healthcare payers and hospitals
Formularies and centralized tenders concentrate purchasing power—top five payers often control roughly 60–70% of commercial coverage in major markets (2024), forcing CK Life Sciences to win large, competitive bids. Evidence and pharmacoeconomic thresholds increasingly dictate price acceptance, with HTA-driven price cuts of 20–40% seen in some EU and APAC reimbursements. Lengthy negotiations extend sales cycles and compress margins while sudden reimbursement shifts can change product mix within 6–12 months.
Retailers and distributors
Retailers and distributors hold strong bargaining power for CK Life Sciences' nutraceuticals, with e-commerce accounting for about 22.3% of global retail sales in 2024, shifting leverage toward platforms. Slotting fees in key markets commonly range from 25,000 to 250,000 dollars per SKU, while private-label competition (circa high teens percent share in many markets) compresses pricing. Distributors often push 60–120 day payment terms. Omnichannel expansion eases but does not eliminate dependence.

Growers and agri dealers
Large grower networks and dealer co-ops extract strong volume rebates from suppliers, compressing margins for CK Life Sciences’ bio-based portfolio; the global crop protection market topped about 70 billion USD in 2024, concentrating buying power. Seasonal demand around planting windows amplifies price sensitivity, forcing promotional pricing. Demonstrable yield uplift from field trials and agronomic support is essential to justify premiums and defend value with distributors.

Global procurement standards
Buyers demand GMP, GLP and sustainability credentials, creating pass–fail dynamics where failure often leads to immediate delisting from major pharma and retail accounts; this forces CK Life Sciences to invest in compliance-capital and audit-ready processes. Certifications function as entry tickets for key accounts and as differentiators against smaller rivals unable to absorb certification costs, raising switching costs and strengthening buyer power negotiation thresholds.
- Compliance required: GMP, GLP, sustainability
- Failure consequence: immediate delisting from major accounts
- Investment need: certification and audit readiness
- Strategic edge: certifications versus smaller competitors
Information transparency
Buyers drive price pressure: top-5 payers control 60–70% coverage
Buyers wield high bargaining power: top-five payers control ~60–70% coverage (2024), driving competitive tenders and 20–40% HTA-driven price reductions in some markets. Retail/e‑commerce (22.3% of retail sales, 2024) and distributor terms compress margins. Certification requirements (GMP/GLP/sustainability) raise switching costs and force compliance investment.
| Metric | Value (2024) |
|---|---|
| Top-5 payer share | 60–70% |
| HTA price cuts | 20–40% |
| E-commerce retail share | 22.3% |
| Nutraceutical market size | >450B USD |
Same Document Delivered
CK Life Sciences Int’l. Porter's Five Forces Analysis
This preview shows the exact document you'll receive immediately after purchase—no surprises, no placeholders. The Porter’s Five Forces analysis for CK Life Sciences evaluates competitive rivalry in biotech, supplier and buyer bargaining power, threats from new entrants and substitutes, and regulatory influence on industry dynamics. It highlights strategic risks and opportunities for R&D investment, pricing, and partnership strategies.

Don't Miss the Bigger Picture
CK Life Sciences faces moderate supplier power and concentrated buyer segments, while regulatory scrutiny and R&D intensity heighten barriers to entry; substitutes and niche competitors shape pricing and growth prospects. This snapshot highlights strategic pressure points and tactical levers. Unlock the full Porter's Five Forces Analysis to get force-by-force ratings, visuals, and actionable guidance for investment or strategy.
Suppliers Bargaining Power
Specialized biotech inputs
CK Life Sciences relies on niche biological reagents, cultures and APIs with few qualified sources; the global biological reagents market was about US$44 billion in 2024, underscoring demand pressures. Supplier scarcity and stringent quality standards increase switching costs and lead times. Long-term quality agreements and dual-sourcing reduce but do not remove dependency. Any supplier disruption can delay R&D timelines and product launches.
CRO/CMO dependency
CK Life Sciences relies heavily on external CRO/CMO partners for trials and scale-up; industry CMO utilization averaged about 85% in 2024, enabling providers to charge small-batch premiums of 20–30% and raising supplier bargaining power over smaller programs. Adopting multi-vendor sourcing and selective in-house capacity lowers dependency but raises fixed costs; regulatory requirements for validated suppliers further constrain supplier switching.
Equipment and consumables
Bioprocess equipment and GMP consumables are sourced from a concentrated vendor base—major suppliers (Sartorius, Merck, Thermo Fisher) control over 60% of the market, with the single-use consumables market surpassing USD 5.5 billion in 2024. Validation and calibration create lock-in, raising switching costs and supplier leverage. Volume discounts exist but hinge on CK Life Sciences’ pipeline throughput. Supply shortages in 2024 propagated simultaneously across pharma and agri-bio supply chains.
IP and licensing holders
Access to patented platforms or traits forces CK Life Sciences to accept milestone and royalty structures that constrain margins and speed to market; licensors commonly enforce field-of-use restrictions and audit rights that limit commercial flexibility. Relying on externally sourced key assets reduces portfolio optionality and increases exposure to renegotiation risk, which can materially alter unit economics and delay market timelines. Strategic IP dependency elevates supplier bargaining power across R&D and commercialization stages.
- Milestone/royalty terms limit margins
- Field-of-use limits market scope
- Audit rights increase compliance burden
- External assets reduce optionality
- Renegotiations can shift unit economics and timing
Agri raw materials
Agri raw materials for bio-stimulants and crop protection need steady feedstocks; global crop protection was about USD 70bn in 2024 and bio-stimulants ~USD 4bn in 2024, intensifying demand. Seasonal variability and commodity swings (often 10–25% y/y in 2023–24) raise COGS, while supplier consolidation (top 4 firms ~50% share) concentrates power. Forward contracts and local sourcing damp volatility but add procurement complexity.
- Feedstock demand: crop protection USD 70bn; bio-stimulants USD 4bn (2024)
- Price swings: 10–25% y/y (2023–24)
- Consolidation: top 4 ~50% market share
- Mitigation: forward contracts, local sourcing (higher complexity)
Supplier leverage: US$44bn reagents, 20–30% small‑batch premiums
Suppliers exert high leverage: niche reagents market ~US$44bn (2024), concentrated vendors (>60%) and CMO utilization ~85% enable 20–30% small-batch premiums. IP licensors impose royalties/milestones and field limits, constraining margins and timing. Feedstock volatility (crop protection US$70bn; bio‑stimulants US$4bn; 10–25% y/y swings 2023–24) raises COGS and procurement complexity.
| Metric | 2024 |
|---|---|
| Reagents market | US$44bn |
| CMO utilization | ~85% |
| Consumables market | US$5.5bn |
| Crop protection | US$70bn |
| Bio‑stimulants | US$4bn |
What is included in the product
Detailed Word Document
Tailored Porter’s Five Forces analysis for CK Life Sciences Int’l. uncovers competitive intensity, supplier/buyer power, threat of substitutes and entrants, and highlights disruptive threats and strategic levers to protect margins and market share.
Customizable Excel Spreadsheet
A clear one-sheet Porter’s Five Forces summary for CK Life Sciences Int’l that highlights competitive pressures and relieves analysis bottlenecks for fast decision-making; customizable pressure levels and an instant spider chart make updates simple and ready to paste into pitch decks or broader Excel dashboards without complex tools.
Customers Bargaining Power
Healthcare payers and hospitals
Formularies and centralized tenders concentrate purchasing power—top five payers often control roughly 60–70% of commercial coverage in major markets (2024), forcing CK Life Sciences to win large, competitive bids. Evidence and pharmacoeconomic thresholds increasingly dictate price acceptance, with HTA-driven price cuts of 20–40% seen in some EU and APAC reimbursements. Lengthy negotiations extend sales cycles and compress margins while sudden reimbursement shifts can change product mix within 6–12 months.
Retailers and distributors
Retailers and distributors hold strong bargaining power for CK Life Sciences' nutraceuticals, with e-commerce accounting for about 22.3% of global retail sales in 2024, shifting leverage toward platforms. Slotting fees in key markets commonly range from 25,000 to 250,000 dollars per SKU, while private-label competition (circa high teens percent share in many markets) compresses pricing. Distributors often push 60–120 day payment terms. Omnichannel expansion eases but does not eliminate dependence.
Growers and agri dealers
Large grower networks and dealer co-ops extract strong volume rebates from suppliers, compressing margins for CK Life Sciences’ bio-based portfolio; the global crop protection market topped about 70 billion USD in 2024, concentrating buying power. Seasonal demand around planting windows amplifies price sensitivity, forcing promotional pricing. Demonstrable yield uplift from field trials and agronomic support is essential to justify premiums and defend value with distributors.
Global procurement standards
Buyers demand GMP, GLP and sustainability credentials, creating pass–fail dynamics where failure often leads to immediate delisting from major pharma and retail accounts; this forces CK Life Sciences to invest in compliance-capital and audit-ready processes. Certifications function as entry tickets for key accounts and as differentiators against smaller rivals unable to absorb certification costs, raising switching costs and strengthening buyer power negotiation thresholds.
- Compliance required: GMP, GLP, sustainability
- Failure consequence: immediate delisting from major accounts
- Investment need: certification and audit readiness
- Strategic edge: certifications versus smaller competitors
Information transparency
Buyers drive price pressure: top-5 payers control 60–70% coverage
Buyers wield high bargaining power: top-five payers control ~60–70% coverage (2024), driving competitive tenders and 20–40% HTA-driven price reductions in some markets. Retail/e‑commerce (22.3% of retail sales, 2024) and distributor terms compress margins. Certification requirements (GMP/GLP/sustainability) raise switching costs and force compliance investment.
| Metric | Value (2024) |
|---|---|
| Top-5 payer share | 60–70% |
| HTA price cuts | 20–40% |
| E-commerce retail share | 22.3% |
| Nutraceutical market size | >450B USD |
Same Document Delivered
CK Life Sciences Int’l. Porter's Five Forces Analysis
This preview shows the exact document you'll receive immediately after purchase—no surprises, no placeholders. The Porter’s Five Forces analysis for CK Life Sciences evaluates competitive rivalry in biotech, supplier and buyer bargaining power, threats from new entrants and substitutes, and regulatory influence on industry dynamics. It highlights strategic risks and opportunities for R&D investment, pricing, and partnership strategies.
Original: $10.00
-65%$10.00
$3.50Description
Don't Miss the Bigger Picture
CK Life Sciences faces moderate supplier power and concentrated buyer segments, while regulatory scrutiny and R&D intensity heighten barriers to entry; substitutes and niche competitors shape pricing and growth prospects. This snapshot highlights strategic pressure points and tactical levers. Unlock the full Porter's Five Forces Analysis to get force-by-force ratings, visuals, and actionable guidance for investment or strategy.
Suppliers Bargaining Power
Specialized biotech inputs
CK Life Sciences relies on niche biological reagents, cultures and APIs with few qualified sources; the global biological reagents market was about US$44 billion in 2024, underscoring demand pressures. Supplier scarcity and stringent quality standards increase switching costs and lead times. Long-term quality agreements and dual-sourcing reduce but do not remove dependency. Any supplier disruption can delay R&D timelines and product launches.
CRO/CMO dependency
CK Life Sciences relies heavily on external CRO/CMO partners for trials and scale-up; industry CMO utilization averaged about 85% in 2024, enabling providers to charge small-batch premiums of 20–30% and raising supplier bargaining power over smaller programs. Adopting multi-vendor sourcing and selective in-house capacity lowers dependency but raises fixed costs; regulatory requirements for validated suppliers further constrain supplier switching.
Equipment and consumables
Bioprocess equipment and GMP consumables are sourced from a concentrated vendor base—major suppliers (Sartorius, Merck, Thermo Fisher) control over 60% of the market, with the single-use consumables market surpassing USD 5.5 billion in 2024. Validation and calibration create lock-in, raising switching costs and supplier leverage. Volume discounts exist but hinge on CK Life Sciences’ pipeline throughput. Supply shortages in 2024 propagated simultaneously across pharma and agri-bio supply chains.
IP and licensing holders
Access to patented platforms or traits forces CK Life Sciences to accept milestone and royalty structures that constrain margins and speed to market; licensors commonly enforce field-of-use restrictions and audit rights that limit commercial flexibility. Relying on externally sourced key assets reduces portfolio optionality and increases exposure to renegotiation risk, which can materially alter unit economics and delay market timelines. Strategic IP dependency elevates supplier bargaining power across R&D and commercialization stages.
- Milestone/royalty terms limit margins
- Field-of-use limits market scope
- Audit rights increase compliance burden
- External assets reduce optionality
- Renegotiations can shift unit economics and timing
Agri raw materials
Agri raw materials for bio-stimulants and crop protection need steady feedstocks; global crop protection was about USD 70bn in 2024 and bio-stimulants ~USD 4bn in 2024, intensifying demand. Seasonal variability and commodity swings (often 10–25% y/y in 2023–24) raise COGS, while supplier consolidation (top 4 firms ~50% share) concentrates power. Forward contracts and local sourcing damp volatility but add procurement complexity.
- Feedstock demand: crop protection USD 70bn; bio-stimulants USD 4bn (2024)
- Price swings: 10–25% y/y (2023–24)
- Consolidation: top 4 ~50% market share
- Mitigation: forward contracts, local sourcing (higher complexity)
Supplier leverage: US$44bn reagents, 20–30% small‑batch premiums
Suppliers exert high leverage: niche reagents market ~US$44bn (2024), concentrated vendors (>60%) and CMO utilization ~85% enable 20–30% small-batch premiums. IP licensors impose royalties/milestones and field limits, constraining margins and timing. Feedstock volatility (crop protection US$70bn; bio‑stimulants US$4bn; 10–25% y/y swings 2023–24) raises COGS and procurement complexity.
| Metric | 2024 |
|---|---|
| Reagents market | US$44bn |
| CMO utilization | ~85% |
| Consumables market | US$5.5bn |
| Crop protection | US$70bn |
| Bio‑stimulants | US$4bn |
What is included in the product
Detailed Word Document
Tailored Porter’s Five Forces analysis for CK Life Sciences Int’l. uncovers competitive intensity, supplier/buyer power, threat of substitutes and entrants, and highlights disruptive threats and strategic levers to protect margins and market share.
Customizable Excel Spreadsheet
A clear one-sheet Porter’s Five Forces summary for CK Life Sciences Int’l that highlights competitive pressures and relieves analysis bottlenecks for fast decision-making; customizable pressure levels and an instant spider chart make updates simple and ready to paste into pitch decks or broader Excel dashboards without complex tools.
Customers Bargaining Power
Healthcare payers and hospitals
Formularies and centralized tenders concentrate purchasing power—top five payers often control roughly 60–70% of commercial coverage in major markets (2024), forcing CK Life Sciences to win large, competitive bids. Evidence and pharmacoeconomic thresholds increasingly dictate price acceptance, with HTA-driven price cuts of 20–40% seen in some EU and APAC reimbursements. Lengthy negotiations extend sales cycles and compress margins while sudden reimbursement shifts can change product mix within 6–12 months.
Retailers and distributors
Retailers and distributors hold strong bargaining power for CK Life Sciences' nutraceuticals, with e-commerce accounting for about 22.3% of global retail sales in 2024, shifting leverage toward platforms. Slotting fees in key markets commonly range from 25,000 to 250,000 dollars per SKU, while private-label competition (circa high teens percent share in many markets) compresses pricing. Distributors often push 60–120 day payment terms. Omnichannel expansion eases but does not eliminate dependence.
Growers and agri dealers
Large grower networks and dealer co-ops extract strong volume rebates from suppliers, compressing margins for CK Life Sciences’ bio-based portfolio; the global crop protection market topped about 70 billion USD in 2024, concentrating buying power. Seasonal demand around planting windows amplifies price sensitivity, forcing promotional pricing. Demonstrable yield uplift from field trials and agronomic support is essential to justify premiums and defend value with distributors.
Global procurement standards
Buyers demand GMP, GLP and sustainability credentials, creating pass–fail dynamics where failure often leads to immediate delisting from major pharma and retail accounts; this forces CK Life Sciences to invest in compliance-capital and audit-ready processes. Certifications function as entry tickets for key accounts and as differentiators against smaller rivals unable to absorb certification costs, raising switching costs and strengthening buyer power negotiation thresholds.
- Compliance required: GMP, GLP, sustainability
- Failure consequence: immediate delisting from major accounts
- Investment need: certification and audit readiness
- Strategic edge: certifications versus smaller competitors
Information transparency
Buyers drive price pressure: top-5 payers control 60–70% coverage
Buyers wield high bargaining power: top-five payers control ~60–70% coverage (2024), driving competitive tenders and 20–40% HTA-driven price reductions in some markets. Retail/e‑commerce (22.3% of retail sales, 2024) and distributor terms compress margins. Certification requirements (GMP/GLP/sustainability) raise switching costs and force compliance investment.
| Metric | Value (2024) |
|---|---|
| Top-5 payer share | 60–70% |
| HTA price cuts | 20–40% |
| E-commerce retail share | 22.3% |
| Nutraceutical market size | >450B USD |
Same Document Delivered
CK Life Sciences Int’l. Porter's Five Forces Analysis
This preview shows the exact document you'll receive immediately after purchase—no surprises, no placeholders. The Porter’s Five Forces analysis for CK Life Sciences evaluates competitive rivalry in biotech, supplier and buyer bargaining power, threats from new entrants and substitutes, and regulatory influence on industry dynamics. It highlights strategic risks and opportunities for R&D investment, pricing, and partnership strategies.











