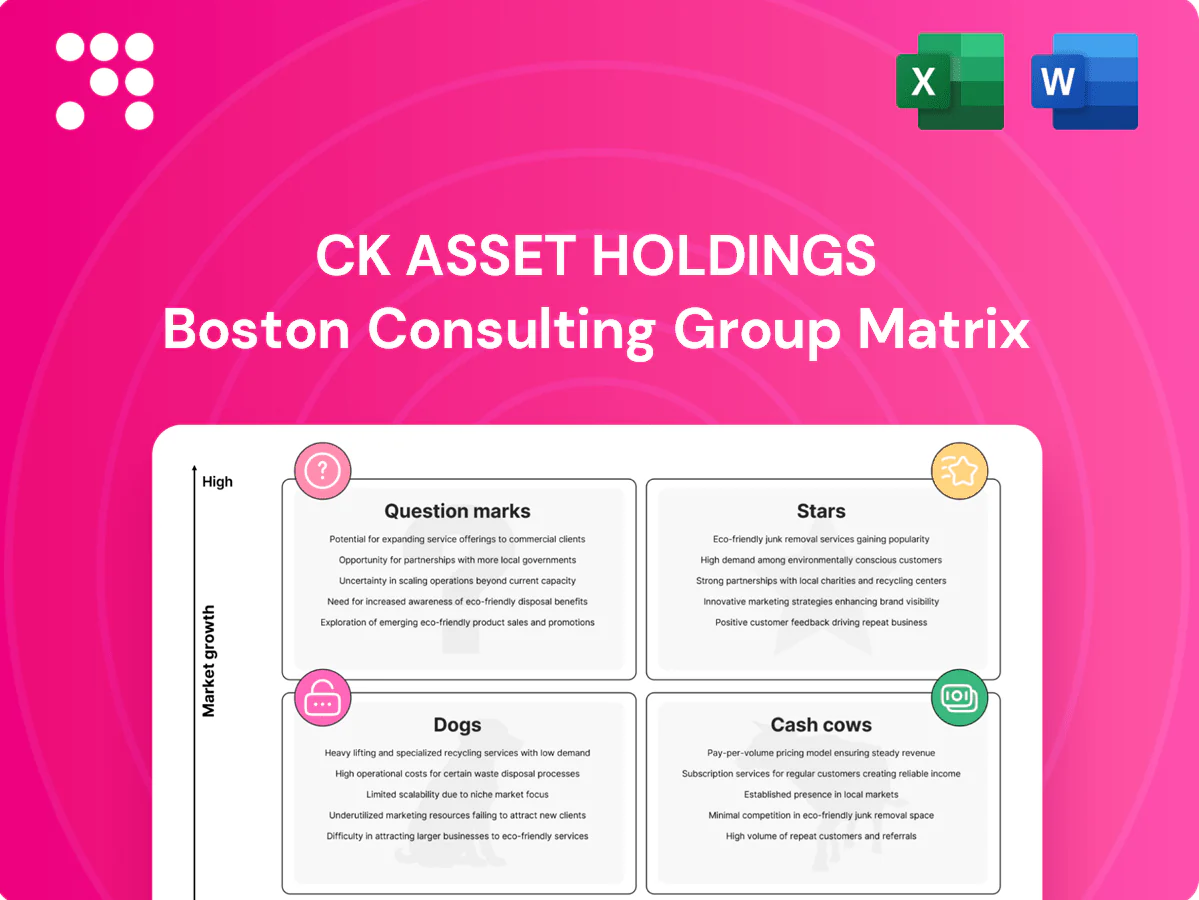
CK Asset Holdings Boston Consulting Group Matrix

Unlock Strategic Clarity
Curious where CK Asset Holdings’ businesses fall—Stars, Cash Cows, Dogs or Question Marks? This preview scratches the surface; buy the full BCG Matrix for quadrant-by-quadrant placement, data-backed recommendations, and clear strategic next steps. Get instant access in Word + Excel and stop guessing—plan where to invest, divest, or defend with confidence.
Stars

HK premium residential launches
CK Asset’s HK premium residential launches in 2024 recorded sell-through rates above 70% in the first month and headline gross margins near 30%, underpinning their classification as Stars in the BCG matrix.
The group holds a leading share of the Hong Kong primary market by value (circa 15%) and strong brand pull, yet continues heavy spend on marketing and placements to sustain rapid absorption.
At this growth clip cash in equals cash out as sales proceeds fund land and capex, so ongoing investment is required to lock the pipeline and defend price leadership.
Mainland tier‑1 mixed‑use developments
Mainland tier‑1 mixed‑use Stars cluster around Shanghai (population ~24.9m) and Shenzhen (~17.6m), where placemaking near transit keeps demand and market share high. They require large pre‑sale engines and rigorous on‑the‑ground execution, with working capital burned quickly as inventory turns fast. Nurture them now; once the cycle cools these assets can become stable cash cows.

Core CBD offices & prime retail (HK)
Core CBD offices and prime retail assets are flagship investments for CK Asset, recording near-full occupancy and strong rental reversion in 2024 amid a recovering Hong Kong market. Market share and public visibility remain high, though ongoing capex and tenant incentives are material to sustain tenancy. Active promotion and branded events continue to drive footfall; strategy: hold and pursue selective upgrades to cement leadership.

UK/Europe build‑to‑rent platforms
UK/Europe build‑to‑rent benefits from structural rental demand—private rented sector is about 20% of UK households (ONS)—and strong institutional capital interest, with pension and insurance allocations growing. CK’s scale allows sourcing land, development and operating synergies, though upfront capex for operating setup and leasing is required; unit economics improve as portfolio density rises, so double down while consolidation continues.
- Structural demand: PRS ~20% of UK households (ONS)
- Capital: rising institutional allocations to BTR across Europe
- CK edge: scale lowers land, construction and ops costs; density improves unit economics
- Action: increase investment during market consolidation
Hospitality in gateway cities
Hospitality in gateway cities is a Star for CK Asset: RevPAR rose c.70% y/y and ADR c.40% in 2023–24 across core markets, helping CK’s centrally located assets punch above their weight. Brand marketing and refurb cycles consume cash in this growth phase, and pipeline additions need careful pacing. Invest through the upswing to capture share before rates normalize.
- RevPAR +70% y/y (2023–24)
- ADR +40% (2023–24)
- Refurb & marketing = cash drain
- Pipeline pacing required to avoid oversupply
HK premium sell-through >70% with ~30% margin; hospitality RevPAR +70%
CK Asset Stars: HK premium launches 2024 sell-through >70% month-one, headline gross margin ~30% and c.15% market share, driving rapid cash recycling. Mainland tier‑1 mixed‑use (Shanghai pop 24.9m; Shenzhen 17.6m) show high absorption but burn working capital. UK BTR benefits from PRS ~20% of households; unit economics improve with scale. Hospitality RevPAR +70% y/y, ADR +40% (2023–24).
| Asset | Key metric | 2024 |
|---|---|---|
| HK residential | Sell-through / margin | >70% / ~30% |
| Mainland mixed-use | Market cities | Shanghai 24.9m; Shenzhen 17.6m |
| Hospitality | RevPAR / ADR | +70% / +40% |
What is included in the product
 Detailed Word Document
Maps CK Asset units into Stars, Cash Cows, Question Marks and Dogs with investment guidance, risks and trend context.

 Customizable Excel Spreadsheet
One-page CK Asset BCG matrix placing each business unit in a quadrant for fast portfolio clarity.
Cash Cows

Stabilized HK investment properties
Stabilized HK investment properties form CK Asset’s cash cows: mature office towers and retail malls with entrenched tenants delivering predictable cash flow in 2024. Low growth but high market share sustains steady margins; management minimizes promotion spending and focuses on operational efficiency and lease-mix optimization. These assets are milked to fund new development pipelines and tech investments.
Property & project management services
Property & project management services are fee-based and asset-light, delivering sticky contracts and predictable cash flow; in 2024 the segment showed modest growth with low churn. Margins benefit from scale and cross-sell across CK Asset’s portfolio, improving operating leverage. Focus for optimization: upgrade systems, digitize workflows and expand wallet share per site to lift ancillary revenue and EBITDA per asset.

Infrastructure & utility stakes
Infrastructure and utility stakes in CK Asset act as defensive cash cows, delivering inflation-linked, predictable cash yields with low ongoing capex once assets are stabilized; payouts are reliable and support group distributions. These holdings are not high-growth but sustainably fund development and investment across the portfolio. Maintain asset condition, refinance opportunistically, and prioritize dividend harvest to maximize shareholder returns.

Long‑lease logistics/industrial parks
Long‑lease logistics/industrial parks form cash cows for CK Asset, with high occupancy in 2024, covenant‑strong tenants and steady contractual escalators delivering predictable rental income and strong cash conversion.
Market growth in 2024 was moderate while CK Asset’s share in prime logistics stock remains solid, requiring limited promotional spend; targeted incremental capex enhances NOI and cash flow per asset.
- Occupancy: high (2024)
- Tenants: covenant‑strong
- Escalators: steady
- Market growth: moderate
- Capex: incremental → NOI/cash flow uplift
Legacy hotels with steady corporate mix
Legacy hotels within CK Asset deliver stable occupancy—Hong Kong hotel occupancy averaged 74% in 2023 (Hong Kong Tourism Board)—driven by repeat corporate and airline contracts; growth is flat but cash generation is clean, enabling tight opex control and targeted room refreshes to maintain yield.
- Stable occupancy: 74% (HKTB 2023)
- Flat growth, strong cash generation
- Keep opex lean; refresh rooms
- Use surplus to back higher‑beta bets
Stabilized HK assets and fee-based services deliver steady cash flow and low promotion spend
Stabilized HK investment properties, fee‑based property services, infrastructure stakes, logistics parks and legacy hotels act as CK Asset cash cows in 2024, delivering predictable cash flow, high occupancy and low promotion spend; surplus funds development pipelines and tech investments.
| Asset | Characteristic | Note |
|---|---|---|
| HK investment props | Predictable rents | 2024 steady cash flow |
| Property services | Fee-based, sticky | Low churn |
| Infrastructure | Inflation-linked yields | Defensive |
| Hotels | Stable occupancy | HK 74% (2023) |
What You’re Viewing Is Included
CK Asset Holdings BCG Matrix
The file you’re previewing is the exact CK Asset Holdings BCG Matrix report you’ll receive after purchase — no watermarks, no demo text, just the finished, professionally formatted analysis. It’s crafted for clarity and decision-making, ready to edit, print, or present. Buy once and download immediately; what you see is what you get, no surprises.

Unlock Strategic Clarity
Curious where CK Asset Holdings’ businesses fall—Stars, Cash Cows, Dogs or Question Marks? This preview scratches the surface; buy the full BCG Matrix for quadrant-by-quadrant placement, data-backed recommendations, and clear strategic next steps. Get instant access in Word + Excel and stop guessing—plan where to invest, divest, or defend with confidence.
Stars
HK premium residential launches
CK Asset’s HK premium residential launches in 2024 recorded sell-through rates above 70% in the first month and headline gross margins near 30%, underpinning their classification as Stars in the BCG matrix.
The group holds a leading share of the Hong Kong primary market by value (circa 15%) and strong brand pull, yet continues heavy spend on marketing and placements to sustain rapid absorption.
At this growth clip cash in equals cash out as sales proceeds fund land and capex, so ongoing investment is required to lock the pipeline and defend price leadership.
Mainland tier‑1 mixed‑use developments
Mainland tier‑1 mixed‑use Stars cluster around Shanghai (population ~24.9m) and Shenzhen (~17.6m), where placemaking near transit keeps demand and market share high. They require large pre‑sale engines and rigorous on‑the‑ground execution, with working capital burned quickly as inventory turns fast. Nurture them now; once the cycle cools these assets can become stable cash cows.
Core CBD offices & prime retail (HK)
Core CBD offices and prime retail assets are flagship investments for CK Asset, recording near-full occupancy and strong rental reversion in 2024 amid a recovering Hong Kong market. Market share and public visibility remain high, though ongoing capex and tenant incentives are material to sustain tenancy. Active promotion and branded events continue to drive footfall; strategy: hold and pursue selective upgrades to cement leadership.
UK/Europe build‑to‑rent platforms
UK/Europe build‑to‑rent benefits from structural rental demand—private rented sector is about 20% of UK households (ONS)—and strong institutional capital interest, with pension and insurance allocations growing. CK’s scale allows sourcing land, development and operating synergies, though upfront capex for operating setup and leasing is required; unit economics improve as portfolio density rises, so double down while consolidation continues.
- Structural demand: PRS ~20% of UK households (ONS)
- Capital: rising institutional allocations to BTR across Europe
- CK edge: scale lowers land, construction and ops costs; density improves unit economics
- Action: increase investment during market consolidation
Hospitality in gateway cities
Hospitality in gateway cities is a Star for CK Asset: RevPAR rose c.70% y/y and ADR c.40% in 2023–24 across core markets, helping CK’s centrally located assets punch above their weight. Brand marketing and refurb cycles consume cash in this growth phase, and pipeline additions need careful pacing. Invest through the upswing to capture share before rates normalize.
- RevPAR +70% y/y (2023–24)
- ADR +40% (2023–24)
- Refurb & marketing = cash drain
- Pipeline pacing required to avoid oversupply
HK premium sell-through >70% with ~30% margin; hospitality RevPAR +70%
CK Asset Stars: HK premium launches 2024 sell-through >70% month-one, headline gross margin ~30% and c.15% market share, driving rapid cash recycling. Mainland tier‑1 mixed‑use (Shanghai pop 24.9m; Shenzhen 17.6m) show high absorption but burn working capital. UK BTR benefits from PRS ~20% of households; unit economics improve with scale. Hospitality RevPAR +70% y/y, ADR +40% (2023–24).
| Asset | Key metric | 2024 |
|---|---|---|
| HK residential | Sell-through / margin | >70% / ~30% |
| Mainland mixed-use | Market cities | Shanghai 24.9m; Shenzhen 17.6m |
| Hospitality | RevPAR / ADR | +70% / +40% |
What is included in the product
Detailed Word Document
Maps CK Asset units into Stars, Cash Cows, Question Marks and Dogs with investment guidance, risks and trend context.
Customizable Excel Spreadsheet
One-page CK Asset BCG matrix placing each business unit in a quadrant for fast portfolio clarity.
Cash Cows
Stabilized HK investment properties
Stabilized HK investment properties form CK Asset’s cash cows: mature office towers and retail malls with entrenched tenants delivering predictable cash flow in 2024. Low growth but high market share sustains steady margins; management minimizes promotion spending and focuses on operational efficiency and lease-mix optimization. These assets are milked to fund new development pipelines and tech investments.
Property & project management services
Property & project management services are fee-based and asset-light, delivering sticky contracts and predictable cash flow; in 2024 the segment showed modest growth with low churn. Margins benefit from scale and cross-sell across CK Asset’s portfolio, improving operating leverage. Focus for optimization: upgrade systems, digitize workflows and expand wallet share per site to lift ancillary revenue and EBITDA per asset.
Infrastructure & utility stakes
Infrastructure and utility stakes in CK Asset act as defensive cash cows, delivering inflation-linked, predictable cash yields with low ongoing capex once assets are stabilized; payouts are reliable and support group distributions. These holdings are not high-growth but sustainably fund development and investment across the portfolio. Maintain asset condition, refinance opportunistically, and prioritize dividend harvest to maximize shareholder returns.
Long‑lease logistics/industrial parks
Long‑lease logistics/industrial parks form cash cows for CK Asset, with high occupancy in 2024, covenant‑strong tenants and steady contractual escalators delivering predictable rental income and strong cash conversion.
Market growth in 2024 was moderate while CK Asset’s share in prime logistics stock remains solid, requiring limited promotional spend; targeted incremental capex enhances NOI and cash flow per asset.
- Occupancy: high (2024)
- Tenants: covenant‑strong
- Escalators: steady
- Market growth: moderate
- Capex: incremental → NOI/cash flow uplift
Legacy hotels with steady corporate mix
Legacy hotels within CK Asset deliver stable occupancy—Hong Kong hotel occupancy averaged 74% in 2023 (Hong Kong Tourism Board)—driven by repeat corporate and airline contracts; growth is flat but cash generation is clean, enabling tight opex control and targeted room refreshes to maintain yield.
- Stable occupancy: 74% (HKTB 2023)
- Flat growth, strong cash generation
- Keep opex lean; refresh rooms
- Use surplus to back higher‑beta bets
Stabilized HK assets and fee-based services deliver steady cash flow and low promotion spend
Stabilized HK investment properties, fee‑based property services, infrastructure stakes, logistics parks and legacy hotels act as CK Asset cash cows in 2024, delivering predictable cash flow, high occupancy and low promotion spend; surplus funds development pipelines and tech investments.
| Asset | Characteristic | Note |
|---|---|---|
| HK investment props | Predictable rents | 2024 steady cash flow |
| Property services | Fee-based, sticky | Low churn |
| Infrastructure | Inflation-linked yields | Defensive |
| Hotels | Stable occupancy | HK 74% (2023) |
What You’re Viewing Is Included
CK Asset Holdings BCG Matrix
The file you’re previewing is the exact CK Asset Holdings BCG Matrix report you’ll receive after purchase — no watermarks, no demo text, just the finished, professionally formatted analysis. It’s crafted for clarity and decision-making, ready to edit, print, or present. Buy once and download immediately; what you see is what you get, no surprises.
Description
Unlock Strategic Clarity
Curious where CK Asset Holdings’ businesses fall—Stars, Cash Cows, Dogs or Question Marks? This preview scratches the surface; buy the full BCG Matrix for quadrant-by-quadrant placement, data-backed recommendations, and clear strategic next steps. Get instant access in Word + Excel and stop guessing—plan where to invest, divest, or defend with confidence.
Stars
HK premium residential launches
CK Asset’s HK premium residential launches in 2024 recorded sell-through rates above 70% in the first month and headline gross margins near 30%, underpinning their classification as Stars in the BCG matrix.
The group holds a leading share of the Hong Kong primary market by value (circa 15%) and strong brand pull, yet continues heavy spend on marketing and placements to sustain rapid absorption.
At this growth clip cash in equals cash out as sales proceeds fund land and capex, so ongoing investment is required to lock the pipeline and defend price leadership.
Mainland tier‑1 mixed‑use developments
Mainland tier‑1 mixed‑use Stars cluster around Shanghai (population ~24.9m) and Shenzhen (~17.6m), where placemaking near transit keeps demand and market share high. They require large pre‑sale engines and rigorous on‑the‑ground execution, with working capital burned quickly as inventory turns fast. Nurture them now; once the cycle cools these assets can become stable cash cows.
Core CBD offices & prime retail (HK)
Core CBD offices and prime retail assets are flagship investments for CK Asset, recording near-full occupancy and strong rental reversion in 2024 amid a recovering Hong Kong market. Market share and public visibility remain high, though ongoing capex and tenant incentives are material to sustain tenancy. Active promotion and branded events continue to drive footfall; strategy: hold and pursue selective upgrades to cement leadership.
UK/Europe build‑to‑rent platforms
UK/Europe build‑to‑rent benefits from structural rental demand—private rented sector is about 20% of UK households (ONS)—and strong institutional capital interest, with pension and insurance allocations growing. CK’s scale allows sourcing land, development and operating synergies, though upfront capex for operating setup and leasing is required; unit economics improve as portfolio density rises, so double down while consolidation continues.
- Structural demand: PRS ~20% of UK households (ONS)
- Capital: rising institutional allocations to BTR across Europe
- CK edge: scale lowers land, construction and ops costs; density improves unit economics
- Action: increase investment during market consolidation
Hospitality in gateway cities
Hospitality in gateway cities is a Star for CK Asset: RevPAR rose c.70% y/y and ADR c.40% in 2023–24 across core markets, helping CK’s centrally located assets punch above their weight. Brand marketing and refurb cycles consume cash in this growth phase, and pipeline additions need careful pacing. Invest through the upswing to capture share before rates normalize.
- RevPAR +70% y/y (2023–24)
- ADR +40% (2023–24)
- Refurb & marketing = cash drain
- Pipeline pacing required to avoid oversupply
HK premium sell-through >70% with ~30% margin; hospitality RevPAR +70%
CK Asset Stars: HK premium launches 2024 sell-through >70% month-one, headline gross margin ~30% and c.15% market share, driving rapid cash recycling. Mainland tier‑1 mixed‑use (Shanghai pop 24.9m; Shenzhen 17.6m) show high absorption but burn working capital. UK BTR benefits from PRS ~20% of households; unit economics improve with scale. Hospitality RevPAR +70% y/y, ADR +40% (2023–24).
| Asset | Key metric | 2024 |
|---|---|---|
| HK residential | Sell-through / margin | >70% / ~30% |
| Mainland mixed-use | Market cities | Shanghai 24.9m; Shenzhen 17.6m |
| Hospitality | RevPAR / ADR | +70% / +40% |
What is included in the product
Detailed Word Document
Maps CK Asset units into Stars, Cash Cows, Question Marks and Dogs with investment guidance, risks and trend context.
Customizable Excel Spreadsheet
One-page CK Asset BCG matrix placing each business unit in a quadrant for fast portfolio clarity.
Cash Cows
Stabilized HK investment properties
Stabilized HK investment properties form CK Asset’s cash cows: mature office towers and retail malls with entrenched tenants delivering predictable cash flow in 2024. Low growth but high market share sustains steady margins; management minimizes promotion spending and focuses on operational efficiency and lease-mix optimization. These assets are milked to fund new development pipelines and tech investments.
Property & project management services
Property & project management services are fee-based and asset-light, delivering sticky contracts and predictable cash flow; in 2024 the segment showed modest growth with low churn. Margins benefit from scale and cross-sell across CK Asset’s portfolio, improving operating leverage. Focus for optimization: upgrade systems, digitize workflows and expand wallet share per site to lift ancillary revenue and EBITDA per asset.
Infrastructure & utility stakes
Infrastructure and utility stakes in CK Asset act as defensive cash cows, delivering inflation-linked, predictable cash yields with low ongoing capex once assets are stabilized; payouts are reliable and support group distributions. These holdings are not high-growth but sustainably fund development and investment across the portfolio. Maintain asset condition, refinance opportunistically, and prioritize dividend harvest to maximize shareholder returns.
Long‑lease logistics/industrial parks
Long‑lease logistics/industrial parks form cash cows for CK Asset, with high occupancy in 2024, covenant‑strong tenants and steady contractual escalators delivering predictable rental income and strong cash conversion.
Market growth in 2024 was moderate while CK Asset’s share in prime logistics stock remains solid, requiring limited promotional spend; targeted incremental capex enhances NOI and cash flow per asset.
- Occupancy: high (2024)
- Tenants: covenant‑strong
- Escalators: steady
- Market growth: moderate
- Capex: incremental → NOI/cash flow uplift
Legacy hotels with steady corporate mix
Legacy hotels within CK Asset deliver stable occupancy—Hong Kong hotel occupancy averaged 74% in 2023 (Hong Kong Tourism Board)—driven by repeat corporate and airline contracts; growth is flat but cash generation is clean, enabling tight opex control and targeted room refreshes to maintain yield.
- Stable occupancy: 74% (HKTB 2023)
- Flat growth, strong cash generation
- Keep opex lean; refresh rooms
- Use surplus to back higher‑beta bets
Stabilized HK assets and fee-based services deliver steady cash flow and low promotion spend
Stabilized HK investment properties, fee‑based property services, infrastructure stakes, logistics parks and legacy hotels act as CK Asset cash cows in 2024, delivering predictable cash flow, high occupancy and low promotion spend; surplus funds development pipelines and tech investments.
| Asset | Characteristic | Note |
|---|---|---|
| HK investment props | Predictable rents | 2024 steady cash flow |
| Property services | Fee-based, sticky | Low churn |
| Infrastructure | Inflation-linked yields | Defensive |
| Hotels | Stable occupancy | HK 74% (2023) |
What You’re Viewing Is Included
CK Asset Holdings BCG Matrix
The file you’re previewing is the exact CK Asset Holdings BCG Matrix report you’ll receive after purchase — no watermarks, no demo text, just the finished, professionally formatted analysis. It’s crafted for clarity and decision-making, ready to edit, print, or present. Buy once and download immediately; what you see is what you get, no surprises.











