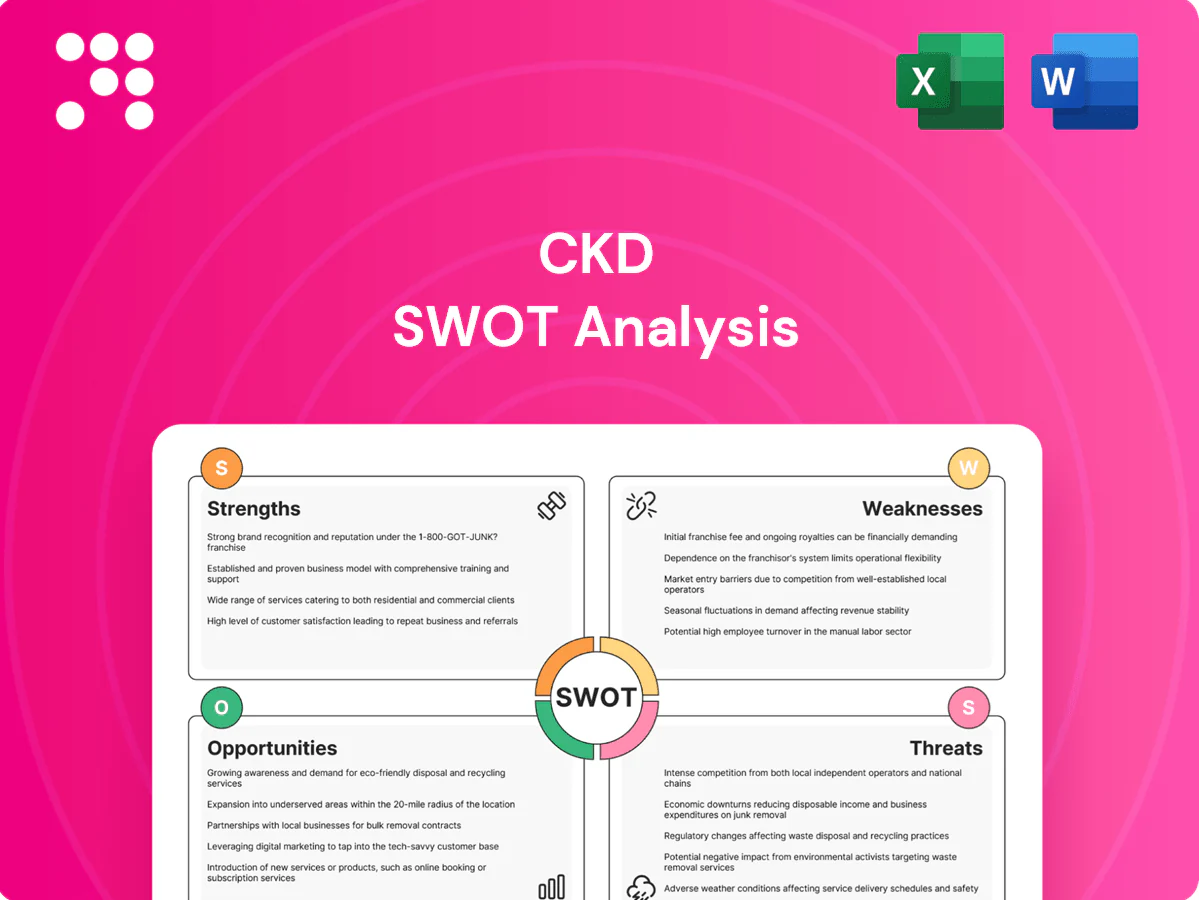
CKD SWOT Analysis

Elevate Your Analysis with the Complete SWOT Report
CKD’s SWOT snapshot highlights solid technical expertise and market footholds but also flags supply-chain exposure and intensifying competition; strategic moves now will shape long-term value. Want the full strategic picture and prioritized actions? Purchase the complete SWOT analysis for a professional, editable report and Excel matrix to support investment, planning, and pitches.
Strengths

Broad automation portfolio
CKDs broad automation portfolio spans pneumatic components, drives and fluid control, delivering end-to-end factory automation and reducing vendor fragmentation and integration risk for customers. Cross-selling across these lines has driven higher wallet share and stickiness, supporting CKDs over 100bn JPY consolidated sales in recent fiscal reporting. The product breadth enables deep customization across diverse industrial use cases.
Engineering and manufacturing depth
Engineering-to-production depth enables CKD to deliver reliable, precise and durable components, shortening development cycles and improving field uptime. Process know-how in pneumatics and fluid systems sustains performance in harsh operating environments. A strong quality reputation lowers customer downtime and total cost of ownership. These strengths underpin stable, long-term OEM relationships.

Labor-saving machinery expertise
Proprietary labor-saving equipment delivers system-level gains—McKinsey estimates up to 30% productivity uplift—addressing productivity, cost, and workforce constraints. Integrating components with machinery creates measurable system advantages and shorter commissioning times. Demonstrable ROI (typical payback 12–24 months) supports premium pricing (often 10–15% above commodity kit) and drives accelerated adoption in modernized factories.

Diversification into life sciences
CKD's move into life sciences leverages fine-system components to shift revenue away from cyclical industrial demand; the global medical device market exceeded $500 billion in 2023, offering sizable regulated-market opportunity. Precision, cleanliness and reliability credentials unlock higher-spec contracts, knowledge transfer raises product performance across segments and helps smooth cash flows.
- Diversifies revenue
- Access to >$500B market (2023)
- Regulated-market margins
- Cross-segment R&D lift
Global industrial applicability
CKD products serve electronics, automotive, packaging and food sectors, creating exposure to multi-trillion-dollar end markets and an estimated >$1tn addressable market in 2024. Broad applicability hedges sector-specific downturns—diversified销量 reduced revenue volatility in 2024 for peers. Scalable component platforms adapt to regional standards, widening geographic reach and partner ecosystems.
- Multi-sector reach: electronics, automotive, packaging, food
- Addressable market: >$1tn (2024)
- Risk hedge: reduces sector concentration
- Scalability: platform adaptability across geographies
100+bn JPY automation: ~30% productivity, 12–24m payback, access to >$500B med device market
CKD's broad automation portfolio (100+bn JPY sales) and E2P engineering reduce integration risk, boost cross-sell and OEM stickiness. Proprietary systems deliver ~30% productivity gains, 12–24 month payback and 10–15% premium pricing. Life-science pivot accesses >$500B medical device market and helps smooth cyclical exposure to a >$1tn addressable market (2024).
| Metric | Value |
|---|---|
| Consolidated sales | 100+ bn JPY |
| Productivity uplift | ~30% |
| Payback | 12–24 months |
| Premium pricing | 10–15% |
| Medical device market (2023) | >$500B |
| Addressable market (2024) | >$1tn |
What is included in the product
 Detailed Word Document
Delivers a strategic overview of CKD’s internal and external business factors, outlining strengths, weaknesses, opportunities, and threats to its competitive position and growth outlook.

 Customizable Excel Spreadsheet
Delivers a concise, visual SWOT matrix tailored to CKD strategy, enabling rapid alignment and decision-making across clinical, operational, and commercial teams.
Weaknesses

High exposure to capex cycles
Revenue is highly sensitive to customers’ manufacturing and automation capex cycles, and a slowdown in industrial investment (global factory automation market ~USD 180–200bn in 2024) can quickly reduce orders. Downturns or delayed projects compress booking visibility and complicate capacity planning and inventory management. Resulting cash-flow volatility can raise short-term financing costs and working-capital needs.
Commodity pressure in pneumatics
Standard pneumatic components face intense price competition and low differentiation, with industry gross margins compressed toward roughly 20% in 2024, limiting upside without clear performance or service advantages. Margin pressure forces cost-led competition that constrains R&D spend, often below 3% of revenue, and can drive selective portfolio rationalization to focus on higher-margin, differentiated products.

Integration with digital stacks
Limited native software, analytics or IIoT platforms hinder smart-factory adoption; the global IIoT market was about $110 billion in 2023 and is expanding, so customers expect sensor-rich, connected, data-ready components. Dependence on third-party ecosystems reduces control over UX and recurring service revenues, diluting value capture and margin potential.

Aftermarket and service reach
Uneven global service networks increase lead times and reduce equipment uptime; inconsistent parts availability weakens lifetime value and customer retention. OEMs cite stronger local support as a common reason to switch vendors, eroding long-term contracts. Aftermarket spares and services contribute about 20–30% of lifecycle revenues for many industrial OEMs (industry reports 2023–24).
- lead-times ↑, uptime ↓
- parts inconsistency → lower LTV
- vendor-switch risk
- recurring revenue (spares/upgrades) 20–30%
Regulatory and validation burden
Life science components demand rigorous compliance and documentation, with regulatory filings and validation often taking 12–24 months and costing millions, slowing time-to-market and diverting engineering resources. Any compliance lapse risks severe reputational damage and recalls, and high cost of quality can compress margins.
- 12–24 months validation
- Millions in compliance costs
- Recall/reputation risk
- Quality costs reduce margins
Cyclical capex causes volatile orders; ~20% margins and weak IIoT reduce LTV
Revenue tied to cyclical factory capex (global automation ~USD 180–200bn in 2024) creates order and cash volatility. Compressed gross margins (~20% in 2024) and R&D <3% limit product differentiation. Weak IIoT/native software presence (IIoT ~USD110bn in 2023) reduces recurring revenue. Service network gaps and long life-science validations (12–24 months) erode LTV and raise compliance costs.
| Metric | Value |
|---|---|
| Automation market 2024 | USD 180–200bn |
| Industry gross margin 2024 | ~20% |
| R&D spend | <3% rev |
| IIoT 2023 | USD 110bn |
| Aftermarket share | 20–30% |
| Validation time | 12–24 months |
Same Document Delivered
CKD SWOT Analysis
This is the actual CKD SWOT analysis document you’ll receive upon purchase—no surprises, just professional quality. The preview below is taken directly from the full report you'll get, so what you see is what you'll download. Buy now to unlock the complete, editable version with full detail and structure.

Elevate Your Analysis with the Complete SWOT Report
CKD’s SWOT snapshot highlights solid technical expertise and market footholds but also flags supply-chain exposure and intensifying competition; strategic moves now will shape long-term value. Want the full strategic picture and prioritized actions? Purchase the complete SWOT analysis for a professional, editable report and Excel matrix to support investment, planning, and pitches.
Strengths
Broad automation portfolio
CKDs broad automation portfolio spans pneumatic components, drives and fluid control, delivering end-to-end factory automation and reducing vendor fragmentation and integration risk for customers. Cross-selling across these lines has driven higher wallet share and stickiness, supporting CKDs over 100bn JPY consolidated sales in recent fiscal reporting. The product breadth enables deep customization across diverse industrial use cases.
Engineering and manufacturing depth
Engineering-to-production depth enables CKD to deliver reliable, precise and durable components, shortening development cycles and improving field uptime. Process know-how in pneumatics and fluid systems sustains performance in harsh operating environments. A strong quality reputation lowers customer downtime and total cost of ownership. These strengths underpin stable, long-term OEM relationships.
Labor-saving machinery expertise
Proprietary labor-saving equipment delivers system-level gains—McKinsey estimates up to 30% productivity uplift—addressing productivity, cost, and workforce constraints. Integrating components with machinery creates measurable system advantages and shorter commissioning times. Demonstrable ROI (typical payback 12–24 months) supports premium pricing (often 10–15% above commodity kit) and drives accelerated adoption in modernized factories.
Diversification into life sciences
CKD's move into life sciences leverages fine-system components to shift revenue away from cyclical industrial demand; the global medical device market exceeded $500 billion in 2023, offering sizable regulated-market opportunity. Precision, cleanliness and reliability credentials unlock higher-spec contracts, knowledge transfer raises product performance across segments and helps smooth cash flows.
- Diversifies revenue
- Access to >$500B market (2023)
- Regulated-market margins
- Cross-segment R&D lift
Global industrial applicability
CKD products serve electronics, automotive, packaging and food sectors, creating exposure to multi-trillion-dollar end markets and an estimated >$1tn addressable market in 2024. Broad applicability hedges sector-specific downturns—diversified销量 reduced revenue volatility in 2024 for peers. Scalable component platforms adapt to regional standards, widening geographic reach and partner ecosystems.
- Multi-sector reach: electronics, automotive, packaging, food
- Addressable market: >$1tn (2024)
- Risk hedge: reduces sector concentration
- Scalability: platform adaptability across geographies
100+bn JPY automation: ~30% productivity, 12–24m payback, access to >$500B med device market
CKD's broad automation portfolio (100+bn JPY sales) and E2P engineering reduce integration risk, boost cross-sell and OEM stickiness. Proprietary systems deliver ~30% productivity gains, 12–24 month payback and 10–15% premium pricing. Life-science pivot accesses >$500B medical device market and helps smooth cyclical exposure to a >$1tn addressable market (2024).
| Metric | Value |
|---|---|
| Consolidated sales | 100+ bn JPY |
| Productivity uplift | ~30% |
| Payback | 12–24 months |
| Premium pricing | 10–15% |
| Medical device market (2023) | >$500B |
| Addressable market (2024) | >$1tn |
What is included in the product
Detailed Word Document
Delivers a strategic overview of CKD’s internal and external business factors, outlining strengths, weaknesses, opportunities, and threats to its competitive position and growth outlook.
Customizable Excel Spreadsheet
Delivers a concise, visual SWOT matrix tailored to CKD strategy, enabling rapid alignment and decision-making across clinical, operational, and commercial teams.
Weaknesses
High exposure to capex cycles
Revenue is highly sensitive to customers’ manufacturing and automation capex cycles, and a slowdown in industrial investment (global factory automation market ~USD 180–200bn in 2024) can quickly reduce orders. Downturns or delayed projects compress booking visibility and complicate capacity planning and inventory management. Resulting cash-flow volatility can raise short-term financing costs and working-capital needs.
Commodity pressure in pneumatics
Standard pneumatic components face intense price competition and low differentiation, with industry gross margins compressed toward roughly 20% in 2024, limiting upside without clear performance or service advantages. Margin pressure forces cost-led competition that constrains R&D spend, often below 3% of revenue, and can drive selective portfolio rationalization to focus on higher-margin, differentiated products.
Integration with digital stacks
Limited native software, analytics or IIoT platforms hinder smart-factory adoption; the global IIoT market was about $110 billion in 2023 and is expanding, so customers expect sensor-rich, connected, data-ready components. Dependence on third-party ecosystems reduces control over UX and recurring service revenues, diluting value capture and margin potential.
Aftermarket and service reach
Uneven global service networks increase lead times and reduce equipment uptime; inconsistent parts availability weakens lifetime value and customer retention. OEMs cite stronger local support as a common reason to switch vendors, eroding long-term contracts. Aftermarket spares and services contribute about 20–30% of lifecycle revenues for many industrial OEMs (industry reports 2023–24).
- lead-times ↑, uptime ↓
- parts inconsistency → lower LTV
- vendor-switch risk
- recurring revenue (spares/upgrades) 20–30%
Regulatory and validation burden
Life science components demand rigorous compliance and documentation, with regulatory filings and validation often taking 12–24 months and costing millions, slowing time-to-market and diverting engineering resources. Any compliance lapse risks severe reputational damage and recalls, and high cost of quality can compress margins.
- 12–24 months validation
- Millions in compliance costs
- Recall/reputation risk
- Quality costs reduce margins
Cyclical capex causes volatile orders; ~20% margins and weak IIoT reduce LTV
Revenue tied to cyclical factory capex (global automation ~USD 180–200bn in 2024) creates order and cash volatility. Compressed gross margins (~20% in 2024) and R&D <3% limit product differentiation. Weak IIoT/native software presence (IIoT ~USD110bn in 2023) reduces recurring revenue. Service network gaps and long life-science validations (12–24 months) erode LTV and raise compliance costs.
| Metric | Value |
|---|---|
| Automation market 2024 | USD 180–200bn |
| Industry gross margin 2024 | ~20% |
| R&D spend | <3% rev |
| IIoT 2023 | USD 110bn |
| Aftermarket share | 20–30% |
| Validation time | 12–24 months |
Same Document Delivered
CKD SWOT Analysis
This is the actual CKD SWOT analysis document you’ll receive upon purchase—no surprises, just professional quality. The preview below is taken directly from the full report you'll get, so what you see is what you'll download. Buy now to unlock the complete, editable version with full detail and structure.
Description
Elevate Your Analysis with the Complete SWOT Report
CKD’s SWOT snapshot highlights solid technical expertise and market footholds but also flags supply-chain exposure and intensifying competition; strategic moves now will shape long-term value. Want the full strategic picture and prioritized actions? Purchase the complete SWOT analysis for a professional, editable report and Excel matrix to support investment, planning, and pitches.
Strengths
Broad automation portfolio
CKDs broad automation portfolio spans pneumatic components, drives and fluid control, delivering end-to-end factory automation and reducing vendor fragmentation and integration risk for customers. Cross-selling across these lines has driven higher wallet share and stickiness, supporting CKDs over 100bn JPY consolidated sales in recent fiscal reporting. The product breadth enables deep customization across diverse industrial use cases.
Engineering and manufacturing depth
Engineering-to-production depth enables CKD to deliver reliable, precise and durable components, shortening development cycles and improving field uptime. Process know-how in pneumatics and fluid systems sustains performance in harsh operating environments. A strong quality reputation lowers customer downtime and total cost of ownership. These strengths underpin stable, long-term OEM relationships.
Labor-saving machinery expertise
Proprietary labor-saving equipment delivers system-level gains—McKinsey estimates up to 30% productivity uplift—addressing productivity, cost, and workforce constraints. Integrating components with machinery creates measurable system advantages and shorter commissioning times. Demonstrable ROI (typical payback 12–24 months) supports premium pricing (often 10–15% above commodity kit) and drives accelerated adoption in modernized factories.
Diversification into life sciences
CKD's move into life sciences leverages fine-system components to shift revenue away from cyclical industrial demand; the global medical device market exceeded $500 billion in 2023, offering sizable regulated-market opportunity. Precision, cleanliness and reliability credentials unlock higher-spec contracts, knowledge transfer raises product performance across segments and helps smooth cash flows.
- Diversifies revenue
- Access to >$500B market (2023)
- Regulated-market margins
- Cross-segment R&D lift
Global industrial applicability
CKD products serve electronics, automotive, packaging and food sectors, creating exposure to multi-trillion-dollar end markets and an estimated >$1tn addressable market in 2024. Broad applicability hedges sector-specific downturns—diversified销量 reduced revenue volatility in 2024 for peers. Scalable component platforms adapt to regional standards, widening geographic reach and partner ecosystems.
- Multi-sector reach: electronics, automotive, packaging, food
- Addressable market: >$1tn (2024)
- Risk hedge: reduces sector concentration
- Scalability: platform adaptability across geographies
100+bn JPY automation: ~30% productivity, 12–24m payback, access to >$500B med device market
CKD's broad automation portfolio (100+bn JPY sales) and E2P engineering reduce integration risk, boost cross-sell and OEM stickiness. Proprietary systems deliver ~30% productivity gains, 12–24 month payback and 10–15% premium pricing. Life-science pivot accesses >$500B medical device market and helps smooth cyclical exposure to a >$1tn addressable market (2024).
| Metric | Value |
|---|---|
| Consolidated sales | 100+ bn JPY |
| Productivity uplift | ~30% |
| Payback | 12–24 months |
| Premium pricing | 10–15% |
| Medical device market (2023) | >$500B |
| Addressable market (2024) | >$1tn |
What is included in the product
Detailed Word Document
Delivers a strategic overview of CKD’s internal and external business factors, outlining strengths, weaknesses, opportunities, and threats to its competitive position and growth outlook.
Customizable Excel Spreadsheet
Delivers a concise, visual SWOT matrix tailored to CKD strategy, enabling rapid alignment and decision-making across clinical, operational, and commercial teams.
Weaknesses
High exposure to capex cycles
Revenue is highly sensitive to customers’ manufacturing and automation capex cycles, and a slowdown in industrial investment (global factory automation market ~USD 180–200bn in 2024) can quickly reduce orders. Downturns or delayed projects compress booking visibility and complicate capacity planning and inventory management. Resulting cash-flow volatility can raise short-term financing costs and working-capital needs.
Commodity pressure in pneumatics
Standard pneumatic components face intense price competition and low differentiation, with industry gross margins compressed toward roughly 20% in 2024, limiting upside without clear performance or service advantages. Margin pressure forces cost-led competition that constrains R&D spend, often below 3% of revenue, and can drive selective portfolio rationalization to focus on higher-margin, differentiated products.
Integration with digital stacks
Limited native software, analytics or IIoT platforms hinder smart-factory adoption; the global IIoT market was about $110 billion in 2023 and is expanding, so customers expect sensor-rich, connected, data-ready components. Dependence on third-party ecosystems reduces control over UX and recurring service revenues, diluting value capture and margin potential.
Aftermarket and service reach
Uneven global service networks increase lead times and reduce equipment uptime; inconsistent parts availability weakens lifetime value and customer retention. OEMs cite stronger local support as a common reason to switch vendors, eroding long-term contracts. Aftermarket spares and services contribute about 20–30% of lifecycle revenues for many industrial OEMs (industry reports 2023–24).
- lead-times ↑, uptime ↓
- parts inconsistency → lower LTV
- vendor-switch risk
- recurring revenue (spares/upgrades) 20–30%
Regulatory and validation burden
Life science components demand rigorous compliance and documentation, with regulatory filings and validation often taking 12–24 months and costing millions, slowing time-to-market and diverting engineering resources. Any compliance lapse risks severe reputational damage and recalls, and high cost of quality can compress margins.
- 12–24 months validation
- Millions in compliance costs
- Recall/reputation risk
- Quality costs reduce margins
Cyclical capex causes volatile orders; ~20% margins and weak IIoT reduce LTV
Revenue tied to cyclical factory capex (global automation ~USD 180–200bn in 2024) creates order and cash volatility. Compressed gross margins (~20% in 2024) and R&D <3% limit product differentiation. Weak IIoT/native software presence (IIoT ~USD110bn in 2023) reduces recurring revenue. Service network gaps and long life-science validations (12–24 months) erode LTV and raise compliance costs.
| Metric | Value |
|---|---|
| Automation market 2024 | USD 180–200bn |
| Industry gross margin 2024 | ~20% |
| R&D spend | <3% rev |
| IIoT 2023 | USD 110bn |
| Aftermarket share | 20–30% |
| Validation time | 12–24 months |
Same Document Delivered
CKD SWOT Analysis
This is the actual CKD SWOT analysis document you’ll receive upon purchase—no surprises, just professional quality. The preview below is taken directly from the full report you'll get, so what you see is what you'll download. Buy now to unlock the complete, editable version with full detail and structure.











