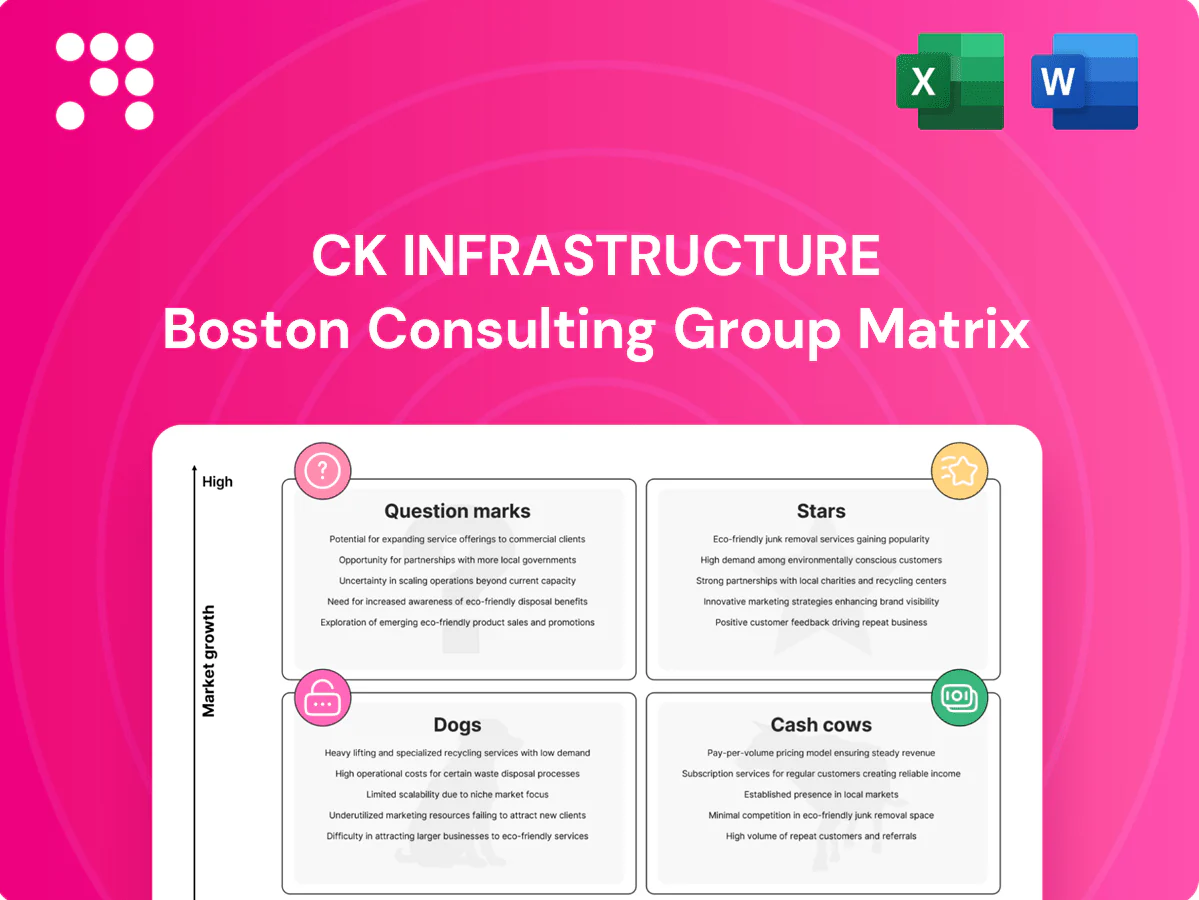
CK Infrastructure Boston Consulting Group Matrix

Actionable Strategy Starts Here
Quick snapshot: CK Infrastructure’s BCG Matrix paints a picture of solid cash cows in core utilities and a few question marks in new energy ventures—high cash flow, selective growth needs. Want clarity on which assets to milk, which to divest, and where to double down? Purchase the full BCG Matrix for quadrant-by-quadrant placement, actionable strategy, and a ready-to-use Word report plus Excel summary. Skip the guesswork—get the data-backed roadmap to steer capital and priorities with confidence.
Stars

Waste-to-energy platforms
High market share in the fast-growing waste-to-energy decarbonization niche benefits from 2024 tailwinds as the global WtE market is expanding at roughly a 6% CAGR and assets typically run 85–90% utilization under long-term feedstock contracts. Expansion requires cash, but CK Infrastructure’s pipeline and secured contracts justify staying on offense. Hold share now; assets should mature into strong cash generators later.
Regulated gas networks in growth regions
Gas distribution in growth regions remains strong as population and industrial demand accelerated through 2024, keeping networks utilization high. CKI’s scale and regulated frameworks lock in predictable returns while ongoing capex expands the asset base and muddies marginal risk. Promotion focuses on stakeholder trust and targeted grid upgrades rather than mass advertising. Continued investment is warranted to cement leadership before growth normalizes.

Grid-tied renewable generation (wind/solar)
First-mover sites and long‑dated PPAs give CK Infrastructure volume in fast‑growing markets, with project pipelines in 2024 totaling multiple GW of contracted capacity and near‑term CODs underpinned by secured offtake. Interconnection rights and local operational know‑how form tangible moats that raise barriers to entry and protect returns. Build‑out remains capital intensive, but 2024 earnings momentum from contracted renewables and merchant exposure is strengthening cash flow. Hold the throttle on new builds and defend offtake to convert scale into steady cash cows later.

Smart toll corridors with rising ADT
Traffic on CKI smart toll corridors has rebounded above pre‑shock ADT, with volumes rising an estimated 15% year‑on‑year in 2024 on key regional routes driven by GDP and mobility recovery.
Dynamic pricing and digital tolling lift yield and generate first‑party traffic/data — boosting toll revenue per vehicle and enabling targeted demand management while improving loss detection.
Ongoing expansion and O&M digitization require capital deployment now; focus on maintenance excellence and superior customer UX to protect market share and lifetime revenue.
- ADT rebound: +15% (2024 est.)
- Revenue uplift: dynamic pricing improves yield per vehicle
- Capex: expansion + O&M digitization ongoing
- Defensive focus: maintenance excellence, customer UX
Advanced water treatment hubs
Advanced water treatment hubs sit in Stars: urban growth and stricter effluent standards in 2024 make advanced tertiary treatment essential, driving high-capex tenders. CKI’s operating depth wins large tenders and secures long concessions (typically 20–30 years), converting growth into durable cashflows. Scale lets CKI upgrade membranes and controls faster than rivals, preserving margin and market share.
- 2024: regulatory tightening boosts premium-treatment bids
- Concessions: commonly 20–30 years, favoring incumbents
- Scale advantage: faster tech refresh (membranes, automation) = margin protection
High-growth infra: WtE 6% CAGR, 3.5 GW renewables, tolls ADT +15%
Stars: WtE, gas distribution, renewables, tolls and advanced water are high-share, high-growth assets; WtE ~6% CAGR (2024) with 85–90% utilization. CKI had ~3.5 GW contracted renewables pipeline (2024) and toll ADT +15% YoY (2024). Concessions often 20–30 years, requiring capex now to secure long-term cashflow.
| Asset | 2024 metric | Key note |
|---|---|---|
| WtE | CAGR 6% / 85–90% util | feedstock contracts |
| Renewables | 3.5 GW contracted | long PPAs |
| Tolls | ADT +15% YoY | dynamic pricing |
| Water | Concessions 20–30 yrs | tech refresh |
What is included in the product
 Detailed Word Document
BCG analysis of CK Infrastructure's units, classifying Stars, Cash Cows, Question Marks and Dogs with clear invest/hold/divest guidance.

 Customizable Excel Spreadsheet
One-page CK Infrastructure BCG Matrix that clarifies portfolio weak spots and prioritizes capital allocation for faster decisions.
Cash Cows

Mature regulated electricity distribution
Mature regulated electricity distribution represents a stable, high-share cash cow for CK Infrastructure, operating in slow-growth territories with predictable allowed returns and low customer churn; low promotional spend and steady inflation pass-through preserve margins. Incremental capex on reliability and digitization improves cash conversion. Milk prudently while maintaining strong regulator relationships in 2024.
Established water utilities
Established water utilities are an essential service with an entrenched footprint and modest demand growth of roughly 1% annually in developed markets; regulated returns typically sit around 4–6%, so operating levers and leakage control drop straight to cash. Minimal marketing is required—focus stays on compliance and service KPIs such as leakage reduction and supply continuity. Surplus cash funds the next wave of growth bets and de-risked capex.

Core toll roads and legacy bridges
Core toll roads and legacy bridges in CK Infrastructure sit on long-dated concessions (typically 30+ years) with mature traffic patterns and stable tariff regimes, where maintenance outweighs expansion and cost discipline drives returns. High EBITDA margins and limited competitive threats give predictable cash outflows and unexciting but reliable inflows, supporting steady dividend coverage and balance-sheet resilience.

Gas networks in saturated markets
Gas networks in saturated markets show household gas penetration above 80% in developed markets (2024), producing slow customer growth but stable volumes; clear regulatory frameworks deliver predictable returns. Efficiency programs and roll-out of smart meters have compressed operating costs and widened margins, requiring minimal marketing as reliability is the core brand, allowing networks to throw off cash to fund higher-growth platforms.
- High penetration: >80% households (developed markets, 2024)
- Customer growth: flat to low-single-digit
- Regulatory clarity: predictable tariffs and indexed returns
- Margin drivers: efficiency programs, smart meters
- Role: cash generator for growth investments
Contracted baseload generation
Contracted baseload generation in CK Infrastructure functions as a cash cow: in 2024 over 90% of plant output remains covered by PPAs that lock pricing and volume, leaving growth minimal while protecting revenue visibility.
O&M optimization and active fuel hedging sustained thick margins in 2024, with limited capex required beyond regulatory compliance.
This fleet is a clean, steady contributor to dividends and debt service.
- PPAs: >90% output covered (2024)
- Growth: minimal, pipeline constrained
- Margins: supported by O&M + hedging
- Capex: largely compliance-driven
Regulated networks, tolls & baseload: predictable ~4-8% returns, PPA >90% in 2024
Mature regulated networks, contracted baseload and core tolls are stable cash cows for CK Infrastructure in 2024, yielding predictable cashflow with regulated returns of ~4–8% and PPA coverage >90%. Low growth, minimal capex beyond compliance, and high EBITDA margins support dividends and debt service while funding selective growth.
| Asset | 2024 metric | Role |
|---|---|---|
| Electricity/water | Returns 4–6% | Cash generator |
| Toll roads | Concessions 30+ yrs | Stable cash |
| Baseload | PPA >90% | Revenue visibility |
Full Transparency, Always
CK Infrastructure BCG Matrix
The CK Infrastructure BCG Matrix you're previewing is the exact, final file you'll receive after purchase. No watermarks or demo placeholders—just a fully formatted, ready-to-use strategic matrix tailored to CK Infrastructure's portfolio. It arrives immediately for editing, printing, or presenting. Crafted for clarity and decision-making, there are no surprises—only actionable insight.

Actionable Strategy Starts Here
Quick snapshot: CK Infrastructure’s BCG Matrix paints a picture of solid cash cows in core utilities and a few question marks in new energy ventures—high cash flow, selective growth needs. Want clarity on which assets to milk, which to divest, and where to double down? Purchase the full BCG Matrix for quadrant-by-quadrant placement, actionable strategy, and a ready-to-use Word report plus Excel summary. Skip the guesswork—get the data-backed roadmap to steer capital and priorities with confidence.
Stars
Waste-to-energy platforms
High market share in the fast-growing waste-to-energy decarbonization niche benefits from 2024 tailwinds as the global WtE market is expanding at roughly a 6% CAGR and assets typically run 85–90% utilization under long-term feedstock contracts. Expansion requires cash, but CK Infrastructure’s pipeline and secured contracts justify staying on offense. Hold share now; assets should mature into strong cash generators later.
Regulated gas networks in growth regions
Gas distribution in growth regions remains strong as population and industrial demand accelerated through 2024, keeping networks utilization high. CKI’s scale and regulated frameworks lock in predictable returns while ongoing capex expands the asset base and muddies marginal risk. Promotion focuses on stakeholder trust and targeted grid upgrades rather than mass advertising. Continued investment is warranted to cement leadership before growth normalizes.
Grid-tied renewable generation (wind/solar)
First-mover sites and long‑dated PPAs give CK Infrastructure volume in fast‑growing markets, with project pipelines in 2024 totaling multiple GW of contracted capacity and near‑term CODs underpinned by secured offtake. Interconnection rights and local operational know‑how form tangible moats that raise barriers to entry and protect returns. Build‑out remains capital intensive, but 2024 earnings momentum from contracted renewables and merchant exposure is strengthening cash flow. Hold the throttle on new builds and defend offtake to convert scale into steady cash cows later.
Smart toll corridors with rising ADT
Traffic on CKI smart toll corridors has rebounded above pre‑shock ADT, with volumes rising an estimated 15% year‑on‑year in 2024 on key regional routes driven by GDP and mobility recovery.
Dynamic pricing and digital tolling lift yield and generate first‑party traffic/data — boosting toll revenue per vehicle and enabling targeted demand management while improving loss detection.
Ongoing expansion and O&M digitization require capital deployment now; focus on maintenance excellence and superior customer UX to protect market share and lifetime revenue.
- ADT rebound: +15% (2024 est.)
- Revenue uplift: dynamic pricing improves yield per vehicle
- Capex: expansion + O&M digitization ongoing
- Defensive focus: maintenance excellence, customer UX
Advanced water treatment hubs
Advanced water treatment hubs sit in Stars: urban growth and stricter effluent standards in 2024 make advanced tertiary treatment essential, driving high-capex tenders. CKI’s operating depth wins large tenders and secures long concessions (typically 20–30 years), converting growth into durable cashflows. Scale lets CKI upgrade membranes and controls faster than rivals, preserving margin and market share.
- 2024: regulatory tightening boosts premium-treatment bids
- Concessions: commonly 20–30 years, favoring incumbents
- Scale advantage: faster tech refresh (membranes, automation) = margin protection
High-growth infra: WtE 6% CAGR, 3.5 GW renewables, tolls ADT +15%
Stars: WtE, gas distribution, renewables, tolls and advanced water are high-share, high-growth assets; WtE ~6% CAGR (2024) with 85–90% utilization. CKI had ~3.5 GW contracted renewables pipeline (2024) and toll ADT +15% YoY (2024). Concessions often 20–30 years, requiring capex now to secure long-term cashflow.
| Asset | 2024 metric | Key note |
|---|---|---|
| WtE | CAGR 6% / 85–90% util | feedstock contracts |
| Renewables | 3.5 GW contracted | long PPAs |
| Tolls | ADT +15% YoY | dynamic pricing |
| Water | Concessions 20–30 yrs | tech refresh |
What is included in the product
Detailed Word Document
BCG analysis of CK Infrastructure's units, classifying Stars, Cash Cows, Question Marks and Dogs with clear invest/hold/divest guidance.
Customizable Excel Spreadsheet
One-page CK Infrastructure BCG Matrix that clarifies portfolio weak spots and prioritizes capital allocation for faster decisions.
Cash Cows
Mature regulated electricity distribution
Mature regulated electricity distribution represents a stable, high-share cash cow for CK Infrastructure, operating in slow-growth territories with predictable allowed returns and low customer churn; low promotional spend and steady inflation pass-through preserve margins. Incremental capex on reliability and digitization improves cash conversion. Milk prudently while maintaining strong regulator relationships in 2024.
Established water utilities
Established water utilities are an essential service with an entrenched footprint and modest demand growth of roughly 1% annually in developed markets; regulated returns typically sit around 4–6%, so operating levers and leakage control drop straight to cash. Minimal marketing is required—focus stays on compliance and service KPIs such as leakage reduction and supply continuity. Surplus cash funds the next wave of growth bets and de-risked capex.
Core toll roads and legacy bridges
Core toll roads and legacy bridges in CK Infrastructure sit on long-dated concessions (typically 30+ years) with mature traffic patterns and stable tariff regimes, where maintenance outweighs expansion and cost discipline drives returns. High EBITDA margins and limited competitive threats give predictable cash outflows and unexciting but reliable inflows, supporting steady dividend coverage and balance-sheet resilience.
Gas networks in saturated markets
Gas networks in saturated markets show household gas penetration above 80% in developed markets (2024), producing slow customer growth but stable volumes; clear regulatory frameworks deliver predictable returns. Efficiency programs and roll-out of smart meters have compressed operating costs and widened margins, requiring minimal marketing as reliability is the core brand, allowing networks to throw off cash to fund higher-growth platforms.
- High penetration: >80% households (developed markets, 2024)
- Customer growth: flat to low-single-digit
- Regulatory clarity: predictable tariffs and indexed returns
- Margin drivers: efficiency programs, smart meters
- Role: cash generator for growth investments
Contracted baseload generation
Contracted baseload generation in CK Infrastructure functions as a cash cow: in 2024 over 90% of plant output remains covered by PPAs that lock pricing and volume, leaving growth minimal while protecting revenue visibility.
O&M optimization and active fuel hedging sustained thick margins in 2024, with limited capex required beyond regulatory compliance.
This fleet is a clean, steady contributor to dividends and debt service.
- PPAs: >90% output covered (2024)
- Growth: minimal, pipeline constrained
- Margins: supported by O&M + hedging
- Capex: largely compliance-driven
Regulated networks, tolls & baseload: predictable ~4-8% returns, PPA >90% in 2024
Mature regulated networks, contracted baseload and core tolls are stable cash cows for CK Infrastructure in 2024, yielding predictable cashflow with regulated returns of ~4–8% and PPA coverage >90%. Low growth, minimal capex beyond compliance, and high EBITDA margins support dividends and debt service while funding selective growth.
| Asset | 2024 metric | Role |
|---|---|---|
| Electricity/water | Returns 4–6% | Cash generator |
| Toll roads | Concessions 30+ yrs | Stable cash |
| Baseload | PPA >90% | Revenue visibility |
Full Transparency, Always
CK Infrastructure BCG Matrix
The CK Infrastructure BCG Matrix you're previewing is the exact, final file you'll receive after purchase. No watermarks or demo placeholders—just a fully formatted, ready-to-use strategic matrix tailored to CK Infrastructure's portfolio. It arrives immediately for editing, printing, or presenting. Crafted for clarity and decision-making, there are no surprises—only actionable insight.
Original: $10.00
-65%$10.00
$3.50Description
Actionable Strategy Starts Here
Quick snapshot: CK Infrastructure’s BCG Matrix paints a picture of solid cash cows in core utilities and a few question marks in new energy ventures—high cash flow, selective growth needs. Want clarity on which assets to milk, which to divest, and where to double down? Purchase the full BCG Matrix for quadrant-by-quadrant placement, actionable strategy, and a ready-to-use Word report plus Excel summary. Skip the guesswork—get the data-backed roadmap to steer capital and priorities with confidence.
Stars
Waste-to-energy platforms
High market share in the fast-growing waste-to-energy decarbonization niche benefits from 2024 tailwinds as the global WtE market is expanding at roughly a 6% CAGR and assets typically run 85–90% utilization under long-term feedstock contracts. Expansion requires cash, but CK Infrastructure’s pipeline and secured contracts justify staying on offense. Hold share now; assets should mature into strong cash generators later.
Regulated gas networks in growth regions
Gas distribution in growth regions remains strong as population and industrial demand accelerated through 2024, keeping networks utilization high. CKI’s scale and regulated frameworks lock in predictable returns while ongoing capex expands the asset base and muddies marginal risk. Promotion focuses on stakeholder trust and targeted grid upgrades rather than mass advertising. Continued investment is warranted to cement leadership before growth normalizes.
Grid-tied renewable generation (wind/solar)
First-mover sites and long‑dated PPAs give CK Infrastructure volume in fast‑growing markets, with project pipelines in 2024 totaling multiple GW of contracted capacity and near‑term CODs underpinned by secured offtake. Interconnection rights and local operational know‑how form tangible moats that raise barriers to entry and protect returns. Build‑out remains capital intensive, but 2024 earnings momentum from contracted renewables and merchant exposure is strengthening cash flow. Hold the throttle on new builds and defend offtake to convert scale into steady cash cows later.
Smart toll corridors with rising ADT
Traffic on CKI smart toll corridors has rebounded above pre‑shock ADT, with volumes rising an estimated 15% year‑on‑year in 2024 on key regional routes driven by GDP and mobility recovery.
Dynamic pricing and digital tolling lift yield and generate first‑party traffic/data — boosting toll revenue per vehicle and enabling targeted demand management while improving loss detection.
Ongoing expansion and O&M digitization require capital deployment now; focus on maintenance excellence and superior customer UX to protect market share and lifetime revenue.
- ADT rebound: +15% (2024 est.)
- Revenue uplift: dynamic pricing improves yield per vehicle
- Capex: expansion + O&M digitization ongoing
- Defensive focus: maintenance excellence, customer UX
Advanced water treatment hubs
Advanced water treatment hubs sit in Stars: urban growth and stricter effluent standards in 2024 make advanced tertiary treatment essential, driving high-capex tenders. CKI’s operating depth wins large tenders and secures long concessions (typically 20–30 years), converting growth into durable cashflows. Scale lets CKI upgrade membranes and controls faster than rivals, preserving margin and market share.
- 2024: regulatory tightening boosts premium-treatment bids
- Concessions: commonly 20–30 years, favoring incumbents
- Scale advantage: faster tech refresh (membranes, automation) = margin protection
High-growth infra: WtE 6% CAGR, 3.5 GW renewables, tolls ADT +15%
Stars: WtE, gas distribution, renewables, tolls and advanced water are high-share, high-growth assets; WtE ~6% CAGR (2024) with 85–90% utilization. CKI had ~3.5 GW contracted renewables pipeline (2024) and toll ADT +15% YoY (2024). Concessions often 20–30 years, requiring capex now to secure long-term cashflow.
| Asset | 2024 metric | Key note |
|---|---|---|
| WtE | CAGR 6% / 85–90% util | feedstock contracts |
| Renewables | 3.5 GW contracted | long PPAs |
| Tolls | ADT +15% YoY | dynamic pricing |
| Water | Concessions 20–30 yrs | tech refresh |
What is included in the product
Detailed Word Document
BCG analysis of CK Infrastructure's units, classifying Stars, Cash Cows, Question Marks and Dogs with clear invest/hold/divest guidance.
Customizable Excel Spreadsheet
One-page CK Infrastructure BCG Matrix that clarifies portfolio weak spots and prioritizes capital allocation for faster decisions.
Cash Cows
Mature regulated electricity distribution
Mature regulated electricity distribution represents a stable, high-share cash cow for CK Infrastructure, operating in slow-growth territories with predictable allowed returns and low customer churn; low promotional spend and steady inflation pass-through preserve margins. Incremental capex on reliability and digitization improves cash conversion. Milk prudently while maintaining strong regulator relationships in 2024.
Established water utilities
Established water utilities are an essential service with an entrenched footprint and modest demand growth of roughly 1% annually in developed markets; regulated returns typically sit around 4–6%, so operating levers and leakage control drop straight to cash. Minimal marketing is required—focus stays on compliance and service KPIs such as leakage reduction and supply continuity. Surplus cash funds the next wave of growth bets and de-risked capex.
Core toll roads and legacy bridges
Core toll roads and legacy bridges in CK Infrastructure sit on long-dated concessions (typically 30+ years) with mature traffic patterns and stable tariff regimes, where maintenance outweighs expansion and cost discipline drives returns. High EBITDA margins and limited competitive threats give predictable cash outflows and unexciting but reliable inflows, supporting steady dividend coverage and balance-sheet resilience.
Gas networks in saturated markets
Gas networks in saturated markets show household gas penetration above 80% in developed markets (2024), producing slow customer growth but stable volumes; clear regulatory frameworks deliver predictable returns. Efficiency programs and roll-out of smart meters have compressed operating costs and widened margins, requiring minimal marketing as reliability is the core brand, allowing networks to throw off cash to fund higher-growth platforms.
- High penetration: >80% households (developed markets, 2024)
- Customer growth: flat to low-single-digit
- Regulatory clarity: predictable tariffs and indexed returns
- Margin drivers: efficiency programs, smart meters
- Role: cash generator for growth investments
Contracted baseload generation
Contracted baseload generation in CK Infrastructure functions as a cash cow: in 2024 over 90% of plant output remains covered by PPAs that lock pricing and volume, leaving growth minimal while protecting revenue visibility.
O&M optimization and active fuel hedging sustained thick margins in 2024, with limited capex required beyond regulatory compliance.
This fleet is a clean, steady contributor to dividends and debt service.
- PPAs: >90% output covered (2024)
- Growth: minimal, pipeline constrained
- Margins: supported by O&M + hedging
- Capex: largely compliance-driven
Regulated networks, tolls & baseload: predictable ~4-8% returns, PPA >90% in 2024
Mature regulated networks, contracted baseload and core tolls are stable cash cows for CK Infrastructure in 2024, yielding predictable cashflow with regulated returns of ~4–8% and PPA coverage >90%. Low growth, minimal capex beyond compliance, and high EBITDA margins support dividends and debt service while funding selective growth.
| Asset | 2024 metric | Role |
|---|---|---|
| Electricity/water | Returns 4–6% | Cash generator |
| Toll roads | Concessions 30+ yrs | Stable cash |
| Baseload | PPA >90% | Revenue visibility |
Full Transparency, Always
CK Infrastructure BCG Matrix
The CK Infrastructure BCG Matrix you're previewing is the exact, final file you'll receive after purchase. No watermarks or demo placeholders—just a fully formatted, ready-to-use strategic matrix tailored to CK Infrastructure's portfolio. It arrives immediately for editing, printing, or presenting. Crafted for clarity and decision-making, there are no surprises—only actionable insight.











