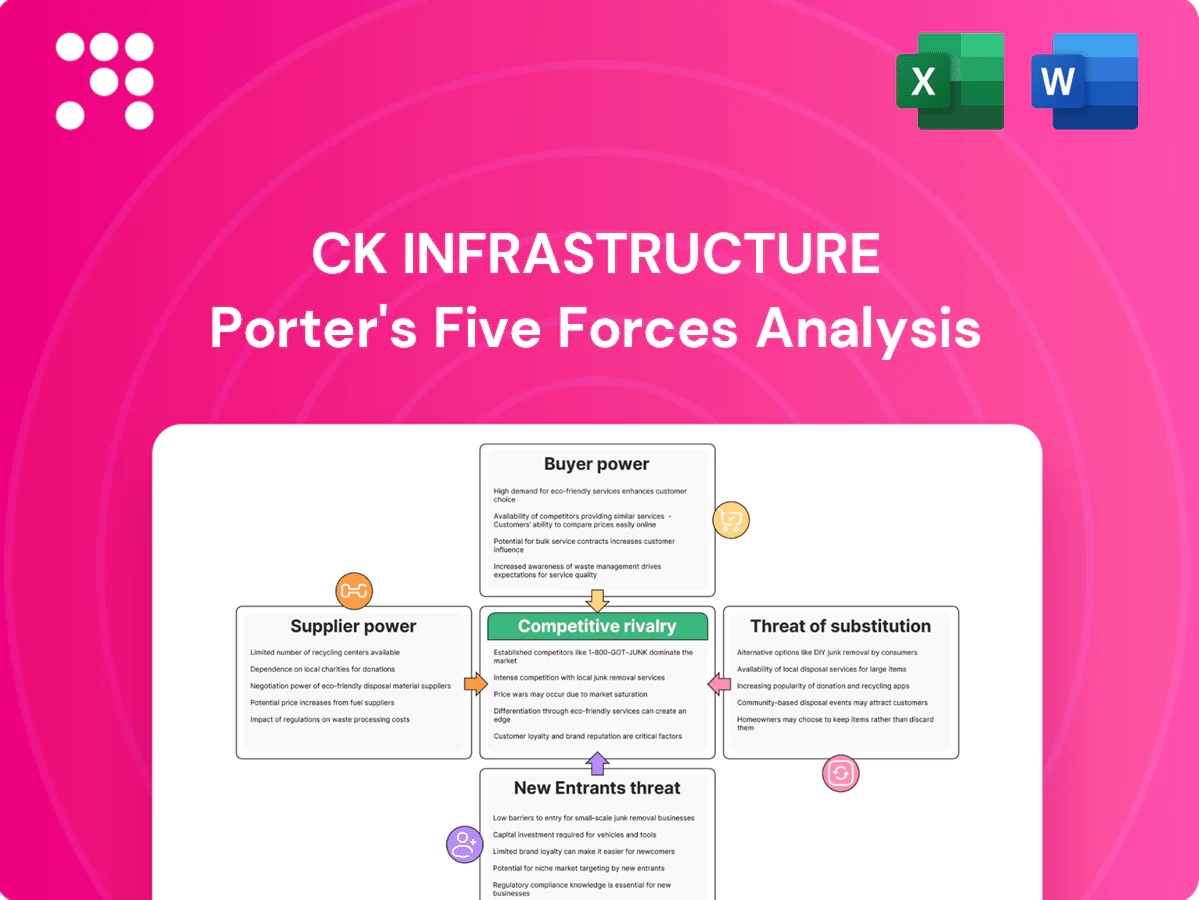
CK Infrastructure Porter's Five Forces Analysis

Don't Miss the Bigger Picture
CK Infrastructure faces moderate supplier power, steady buyer demand, high regulatory and capital barriers that limit new entrants, and evolving substitute threats from renewables; competitive rivalry centers on scale and network control. This snapshot highlights key pressures but omits force-by-force ratings and strategic implications. Unlock the full Porter's Five Forces Analysis to access detailed ratings, visuals, and actionable recommendations for investment or strategic planning.
Suppliers Bargaining Power

Concentrated OEMs for critical assets
Concentrated OEMs supply large turbines, transformers, SCADA and meters—top 3 turbine OEMs account for roughly 70% of global installations (2023–24), raising switching costs. Long lead times of 12–24 months and technical lock‑in boost supplier leverage over pricing and service terms. CKI mitigates via framework agreements, multi‑sourcing where feasible, and lifecycle maintenance contracts. Certification and interoperability requirements still constrain substitution.
Fuel and commodity suppliers
Gas and fuel inputs expose CK Infrastructure assets to supplier market power, with global benchmarks such as Brent averaging about $85/bbl in 2024 highlighting continued commodity volatility. Indexed contracts and hedging blunt price swings but cannot remove basis and availability risks, while regulated pass-through in some markets shields margins. Procurement scale and supply-security clauses, plus diversified sourcing, materially moderate supplier influence.

EPC and specialist contractors
Engineering, procurement and construction capacity cycles tighten periodically, increasing lead times and contractor leverage on pricing for large projects. Specialized civil works such as tunnels, bridges and water treatment are concentrated among few global contractors, raising supplier bargaining power. CKI’s sponsor reputation and global pipeline attract competitive bidders, and tools like performance bonds (commonly 5–10% of contract value) and staged payments help rebalance negotiating power.

Skilled labor and O&M services
Scarcity of certified technicians and engineers in energy, water and transport raises wages and O&M outsourcing costs, squeezing margins; global infrastructure investment gap is about US$2.5tr/year (World Bank), while CKI-style concessions typically run 20–30 years, allowing partial recovery but enforcing strict efficiency targets and union/safety-driven cost rigidity. Apprenticeships and digitalization can gradually lower dependence and unit O&M costs.
- Wage/O&M inflation
- Union/safety rigidity
- 20–30yr concessions
- Apprenticeships + digitalization
Capital providers and insurers
Rising rates and tighter insurance markets in 2024 (global 10‑year yields near 4%) have pushed financing and risk‑transfer costs higher, while lenders increasingly demand covenants that can constrain operational flexibility. CKI’s scale, asset backing and investment‑grade profile improve access and pricing versus smaller peers, and growth in green financing and ESG‑linked structures is widening capital sources.
- Higher cost of capital: 10‑yr ~4% (2024)
- Stronger covenant scrutiny from lenders
- CKI advantages: scale, asset backing, investment‑grade
- Green/ESG financing diversifies funding
OEM concentration and fuel volatility heighten risk; scale, hedges and long concessions reduce it
Supplier power is elevated: top‑3 turbine OEMs ~70% share (2023–24), 12–24 month lead times and technical lock‑in raise switching costs. Fuel volatility (Brent ~US$85/bbl in 2024) and concentrated EPC/skill markets increase pricing risk; CKI offsets via framework agreements, multi‑sourcing, hedges and long concessions (20–30 yrs). Scale, performance bonds (5–10%) and ESG finance lower supplier and capital cost pressure.
| Metric | 2024/Value |
|---|---|
| Top‑3 turbine OEM share | ~70% |
| Lead times (OEM/EPC) | 12–24 months |
| Brent | ~US$85/bbl |
| Performance bonds | 5–10% |
| Concession length | 20–30 yrs |
What is included in the product
 Detailed Word Document
Tailored Porter's Five Forces analysis of CK Infrastructure that uncovers key drivers of competition, buyer and supplier power, entry barriers and substitute threats, highlighting disruptive forces and strategic levers affecting its pricing, profitability and market position—fully editable for reports and investor materials.

 Customizable Excel Spreadsheet
Clear, one-sheet Porter's Five Forces for CK Infrastructure that instantly highlights strategic pressures with a spider chart, lets you customize force levels for new data or regulations, and drops neatly into decks to remove analysis bottlenecks.
Customers Bargaining Power

Regulators and concession authorities
Price caps, revenue formulas and service KPIs set by regulators and concession authorities directly shape CK Infrastructure cash flows, with periodic tariff resets typically every 4–8 years and Australian/Australasian regimes commonly using 5‑year control periods. Authorities can levy penalties or disallow cost pass‑throughs, exerting strong buyer-like power that can compress returns. Transparent engagement and a proven delivery record improve chances of favorable determinations. Periodic resets therefore create both downside risk and re-rating opportunities.
Wholesale offtakers and PPAs
Wholesale offtakers and PPAs concentrate demand via long-term tenors typically 10–25 years, often with investment-grade utilities and grid operators that lower collection risk but cap pricing upside. Standardized creditworthy contracts reduce default exposure yet limit merchant upside. Competitive tenders compress award margins to single-digit percentage points. Contract optionality and CPI or market-price indexation clauses partly restore pricing flexibility and soften buyer leverage.

Municipal and public sector clients
Water, waste and transport services rely on local governments as anchor customers, with contracts typically spanning 10–30 years. In 2024 municipal budget cycles remain annual with 3–5 year capital plans, driving timing and scope of renegotiations. Measurable performance and community impact metrics strongly influence renewals, while transparent reporting and stakeholder engagement reduce incentives to switch providers.

Retail end-users in regulated frameworks
Retail end-users in regulated frameworks have low direct bargaining power because they typically cannot switch network providers; short-run residential price elasticity is modest, roughly -0.2 to -0.6, limiting volume response. Regulatory complaint mechanisms and service standards (tariff reviews, quality-of-service KPIs) indirectly constrain pricing and allowed returns. Shifting consumption patterns (e.g., appliance efficiency, distributed generation) affect volumes, while customer-centric programs ease tariff adjustments.
- Low switching power
- Elasticity ~ -0.2 to -0.6
- Regulatory complaint-driven pricing
- Demand shifts impact volumes
- Customer programs improve tariff acceptance
Procurement via competitive tenders
Procurement via competitive tenders gives buyers strong bargaining power as auctions impose strict terms and intense rivalry compresses expected returns at the bid stage. CKI leans on a proven track record, financing certainty and O&M efficiencies to differentiate and sustain margins. In 2024, disciplined bidding is essential to avoid the winner’s curse.
- Strict auction terms
- Competition compresses returns
- CKI: track record, financing, O&M
- Bid discipline prevents winner’s curse
Price caps, 5-yr tariff resets and long PPAs cap upside; disciplined 2024 bidding critical
Regulatory price caps and periodic tariff resets (typically 4–8 years, 5‑year control periods common) strongly constrain CK Infrastructure cash flows and returns. Long‑dated PPAs (10–25 years) and municipal contracts (10–30 years) reduce collection risk but cap upside; competitive tenders compress award margins to single‑digit percentage points. Residential elasticity is low (~ -0.2 to -0.6), limiting volume-driven pricing relief; disciplined 2024 bidding is essential.
| Metric | Value |
|---|---|
| Tariff reset period | 4–8 yrs (5 yr common) |
| PPA tenor | 10–25 yrs |
| Municipal contract | 10–30 yrs |
| Residential elasticity | -0.2 to -0.6 |
| Margin compression | Single‑digit % points |
Preview the Actual Deliverable
CK Infrastructure Porter's Five Forces Analysis
This Porter's Five Forces analysis for CK Infrastructure evaluates industry rivalry, supplier and buyer power, barriers to entry, and threat of substitutes with data-driven insights and actionable implications. It synthesizes regulatory, market and asset-specific risks relevant to CKI's regulated utilities and infrastructure investments, offering strategic recommendations for investors and managers. This preview shows the exact document you'll receive immediately after purchase—no surprises, no placeholders.

Don't Miss the Bigger Picture
CK Infrastructure faces moderate supplier power, steady buyer demand, high regulatory and capital barriers that limit new entrants, and evolving substitute threats from renewables; competitive rivalry centers on scale and network control. This snapshot highlights key pressures but omits force-by-force ratings and strategic implications. Unlock the full Porter's Five Forces Analysis to access detailed ratings, visuals, and actionable recommendations for investment or strategic planning.
Suppliers Bargaining Power
Concentrated OEMs for critical assets
Concentrated OEMs supply large turbines, transformers, SCADA and meters—top 3 turbine OEMs account for roughly 70% of global installations (2023–24), raising switching costs. Long lead times of 12–24 months and technical lock‑in boost supplier leverage over pricing and service terms. CKI mitigates via framework agreements, multi‑sourcing where feasible, and lifecycle maintenance contracts. Certification and interoperability requirements still constrain substitution.
Fuel and commodity suppliers
Gas and fuel inputs expose CK Infrastructure assets to supplier market power, with global benchmarks such as Brent averaging about $85/bbl in 2024 highlighting continued commodity volatility. Indexed contracts and hedging blunt price swings but cannot remove basis and availability risks, while regulated pass-through in some markets shields margins. Procurement scale and supply-security clauses, plus diversified sourcing, materially moderate supplier influence.
EPC and specialist contractors
Engineering, procurement and construction capacity cycles tighten periodically, increasing lead times and contractor leverage on pricing for large projects. Specialized civil works such as tunnels, bridges and water treatment are concentrated among few global contractors, raising supplier bargaining power. CKI’s sponsor reputation and global pipeline attract competitive bidders, and tools like performance bonds (commonly 5–10% of contract value) and staged payments help rebalance negotiating power.
Skilled labor and O&M services
Scarcity of certified technicians and engineers in energy, water and transport raises wages and O&M outsourcing costs, squeezing margins; global infrastructure investment gap is about US$2.5tr/year (World Bank), while CKI-style concessions typically run 20–30 years, allowing partial recovery but enforcing strict efficiency targets and union/safety-driven cost rigidity. Apprenticeships and digitalization can gradually lower dependence and unit O&M costs.
- Wage/O&M inflation
- Union/safety rigidity
- 20–30yr concessions
- Apprenticeships + digitalization
Capital providers and insurers
Rising rates and tighter insurance markets in 2024 (global 10‑year yields near 4%) have pushed financing and risk‑transfer costs higher, while lenders increasingly demand covenants that can constrain operational flexibility. CKI’s scale, asset backing and investment‑grade profile improve access and pricing versus smaller peers, and growth in green financing and ESG‑linked structures is widening capital sources.
- Higher cost of capital: 10‑yr ~4% (2024)
- Stronger covenant scrutiny from lenders
- CKI advantages: scale, asset backing, investment‑grade
- Green/ESG financing diversifies funding
OEM concentration and fuel volatility heighten risk; scale, hedges and long concessions reduce it
Supplier power is elevated: top‑3 turbine OEMs ~70% share (2023–24), 12–24 month lead times and technical lock‑in raise switching costs. Fuel volatility (Brent ~US$85/bbl in 2024) and concentrated EPC/skill markets increase pricing risk; CKI offsets via framework agreements, multi‑sourcing, hedges and long concessions (20–30 yrs). Scale, performance bonds (5–10%) and ESG finance lower supplier and capital cost pressure.
| Metric | 2024/Value |
|---|---|
| Top‑3 turbine OEM share | ~70% |
| Lead times (OEM/EPC) | 12–24 months |
| Brent | ~US$85/bbl |
| Performance bonds | 5–10% |
| Concession length | 20–30 yrs |
What is included in the product
Detailed Word Document
Tailored Porter's Five Forces analysis of CK Infrastructure that uncovers key drivers of competition, buyer and supplier power, entry barriers and substitute threats, highlighting disruptive forces and strategic levers affecting its pricing, profitability and market position—fully editable for reports and investor materials.
Customizable Excel Spreadsheet
Clear, one-sheet Porter's Five Forces for CK Infrastructure that instantly highlights strategic pressures with a spider chart, lets you customize force levels for new data or regulations, and drops neatly into decks to remove analysis bottlenecks.
Customers Bargaining Power
Regulators and concession authorities
Price caps, revenue formulas and service KPIs set by regulators and concession authorities directly shape CK Infrastructure cash flows, with periodic tariff resets typically every 4–8 years and Australian/Australasian regimes commonly using 5‑year control periods. Authorities can levy penalties or disallow cost pass‑throughs, exerting strong buyer-like power that can compress returns. Transparent engagement and a proven delivery record improve chances of favorable determinations. Periodic resets therefore create both downside risk and re-rating opportunities.
Wholesale offtakers and PPAs
Wholesale offtakers and PPAs concentrate demand via long-term tenors typically 10–25 years, often with investment-grade utilities and grid operators that lower collection risk but cap pricing upside. Standardized creditworthy contracts reduce default exposure yet limit merchant upside. Competitive tenders compress award margins to single-digit percentage points. Contract optionality and CPI or market-price indexation clauses partly restore pricing flexibility and soften buyer leverage.
Municipal and public sector clients
Water, waste and transport services rely on local governments as anchor customers, with contracts typically spanning 10–30 years. In 2024 municipal budget cycles remain annual with 3–5 year capital plans, driving timing and scope of renegotiations. Measurable performance and community impact metrics strongly influence renewals, while transparent reporting and stakeholder engagement reduce incentives to switch providers.
Retail end-users in regulated frameworks
Retail end-users in regulated frameworks have low direct bargaining power because they typically cannot switch network providers; short-run residential price elasticity is modest, roughly -0.2 to -0.6, limiting volume response. Regulatory complaint mechanisms and service standards (tariff reviews, quality-of-service KPIs) indirectly constrain pricing and allowed returns. Shifting consumption patterns (e.g., appliance efficiency, distributed generation) affect volumes, while customer-centric programs ease tariff adjustments.
- Low switching power
- Elasticity ~ -0.2 to -0.6
- Regulatory complaint-driven pricing
- Demand shifts impact volumes
- Customer programs improve tariff acceptance
Procurement via competitive tenders
Procurement via competitive tenders gives buyers strong bargaining power as auctions impose strict terms and intense rivalry compresses expected returns at the bid stage. CKI leans on a proven track record, financing certainty and O&M efficiencies to differentiate and sustain margins. In 2024, disciplined bidding is essential to avoid the winner’s curse.
- Strict auction terms
- Competition compresses returns
- CKI: track record, financing, O&M
- Bid discipline prevents winner’s curse
Price caps, 5-yr tariff resets and long PPAs cap upside; disciplined 2024 bidding critical
Regulatory price caps and periodic tariff resets (typically 4–8 years, 5‑year control periods common) strongly constrain CK Infrastructure cash flows and returns. Long‑dated PPAs (10–25 years) and municipal contracts (10–30 years) reduce collection risk but cap upside; competitive tenders compress award margins to single‑digit percentage points. Residential elasticity is low (~ -0.2 to -0.6), limiting volume-driven pricing relief; disciplined 2024 bidding is essential.
| Metric | Value |
|---|---|
| Tariff reset period | 4–8 yrs (5 yr common) |
| PPA tenor | 10–25 yrs |
| Municipal contract | 10–30 yrs |
| Residential elasticity | -0.2 to -0.6 |
| Margin compression | Single‑digit % points |
Preview the Actual Deliverable
CK Infrastructure Porter's Five Forces Analysis
This Porter's Five Forces analysis for CK Infrastructure evaluates industry rivalry, supplier and buyer power, barriers to entry, and threat of substitutes with data-driven insights and actionable implications. It synthesizes regulatory, market and asset-specific risks relevant to CKI's regulated utilities and infrastructure investments, offering strategic recommendations for investors and managers. This preview shows the exact document you'll receive immediately after purchase—no surprises, no placeholders.
Original: $10.00
-65%$10.00
$3.50Description
Don't Miss the Bigger Picture
CK Infrastructure faces moderate supplier power, steady buyer demand, high regulatory and capital barriers that limit new entrants, and evolving substitute threats from renewables; competitive rivalry centers on scale and network control. This snapshot highlights key pressures but omits force-by-force ratings and strategic implications. Unlock the full Porter's Five Forces Analysis to access detailed ratings, visuals, and actionable recommendations for investment or strategic planning.
Suppliers Bargaining Power
Concentrated OEMs for critical assets
Concentrated OEMs supply large turbines, transformers, SCADA and meters—top 3 turbine OEMs account for roughly 70% of global installations (2023–24), raising switching costs. Long lead times of 12–24 months and technical lock‑in boost supplier leverage over pricing and service terms. CKI mitigates via framework agreements, multi‑sourcing where feasible, and lifecycle maintenance contracts. Certification and interoperability requirements still constrain substitution.
Fuel and commodity suppliers
Gas and fuel inputs expose CK Infrastructure assets to supplier market power, with global benchmarks such as Brent averaging about $85/bbl in 2024 highlighting continued commodity volatility. Indexed contracts and hedging blunt price swings but cannot remove basis and availability risks, while regulated pass-through in some markets shields margins. Procurement scale and supply-security clauses, plus diversified sourcing, materially moderate supplier influence.
EPC and specialist contractors
Engineering, procurement and construction capacity cycles tighten periodically, increasing lead times and contractor leverage on pricing for large projects. Specialized civil works such as tunnels, bridges and water treatment are concentrated among few global contractors, raising supplier bargaining power. CKI’s sponsor reputation and global pipeline attract competitive bidders, and tools like performance bonds (commonly 5–10% of contract value) and staged payments help rebalance negotiating power.
Skilled labor and O&M services
Scarcity of certified technicians and engineers in energy, water and transport raises wages and O&M outsourcing costs, squeezing margins; global infrastructure investment gap is about US$2.5tr/year (World Bank), while CKI-style concessions typically run 20–30 years, allowing partial recovery but enforcing strict efficiency targets and union/safety-driven cost rigidity. Apprenticeships and digitalization can gradually lower dependence and unit O&M costs.
- Wage/O&M inflation
- Union/safety rigidity
- 20–30yr concessions
- Apprenticeships + digitalization
Capital providers and insurers
Rising rates and tighter insurance markets in 2024 (global 10‑year yields near 4%) have pushed financing and risk‑transfer costs higher, while lenders increasingly demand covenants that can constrain operational flexibility. CKI’s scale, asset backing and investment‑grade profile improve access and pricing versus smaller peers, and growth in green financing and ESG‑linked structures is widening capital sources.
- Higher cost of capital: 10‑yr ~4% (2024)
- Stronger covenant scrutiny from lenders
- CKI advantages: scale, asset backing, investment‑grade
- Green/ESG financing diversifies funding
OEM concentration and fuel volatility heighten risk; scale, hedges and long concessions reduce it
Supplier power is elevated: top‑3 turbine OEMs ~70% share (2023–24), 12–24 month lead times and technical lock‑in raise switching costs. Fuel volatility (Brent ~US$85/bbl in 2024) and concentrated EPC/skill markets increase pricing risk; CKI offsets via framework agreements, multi‑sourcing, hedges and long concessions (20–30 yrs). Scale, performance bonds (5–10%) and ESG finance lower supplier and capital cost pressure.
| Metric | 2024/Value |
|---|---|
| Top‑3 turbine OEM share | ~70% |
| Lead times (OEM/EPC) | 12–24 months |
| Brent | ~US$85/bbl |
| Performance bonds | 5–10% |
| Concession length | 20–30 yrs |
What is included in the product
Detailed Word Document
Tailored Porter's Five Forces analysis of CK Infrastructure that uncovers key drivers of competition, buyer and supplier power, entry barriers and substitute threats, highlighting disruptive forces and strategic levers affecting its pricing, profitability and market position—fully editable for reports and investor materials.
Customizable Excel Spreadsheet
Clear, one-sheet Porter's Five Forces for CK Infrastructure that instantly highlights strategic pressures with a spider chart, lets you customize force levels for new data or regulations, and drops neatly into decks to remove analysis bottlenecks.
Customers Bargaining Power
Regulators and concession authorities
Price caps, revenue formulas and service KPIs set by regulators and concession authorities directly shape CK Infrastructure cash flows, with periodic tariff resets typically every 4–8 years and Australian/Australasian regimes commonly using 5‑year control periods. Authorities can levy penalties or disallow cost pass‑throughs, exerting strong buyer-like power that can compress returns. Transparent engagement and a proven delivery record improve chances of favorable determinations. Periodic resets therefore create both downside risk and re-rating opportunities.
Wholesale offtakers and PPAs
Wholesale offtakers and PPAs concentrate demand via long-term tenors typically 10–25 years, often with investment-grade utilities and grid operators that lower collection risk but cap pricing upside. Standardized creditworthy contracts reduce default exposure yet limit merchant upside. Competitive tenders compress award margins to single-digit percentage points. Contract optionality and CPI or market-price indexation clauses partly restore pricing flexibility and soften buyer leverage.
Municipal and public sector clients
Water, waste and transport services rely on local governments as anchor customers, with contracts typically spanning 10–30 years. In 2024 municipal budget cycles remain annual with 3–5 year capital plans, driving timing and scope of renegotiations. Measurable performance and community impact metrics strongly influence renewals, while transparent reporting and stakeholder engagement reduce incentives to switch providers.
Retail end-users in regulated frameworks
Retail end-users in regulated frameworks have low direct bargaining power because they typically cannot switch network providers; short-run residential price elasticity is modest, roughly -0.2 to -0.6, limiting volume response. Regulatory complaint mechanisms and service standards (tariff reviews, quality-of-service KPIs) indirectly constrain pricing and allowed returns. Shifting consumption patterns (e.g., appliance efficiency, distributed generation) affect volumes, while customer-centric programs ease tariff adjustments.
- Low switching power
- Elasticity ~ -0.2 to -0.6
- Regulatory complaint-driven pricing
- Demand shifts impact volumes
- Customer programs improve tariff acceptance
Procurement via competitive tenders
Procurement via competitive tenders gives buyers strong bargaining power as auctions impose strict terms and intense rivalry compresses expected returns at the bid stage. CKI leans on a proven track record, financing certainty and O&M efficiencies to differentiate and sustain margins. In 2024, disciplined bidding is essential to avoid the winner’s curse.
- Strict auction terms
- Competition compresses returns
- CKI: track record, financing, O&M
- Bid discipline prevents winner’s curse
Price caps, 5-yr tariff resets and long PPAs cap upside; disciplined 2024 bidding critical
Regulatory price caps and periodic tariff resets (typically 4–8 years, 5‑year control periods common) strongly constrain CK Infrastructure cash flows and returns. Long‑dated PPAs (10–25 years) and municipal contracts (10–30 years) reduce collection risk but cap upside; competitive tenders compress award margins to single‑digit percentage points. Residential elasticity is low (~ -0.2 to -0.6), limiting volume-driven pricing relief; disciplined 2024 bidding is essential.
| Metric | Value |
|---|---|
| Tariff reset period | 4–8 yrs (5 yr common) |
| PPA tenor | 10–25 yrs |
| Municipal contract | 10–30 yrs |
| Residential elasticity | -0.2 to -0.6 |
| Margin compression | Single‑digit % points |
Preview the Actual Deliverable
CK Infrastructure Porter's Five Forces Analysis
This Porter's Five Forces analysis for CK Infrastructure evaluates industry rivalry, supplier and buyer power, barriers to entry, and threat of substitutes with data-driven insights and actionable implications. It synthesizes regulatory, market and asset-specific risks relevant to CKI's regulated utilities and infrastructure investments, offering strategic recommendations for investors and managers. This preview shows the exact document you'll receive immediately after purchase—no surprises, no placeholders.











