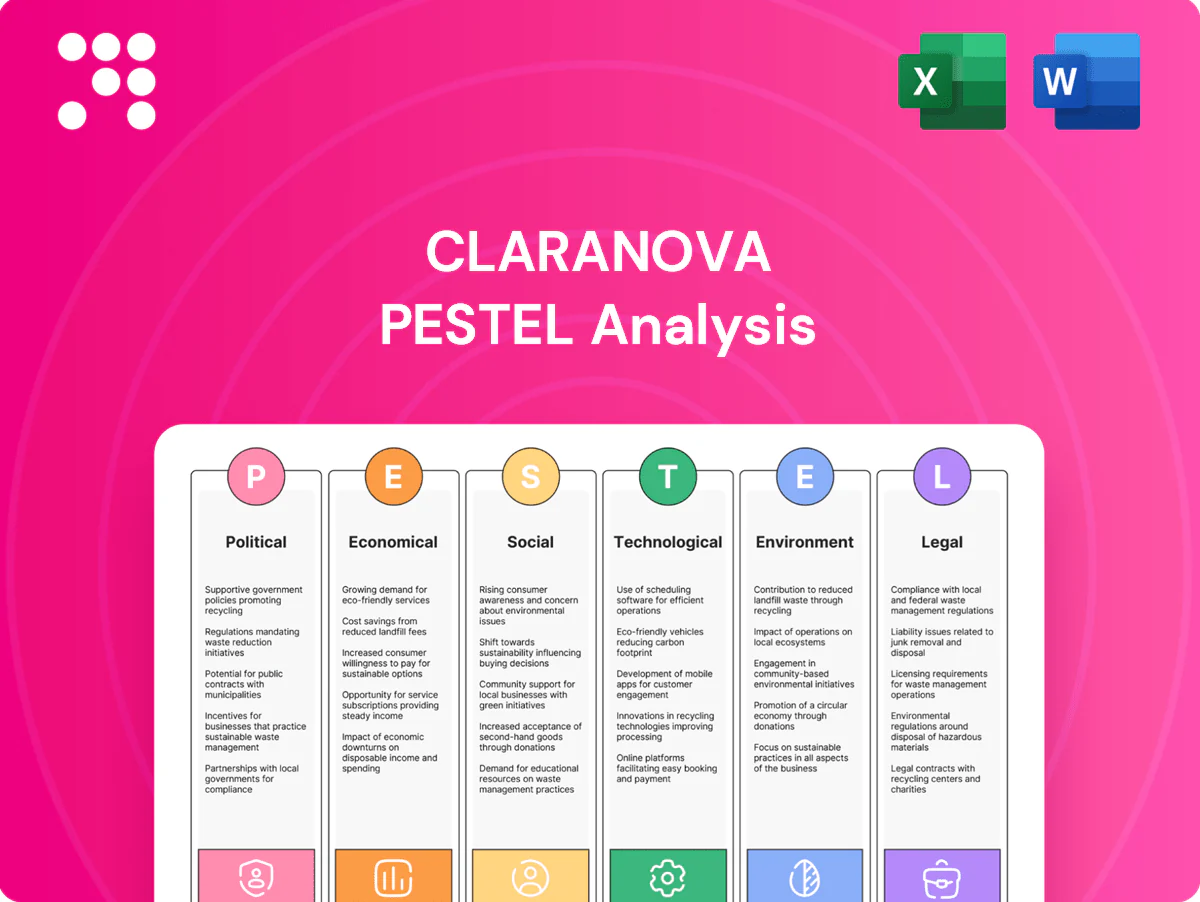
Claranova PESTLE Analysis

Skip the Research. Get the Strategy.
Gain a strategic edge with our PESTLE analysis of Claranova — uncover how political, economic, social, technological, legal and environmental forces are shaping its outlook. Ideal for investors and strategists, this concise briefing highlights risks and opportunities you can act on. Buy the full report for the complete, editable breakdown and immediate download.
Political factors

Cross-border digital trade policies
PlanetArt, Avanquest and myDevices operate across jurisdictions with diverse e-commerce and software rules, facing tariffs, customs friction and digital services taxes that raise costs and can add days to delivery windows. EU VAT e-commerce package (effective July 1, 2021) and over 10 jurisdictions with DSTs materially affect pricing and margin. Favorable trade agreements and streamlined customs measurably boost conversion and repeat purchases, so monitoring EU, US and UK policy shifts is critical for pricing and fulfillment planning.
Data localization and sovereignty
Governments increasingly mandate local storage/processing of personal data—China’s Cybersecurity/Data Security/PIPL regime (2021) and India’s RBI 2018 payment-data localization rule are key examples, while EU transfers face Schrems II constraints; over 50 countries now have localization measures. GDPR exposes firms to fines up to €20m or 4% of global turnover, so compliance reshapes cloud architecture, vendor choice and raises operating costs. Building architectural flexibility early reduces deployment delays, vendor lock-in and regulatory fine risk.

Geopolitical tensions and supply resilience
Political instability and sanctions — including expanded US export controls on advanced chips in 2023–24 — can disrupt sourcing of print substrates, chips and logistics, forcing route changes and higher insurance premia that raise unit economics for Claranova's personalized goods. Software and IoT sales face market restrictions in sensitive regions. Diversified suppliers and nearshoring have demonstrably cut lead‑time and risk exposure for peers.

Public digital and IoT procurement
Smart city and public-sector IoT programs can accelerate myDevices adoption as governments drive municipal IoT procurements; public procurement represents roughly 12% of GDP in OECD countries, shaping sizable addressable demand. Shifts in government budgets and tender rules directly affect pipeline timing, while local content rules often force partnerships; certification and reference deployments measurably boost win rates.
- Public procurement ~12% of GDP (OECD)
- Local content rules → partnership necessity
- Budget/tender timing impacts pipeline
- Certifications/reference projects increase wins
Subsidies and innovation incentives
R&D tax credits and EU digitalization grants, backed by the Digital Europe Programme budget of 7.588 billion euros (2021–2027) and EU R&D intensity 2.33% (2023, Eurostat), materially lower Avanquest net R&D cost and accelerate AI feature rollout.
Policy reversals or tightened eligibility can force reallocation of capital; proactive grant management and compliance preserve a competitive cost base and funding continuity.
- R&D tax credits: leverage national schemes
- EU grants: Digital Europe €7.588B (2021–2027)
- Risk: eligibility tightening
- Mitigation: active grant pipeline management
Regulatory tides: VAT, localization, GDPR fines and export controls reshape digital supply chains
Cross-border e-commerce and DSTs raise costs and delays (EU e‑commerce VAT 2021); GDPR fines up to €20m or 4% global turnover force compliance. Over 50 countries impose localization (China PIPL, India rules); US export controls 2023–24 disrupted chip and print supply chains. Public procurement ~12% GDP and Digital Europe €7.588B (2021–27) shape demand and R&D funding.
| Factor | Impact | Key stat |
|---|---|---|
| Trade/DSTs | Higher costs/delivery | EU VAT e‑commerce 2021 |
| Data localization | Cloud/vendor changes | >50 countries |
| Export controls | Supply risk | US controls 2023–24 |
| Public procurement | Demand/timing | ~12% GDP (OECD) |
| Grants/R&D | Lower net R&D cost | Digital Europe €7.588B |
What is included in the product
 Detailed Word Document
Explores how external macro-environmental factors uniquely affect Claranova across six dimensions—Political, Economic, Social, Technological, Environmental and Legal—using data-driven trends and region-specific regulatory context. Designed for executives, investors and advisors, it highlights threats, opportunities and forward-looking scenarios ready for inclusion in decks, plans or reports.

 Customizable Excel Spreadsheet
A concise, visually segmented PESTLE summary for Claranova that’s easily droppable into presentations and shareable across teams, helping streamline external-risk discussions and speed strategic alignment.
Economic factors

Consumer discretionary demand
Personalized gifts and photo prints are highly cyclical and track household sentiment, so downturns pressure average order value and purchase frequency. Targeted promotions and subscription bundles have proven effective at stabilizing revenue and reducing churn. Claranova’s diversification into software services and B2B IoT offerings further smooths revenue volatility by adding recurring and enterprise streams.
Foreign exchange exposure
Claranova’s multi-currency revenues and costs create translation and transaction risk across its euro reporting base, with USD/EUR and GBP/EUR swings directly affecting reported growth and margins; as of July 2025 EUR/USD ~1.09 and EUR/GBP ~0.87. Natural hedging via cost base alignment and use of FX derivatives has historically damped volatility in similar tech groups. Active pricing agility in local markets preserves contribution margins when exchange moves hit top-line conversion.

Inflation and input costs
Rising paper, ink, packaging and freight costs have compressed gross margins for print and device segments, while US CPI eased to about 3.4% in 2024, keeping input-price pressure elevated; freight levels remain well below 2022 peaks but volatile. Wage inflation has lifted fulfillment and R&D expenses, driven by tighter labor markets in Europe and the US. Dynamic pricing, supplier renegotiation and process automation are essential to offset unit labor increases and protect margins.

Interest rates and capital access
Higher interest rates (ECB deposit rate near 4% in 2024–25) increase financing costs and raise hurdle rates for M&A and capex, but lower tech multiples in 2024 opened acquisition windows for Avanquest-style roll‑ups. Claranova’s software-led revenues benefit from strong cash conversion, supporting investment flexibility, while prudent leverage policies preserve resilience against rate shocks.
- Impact: higher financing costs, higher hurdle rates
- Opportunity: compressed multiples aid roll-ups
- Strength: software cash conversion supports agility
- Risk management: conservative leverage sustains resilience
SME and enterprise IT spending
myDevices and Avanquest depend heavily on SME and enterprise tech budgets; Gartner forecast global IT spending at about $5.3 trillion in 2024, highlighting available market scale. Macro uncertainty often delays deployments and license renewals, lengthening sales cycles and straining cash flows. Demonstrable ROI with sub-12-month payback shortens cycles, while tiered pricing expands reach to smaller SMEs.
- Dependence on business tech budgets
- Gartner: $5.3T global IT spend (2024)
- Macro risk delays renewals
- Clear ROI → faster sales
- Tiered pricing broadens demand
Regulatory tides: VAT, localization, GDPR fines and export controls reshape digital supply chains
Claranova faces cyclical demand in prints/gifts, while software/IoT adds recurring resilience. FX swings (EUR/USD ~1.09, EUR/GBP ~0.87, Jul 2025) and input inflation (US CPI ~3.4% in 2024) pressure margins. ECB deposit rate ~4% (2024–25) raises financing costs but compressed multiples enable roll‑ups. IT spend (~$5.3T global, 2024) supports B2B opportunities.
| Metric | Value |
|---|---|
| EUR/USD | ~1.09 (Jul 2025) |
| EUR/GBP | ~0.87 (Jul 2025) |
| US CPI | ~3.4% (2024) |
| ECB rate | ~4% (2024–25) |
| Global IT spend | $5.3T (2024) |
Preview Before You Purchase
Claranova PESTLE Analysis
The Claranova PESTLE Analysis provides a concise, structured review of political, economic, social, technological, legal, and environmental factors affecting the company. The content and structure shown in the preview is the same document you’ll download after payment. Fully formatted and ready to use, this is the exact file you’ll receive upon purchase.

Skip the Research. Get the Strategy.
Gain a strategic edge with our PESTLE analysis of Claranova — uncover how political, economic, social, technological, legal and environmental forces are shaping its outlook. Ideal for investors and strategists, this concise briefing highlights risks and opportunities you can act on. Buy the full report for the complete, editable breakdown and immediate download.
Political factors
Cross-border digital trade policies
PlanetArt, Avanquest and myDevices operate across jurisdictions with diverse e-commerce and software rules, facing tariffs, customs friction and digital services taxes that raise costs and can add days to delivery windows. EU VAT e-commerce package (effective July 1, 2021) and over 10 jurisdictions with DSTs materially affect pricing and margin. Favorable trade agreements and streamlined customs measurably boost conversion and repeat purchases, so monitoring EU, US and UK policy shifts is critical for pricing and fulfillment planning.
Data localization and sovereignty
Governments increasingly mandate local storage/processing of personal data—China’s Cybersecurity/Data Security/PIPL regime (2021) and India’s RBI 2018 payment-data localization rule are key examples, while EU transfers face Schrems II constraints; over 50 countries now have localization measures. GDPR exposes firms to fines up to €20m or 4% of global turnover, so compliance reshapes cloud architecture, vendor choice and raises operating costs. Building architectural flexibility early reduces deployment delays, vendor lock-in and regulatory fine risk.
Geopolitical tensions and supply resilience
Political instability and sanctions — including expanded US export controls on advanced chips in 2023–24 — can disrupt sourcing of print substrates, chips and logistics, forcing route changes and higher insurance premia that raise unit economics for Claranova's personalized goods. Software and IoT sales face market restrictions in sensitive regions. Diversified suppliers and nearshoring have demonstrably cut lead‑time and risk exposure for peers.
Public digital and IoT procurement
Smart city and public-sector IoT programs can accelerate myDevices adoption as governments drive municipal IoT procurements; public procurement represents roughly 12% of GDP in OECD countries, shaping sizable addressable demand. Shifts in government budgets and tender rules directly affect pipeline timing, while local content rules often force partnerships; certification and reference deployments measurably boost win rates.
- Public procurement ~12% of GDP (OECD)
- Local content rules → partnership necessity
- Budget/tender timing impacts pipeline
- Certifications/reference projects increase wins
Subsidies and innovation incentives
R&D tax credits and EU digitalization grants, backed by the Digital Europe Programme budget of 7.588 billion euros (2021–2027) and EU R&D intensity 2.33% (2023, Eurostat), materially lower Avanquest net R&D cost and accelerate AI feature rollout.
Policy reversals or tightened eligibility can force reallocation of capital; proactive grant management and compliance preserve a competitive cost base and funding continuity.
- R&D tax credits: leverage national schemes
- EU grants: Digital Europe €7.588B (2021–2027)
- Risk: eligibility tightening
- Mitigation: active grant pipeline management
Regulatory tides: VAT, localization, GDPR fines and export controls reshape digital supply chains
Cross-border e-commerce and DSTs raise costs and delays (EU e‑commerce VAT 2021); GDPR fines up to €20m or 4% global turnover force compliance. Over 50 countries impose localization (China PIPL, India rules); US export controls 2023–24 disrupted chip and print supply chains. Public procurement ~12% GDP and Digital Europe €7.588B (2021–27) shape demand and R&D funding.
| Factor | Impact | Key stat |
|---|---|---|
| Trade/DSTs | Higher costs/delivery | EU VAT e‑commerce 2021 |
| Data localization | Cloud/vendor changes | >50 countries |
| Export controls | Supply risk | US controls 2023–24 |
| Public procurement | Demand/timing | ~12% GDP (OECD) |
| Grants/R&D | Lower net R&D cost | Digital Europe €7.588B |
What is included in the product
Detailed Word Document
Explores how external macro-environmental factors uniquely affect Claranova across six dimensions—Political, Economic, Social, Technological, Environmental and Legal—using data-driven trends and region-specific regulatory context. Designed for executives, investors and advisors, it highlights threats, opportunities and forward-looking scenarios ready for inclusion in decks, plans or reports.
Customizable Excel Spreadsheet
A concise, visually segmented PESTLE summary for Claranova that’s easily droppable into presentations and shareable across teams, helping streamline external-risk discussions and speed strategic alignment.
Economic factors
Consumer discretionary demand
Personalized gifts and photo prints are highly cyclical and track household sentiment, so downturns pressure average order value and purchase frequency. Targeted promotions and subscription bundles have proven effective at stabilizing revenue and reducing churn. Claranova’s diversification into software services and B2B IoT offerings further smooths revenue volatility by adding recurring and enterprise streams.
Foreign exchange exposure
Claranova’s multi-currency revenues and costs create translation and transaction risk across its euro reporting base, with USD/EUR and GBP/EUR swings directly affecting reported growth and margins; as of July 2025 EUR/USD ~1.09 and EUR/GBP ~0.87. Natural hedging via cost base alignment and use of FX derivatives has historically damped volatility in similar tech groups. Active pricing agility in local markets preserves contribution margins when exchange moves hit top-line conversion.
Inflation and input costs
Rising paper, ink, packaging and freight costs have compressed gross margins for print and device segments, while US CPI eased to about 3.4% in 2024, keeping input-price pressure elevated; freight levels remain well below 2022 peaks but volatile. Wage inflation has lifted fulfillment and R&D expenses, driven by tighter labor markets in Europe and the US. Dynamic pricing, supplier renegotiation and process automation are essential to offset unit labor increases and protect margins.
Interest rates and capital access
Higher interest rates (ECB deposit rate near 4% in 2024–25) increase financing costs and raise hurdle rates for M&A and capex, but lower tech multiples in 2024 opened acquisition windows for Avanquest-style roll‑ups. Claranova’s software-led revenues benefit from strong cash conversion, supporting investment flexibility, while prudent leverage policies preserve resilience against rate shocks.
- Impact: higher financing costs, higher hurdle rates
- Opportunity: compressed multiples aid roll-ups
- Strength: software cash conversion supports agility
- Risk management: conservative leverage sustains resilience
SME and enterprise IT spending
myDevices and Avanquest depend heavily on SME and enterprise tech budgets; Gartner forecast global IT spending at about $5.3 trillion in 2024, highlighting available market scale. Macro uncertainty often delays deployments and license renewals, lengthening sales cycles and straining cash flows. Demonstrable ROI with sub-12-month payback shortens cycles, while tiered pricing expands reach to smaller SMEs.
- Dependence on business tech budgets
- Gartner: $5.3T global IT spend (2024)
- Macro risk delays renewals
- Clear ROI → faster sales
- Tiered pricing broadens demand
Regulatory tides: VAT, localization, GDPR fines and export controls reshape digital supply chains
Claranova faces cyclical demand in prints/gifts, while software/IoT adds recurring resilience. FX swings (EUR/USD ~1.09, EUR/GBP ~0.87, Jul 2025) and input inflation (US CPI ~3.4% in 2024) pressure margins. ECB deposit rate ~4% (2024–25) raises financing costs but compressed multiples enable roll‑ups. IT spend (~$5.3T global, 2024) supports B2B opportunities.
| Metric | Value |
|---|---|
| EUR/USD | ~1.09 (Jul 2025) |
| EUR/GBP | ~0.87 (Jul 2025) |
| US CPI | ~3.4% (2024) |
| ECB rate | ~4% (2024–25) |
| Global IT spend | $5.3T (2024) |
Preview Before You Purchase
Claranova PESTLE Analysis
The Claranova PESTLE Analysis provides a concise, structured review of political, economic, social, technological, legal, and environmental factors affecting the company. The content and structure shown in the preview is the same document you’ll download after payment. Fully formatted and ready to use, this is the exact file you’ll receive upon purchase.
Original: $10.00
-65%$10.00
$3.50Description
Skip the Research. Get the Strategy.
Gain a strategic edge with our PESTLE analysis of Claranova — uncover how political, economic, social, technological, legal and environmental forces are shaping its outlook. Ideal for investors and strategists, this concise briefing highlights risks and opportunities you can act on. Buy the full report for the complete, editable breakdown and immediate download.
Political factors
Cross-border digital trade policies
PlanetArt, Avanquest and myDevices operate across jurisdictions with diverse e-commerce and software rules, facing tariffs, customs friction and digital services taxes that raise costs and can add days to delivery windows. EU VAT e-commerce package (effective July 1, 2021) and over 10 jurisdictions with DSTs materially affect pricing and margin. Favorable trade agreements and streamlined customs measurably boost conversion and repeat purchases, so monitoring EU, US and UK policy shifts is critical for pricing and fulfillment planning.
Data localization and sovereignty
Governments increasingly mandate local storage/processing of personal data—China’s Cybersecurity/Data Security/PIPL regime (2021) and India’s RBI 2018 payment-data localization rule are key examples, while EU transfers face Schrems II constraints; over 50 countries now have localization measures. GDPR exposes firms to fines up to €20m or 4% of global turnover, so compliance reshapes cloud architecture, vendor choice and raises operating costs. Building architectural flexibility early reduces deployment delays, vendor lock-in and regulatory fine risk.
Geopolitical tensions and supply resilience
Political instability and sanctions — including expanded US export controls on advanced chips in 2023–24 — can disrupt sourcing of print substrates, chips and logistics, forcing route changes and higher insurance premia that raise unit economics for Claranova's personalized goods. Software and IoT sales face market restrictions in sensitive regions. Diversified suppliers and nearshoring have demonstrably cut lead‑time and risk exposure for peers.
Public digital and IoT procurement
Smart city and public-sector IoT programs can accelerate myDevices adoption as governments drive municipal IoT procurements; public procurement represents roughly 12% of GDP in OECD countries, shaping sizable addressable demand. Shifts in government budgets and tender rules directly affect pipeline timing, while local content rules often force partnerships; certification and reference deployments measurably boost win rates.
- Public procurement ~12% of GDP (OECD)
- Local content rules → partnership necessity
- Budget/tender timing impacts pipeline
- Certifications/reference projects increase wins
Subsidies and innovation incentives
R&D tax credits and EU digitalization grants, backed by the Digital Europe Programme budget of 7.588 billion euros (2021–2027) and EU R&D intensity 2.33% (2023, Eurostat), materially lower Avanquest net R&D cost and accelerate AI feature rollout.
Policy reversals or tightened eligibility can force reallocation of capital; proactive grant management and compliance preserve a competitive cost base and funding continuity.
- R&D tax credits: leverage national schemes
- EU grants: Digital Europe €7.588B (2021–2027)
- Risk: eligibility tightening
- Mitigation: active grant pipeline management
Regulatory tides: VAT, localization, GDPR fines and export controls reshape digital supply chains
Cross-border e-commerce and DSTs raise costs and delays (EU e‑commerce VAT 2021); GDPR fines up to €20m or 4% global turnover force compliance. Over 50 countries impose localization (China PIPL, India rules); US export controls 2023–24 disrupted chip and print supply chains. Public procurement ~12% GDP and Digital Europe €7.588B (2021–27) shape demand and R&D funding.
| Factor | Impact | Key stat |
|---|---|---|
| Trade/DSTs | Higher costs/delivery | EU VAT e‑commerce 2021 |
| Data localization | Cloud/vendor changes | >50 countries |
| Export controls | Supply risk | US controls 2023–24 |
| Public procurement | Demand/timing | ~12% GDP (OECD) |
| Grants/R&D | Lower net R&D cost | Digital Europe €7.588B |
What is included in the product
Detailed Word Document
Explores how external macro-environmental factors uniquely affect Claranova across six dimensions—Political, Economic, Social, Technological, Environmental and Legal—using data-driven trends and region-specific regulatory context. Designed for executives, investors and advisors, it highlights threats, opportunities and forward-looking scenarios ready for inclusion in decks, plans or reports.
Customizable Excel Spreadsheet
A concise, visually segmented PESTLE summary for Claranova that’s easily droppable into presentations and shareable across teams, helping streamline external-risk discussions and speed strategic alignment.
Economic factors
Consumer discretionary demand
Personalized gifts and photo prints are highly cyclical and track household sentiment, so downturns pressure average order value and purchase frequency. Targeted promotions and subscription bundles have proven effective at stabilizing revenue and reducing churn. Claranova’s diversification into software services and B2B IoT offerings further smooths revenue volatility by adding recurring and enterprise streams.
Foreign exchange exposure
Claranova’s multi-currency revenues and costs create translation and transaction risk across its euro reporting base, with USD/EUR and GBP/EUR swings directly affecting reported growth and margins; as of July 2025 EUR/USD ~1.09 and EUR/GBP ~0.87. Natural hedging via cost base alignment and use of FX derivatives has historically damped volatility in similar tech groups. Active pricing agility in local markets preserves contribution margins when exchange moves hit top-line conversion.
Inflation and input costs
Rising paper, ink, packaging and freight costs have compressed gross margins for print and device segments, while US CPI eased to about 3.4% in 2024, keeping input-price pressure elevated; freight levels remain well below 2022 peaks but volatile. Wage inflation has lifted fulfillment and R&D expenses, driven by tighter labor markets in Europe and the US. Dynamic pricing, supplier renegotiation and process automation are essential to offset unit labor increases and protect margins.
Interest rates and capital access
Higher interest rates (ECB deposit rate near 4% in 2024–25) increase financing costs and raise hurdle rates for M&A and capex, but lower tech multiples in 2024 opened acquisition windows for Avanquest-style roll‑ups. Claranova’s software-led revenues benefit from strong cash conversion, supporting investment flexibility, while prudent leverage policies preserve resilience against rate shocks.
- Impact: higher financing costs, higher hurdle rates
- Opportunity: compressed multiples aid roll-ups
- Strength: software cash conversion supports agility
- Risk management: conservative leverage sustains resilience
SME and enterprise IT spending
myDevices and Avanquest depend heavily on SME and enterprise tech budgets; Gartner forecast global IT spending at about $5.3 trillion in 2024, highlighting available market scale. Macro uncertainty often delays deployments and license renewals, lengthening sales cycles and straining cash flows. Demonstrable ROI with sub-12-month payback shortens cycles, while tiered pricing expands reach to smaller SMEs.
- Dependence on business tech budgets
- Gartner: $5.3T global IT spend (2024)
- Macro risk delays renewals
- Clear ROI → faster sales
- Tiered pricing broadens demand
Regulatory tides: VAT, localization, GDPR fines and export controls reshape digital supply chains
Claranova faces cyclical demand in prints/gifts, while software/IoT adds recurring resilience. FX swings (EUR/USD ~1.09, EUR/GBP ~0.87, Jul 2025) and input inflation (US CPI ~3.4% in 2024) pressure margins. ECB deposit rate ~4% (2024–25) raises financing costs but compressed multiples enable roll‑ups. IT spend (~$5.3T global, 2024) supports B2B opportunities.
| Metric | Value |
|---|---|
| EUR/USD | ~1.09 (Jul 2025) |
| EUR/GBP | ~0.87 (Jul 2025) |
| US CPI | ~3.4% (2024) |
| ECB rate | ~4% (2024–25) |
| Global IT spend | $5.3T (2024) |
Preview Before You Purchase
Claranova PESTLE Analysis
The Claranova PESTLE Analysis provides a concise, structured review of political, economic, social, technological, legal, and environmental factors affecting the company. The content and structure shown in the preview is the same document you’ll download after payment. Fully formatted and ready to use, this is the exact file you’ll receive upon purchase.











