Clark Group Boston Consulting Group Matrix

Download Your Competitive Advantage
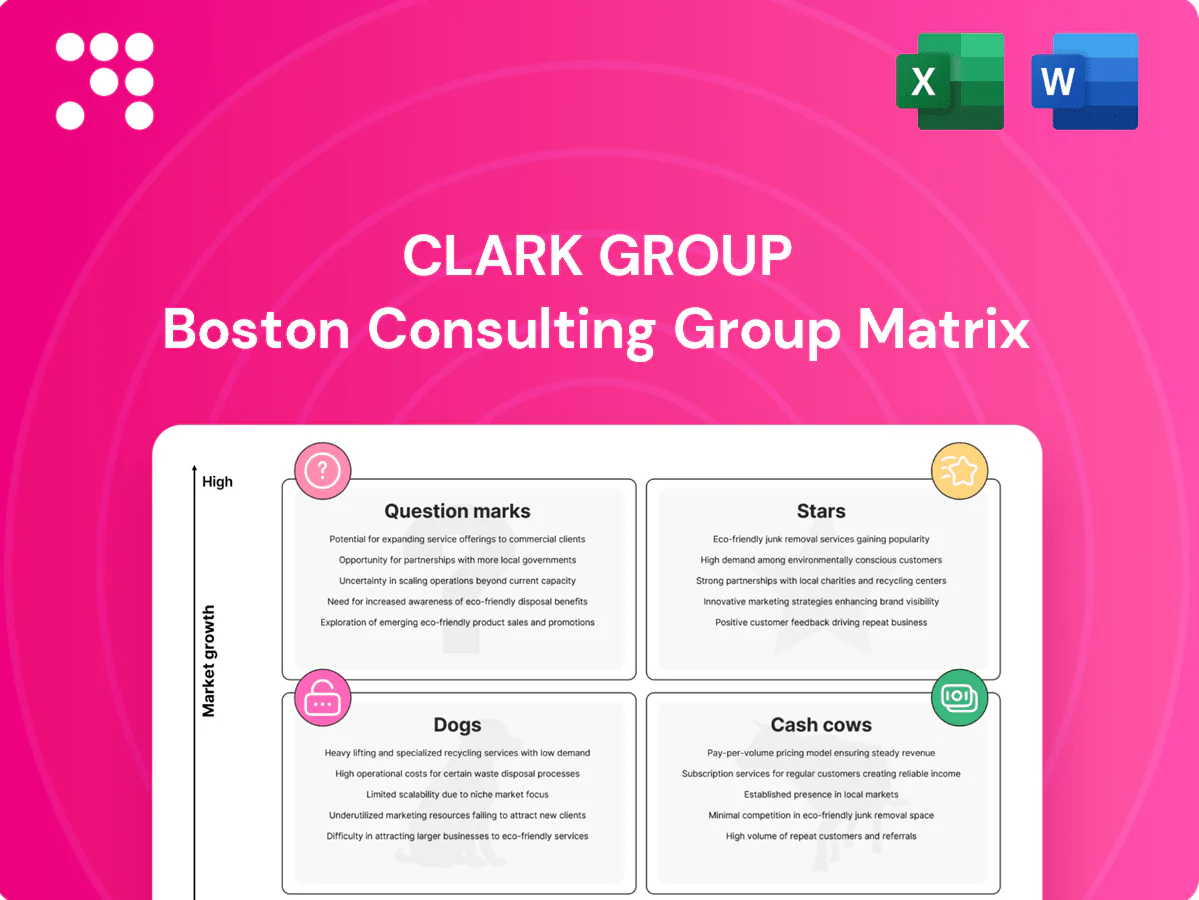
The Clark Group BCG Matrix snapshot shows where products sit — Stars, Cash Cows, Dogs, or Question Marks — and what that really means for your capital and focus. Want the full picture with quadrant-by-quadrant strategy, data-backed moves, and ready-to-present Word + Excel files? Purchase the complete BCG Matrix now and skip the guesswork—act with clarity.
Stars

Mission-critical/data centers
Exploding demand for hyperscale and AI workloads lifted the global data center market to roughly $250B in 2024 with ~8% YoY growth, placing mission-critical/data centers firmly in BCG Stars for Clark. Clark’s deep bench wins complex 24/7 uptime builds and repeat programs, converting heavy upfront cash for speed, power and MEP intensity into high-margin payback. Stay aggressive to convert this momentum into durable advantage.
Federal mega-infrastructure
Federal mega-infrastructure is surging under the IIJA’s $550B new spending (including roughly $110B for roads/bridges and $55B for water), and Clark is repeatedly shortlisted for large bridges, tunnels, transit and water programs. Scale, bonding capacity and delivery experience underpin a leadership position; these projects lock up capital and skilled crews rapidly. Maintain investment in pursuit teams, delivery technology and JV partners to protect and grow share.

Design-build leadership
Owners demand faster integrated delivery; Clark already quarterbacks complex jobs and in 2024 captured a disproportionate share of high-growth design-build work as the sector expanded roughly 6.5% annualized. Clark is winning complex pursuits but sustaining momentum remains marketing- and people-intensive, with design-build now representing about 40% of major procurement pipelines in 2024. Recommend doubling down on precon, VDC, and partner ecosystems to widen the gap.

Healthcare & life sciences complexes
Healthcare and life sciences complexes are regulated, tech-heavy, always-on facilities that fit Clark’s playbook; lab buildouts often exceed $500 per sq ft and command premium margins despite capital intensity. Demand curves remained strong through 2024 with concentrated tenant need in major metros where Clark holds meaningful share. Maintain specialized teams and credentialing to lock in preference and shorten lease-up cycles.
- Regulated, 24/7 operations
- High CAPEX >$500/sq ft
- Premium margins, strong 2024 demand
- Specialized teams + credentialing = market lock
Public–private partnerships (P3)
Clark Group’s P3 pipeline expanded in 2024 following sustained IIJA-driven project funding; the firm has proven structuring and delivery capabilities, translating marquee wins into meaningful share. Growth is high but entails large cash swings and long cycles; projects remain brand-defining. Maintain strict underwriting and broaden sponsor relationships to capture scale.
- 2024: pipeline expansion post-IIJA
- High growth + marquee wins = market share
- Large cash flow volatility, long cycles
- Tight underwriting; expand sponsor network
Hyperscale AI, IIJA megaprojects and premium labs: scale turns cash intensity into advantage
Stars: hyperscale/AI data centers ($250B market, ~8% YoY), federal mega-infra (IIJA $550B pipeline), design-build share (~40% of major pipelines) and life-science labs (> $500/sq ft) drive high growth and premium margins; Clark’s delivery scale and bonding convert cash intensity into durable advantage.
| Segment | 2024 Size/Metric | Growth/Margin |
|---|---|---|
| Data centers | $250B | ~8% YoY, high margins |
| Design-build | ~40% pipeline | ~6.5% sector growth |
| Life sciences | >$500/sq ft | Premium margins |
What is included in the product
 Detailed Word Document
Comprehensive BCG Matrix review of Clark Group's units, identifying Stars, Cash Cows, Question Marks, Dogs and recommended actions.

 Customizable Excel Spreadsheet
One-page BCG matrix that pinpoints underperformers and winners, easing strategic decisions and stakeholder alignment.
Cash Cows

Repeat corporate campuses
Repeat corporate campuses are a Cash Cow: lower-growth opportunities with steady replacement cycles and high share-of-wallet among existing clients, delivering predictable scopes and fewer surprises. In 2024 corporate real estate spend broadly returned to pre-pandemic levels, supporting reliable volume and playbook-driven execution. Strong margins arise from standardized processes; priorities are protecting accounts, sharpening operations, and keeping crews fully utilized.
Tenant improvements & renovations
Tenant improvements & renovations sit in a mature market where Clark holds reliable share with enterprise clients (enterprise accounts typically drive about 60% of TI revenues in large contractors). Short cycles—median TI projects run 4–8 weeks—enable quick cash turns and high working-capital efficiency. Limited promotion is needed; wins stem from responsiveness and service levels, with repeat-business rates often above 70% in enterprise relationships. Standardized package offerings can lift throughput and margins by roughly 5%, per industry benchmarking.

CM-at-Risk for public owners
CM-at-Risk for public owners is a cash cow for Clark Group: stable, process-heavy work driven by predictable public funding and the Infrastructure Investment and Jobs Act which authorized roughly 550 billion dollars for core infrastructure programs. Clark is often first-call on large public projects due to proven preconstruction and cost transparency, yielding consistent positive cashflow beyond project consumption. Maintaining best-in-class precon and cost reporting preserves margin and repeat municipal demand.

Self-perform concrete & civils
Self-perform concrete & civils is a mature cash cow for Clark Group, delivering scale advantages that improve project control and margin capture; in 2024 the business continuity ensured high utilization despite cyclical backlog exposure. Investing in equipment efficiency in 2024 can milks incremental cash by lowering unit costs and shortening cycle times.
- Scale advantages: improved margins and control
- 2024: high utilization despite backlog ties
- Focus: equipment efficiency to boost free cash
Parking structures & utilitarian builds
Parking structures and utilitarian builds sit in Clark Group’s Cash Cows: low-growth market (≈2–3% in 2024) with repeatable designs and processes that drive predictable margins. Clark’s methods are dialed in, making the segment competitive but winnable with strict cost discipline and schedule control. These assets are reliable cash contributors; keeping costs tight and schedules crisp sustains returns and funds growth elsewhere.
- Low growth ≈2–3% (2024)
- Repeatable design → ~10–15% unit cost reduction
- Competitive but winnable with cost discipline
- Reliable cash contributor; prioritize tight costs & crisp schedules
Campus & TI repeat work drives cashflow — TI 60%, repeat >70%, parking +2–3%, IIJA $550B
Clark Group Cash Cows: repeat corporate campuses, tenant improvements, CM-at-Risk, self-perform concrete/civils and parking structures deliver steady cashflow via standardized scopes, high repeat rates and scale—TI: enterprise ~60% revenue, repeat >70%, median 4–8 week cycles; parking growth ≈2–3% (2024); IIJA ≈550B supports public CM work.
| Segment | Key metric | 2024 |
|---|---|---|
| TI | Enterprise share / repeat | 60% / >70% |
| Parking | Market growth | 2–3% |
| Public CM | Support | IIJA ≈$550B |
Preview = Final Product
Clark Group BCG Matrix
The file you’re previewing here is exactly the Clark Group BCG Matrix you’ll receive after purchase. No watermarks, no demo copy—just a fully formatted, ready-to-use report designed for clear strategic decisions. It’s editable, printable, and presentation-ready the moment it lands in your inbox. Buy once and you’ve got the final deliverable, no surprises.

Download Your Competitive Advantage
The Clark Group BCG Matrix snapshot shows where products sit — Stars, Cash Cows, Dogs, or Question Marks — and what that really means for your capital and focus. Want the full picture with quadrant-by-quadrant strategy, data-backed moves, and ready-to-present Word + Excel files? Purchase the complete BCG Matrix now and skip the guesswork—act with clarity.
Stars
Mission-critical/data centers
Exploding demand for hyperscale and AI workloads lifted the global data center market to roughly $250B in 2024 with ~8% YoY growth, placing mission-critical/data centers firmly in BCG Stars for Clark. Clark’s deep bench wins complex 24/7 uptime builds and repeat programs, converting heavy upfront cash for speed, power and MEP intensity into high-margin payback. Stay aggressive to convert this momentum into durable advantage.
Federal mega-infrastructure
Federal mega-infrastructure is surging under the IIJA’s $550B new spending (including roughly $110B for roads/bridges and $55B for water), and Clark is repeatedly shortlisted for large bridges, tunnels, transit and water programs. Scale, bonding capacity and delivery experience underpin a leadership position; these projects lock up capital and skilled crews rapidly. Maintain investment in pursuit teams, delivery technology and JV partners to protect and grow share.
Design-build leadership
Owners demand faster integrated delivery; Clark already quarterbacks complex jobs and in 2024 captured a disproportionate share of high-growth design-build work as the sector expanded roughly 6.5% annualized. Clark is winning complex pursuits but sustaining momentum remains marketing- and people-intensive, with design-build now representing about 40% of major procurement pipelines in 2024. Recommend doubling down on precon, VDC, and partner ecosystems to widen the gap.
Healthcare & life sciences complexes
Healthcare and life sciences complexes are regulated, tech-heavy, always-on facilities that fit Clark’s playbook; lab buildouts often exceed $500 per sq ft and command premium margins despite capital intensity. Demand curves remained strong through 2024 with concentrated tenant need in major metros where Clark holds meaningful share. Maintain specialized teams and credentialing to lock in preference and shorten lease-up cycles.
- Regulated, 24/7 operations
- High CAPEX >$500/sq ft
- Premium margins, strong 2024 demand
- Specialized teams + credentialing = market lock
Public–private partnerships (P3)
Clark Group’s P3 pipeline expanded in 2024 following sustained IIJA-driven project funding; the firm has proven structuring and delivery capabilities, translating marquee wins into meaningful share. Growth is high but entails large cash swings and long cycles; projects remain brand-defining. Maintain strict underwriting and broaden sponsor relationships to capture scale.
- 2024: pipeline expansion post-IIJA
- High growth + marquee wins = market share
- Large cash flow volatility, long cycles
- Tight underwriting; expand sponsor network
Hyperscale AI, IIJA megaprojects and premium labs: scale turns cash intensity into advantage
Stars: hyperscale/AI data centers ($250B market, ~8% YoY), federal mega-infra (IIJA $550B pipeline), design-build share (~40% of major pipelines) and life-science labs (> $500/sq ft) drive high growth and premium margins; Clark’s delivery scale and bonding convert cash intensity into durable advantage.
| Segment | 2024 Size/Metric | Growth/Margin |
|---|---|---|
| Data centers | $250B | ~8% YoY, high margins |
| Design-build | ~40% pipeline | ~6.5% sector growth |
| Life sciences | >$500/sq ft | Premium margins |
What is included in the product
Detailed Word Document
Comprehensive BCG Matrix review of Clark Group's units, identifying Stars, Cash Cows, Question Marks, Dogs and recommended actions.
Customizable Excel Spreadsheet
One-page BCG matrix that pinpoints underperformers and winners, easing strategic decisions and stakeholder alignment.
Cash Cows
Repeat corporate campuses
Repeat corporate campuses are a Cash Cow: lower-growth opportunities with steady replacement cycles and high share-of-wallet among existing clients, delivering predictable scopes and fewer surprises. In 2024 corporate real estate spend broadly returned to pre-pandemic levels, supporting reliable volume and playbook-driven execution. Strong margins arise from standardized processes; priorities are protecting accounts, sharpening operations, and keeping crews fully utilized.
Tenant improvements & renovations
Tenant improvements & renovations sit in a mature market where Clark holds reliable share with enterprise clients (enterprise accounts typically drive about 60% of TI revenues in large contractors). Short cycles—median TI projects run 4–8 weeks—enable quick cash turns and high working-capital efficiency. Limited promotion is needed; wins stem from responsiveness and service levels, with repeat-business rates often above 70% in enterprise relationships. Standardized package offerings can lift throughput and margins by roughly 5%, per industry benchmarking.
CM-at-Risk for public owners
CM-at-Risk for public owners is a cash cow for Clark Group: stable, process-heavy work driven by predictable public funding and the Infrastructure Investment and Jobs Act which authorized roughly 550 billion dollars for core infrastructure programs. Clark is often first-call on large public projects due to proven preconstruction and cost transparency, yielding consistent positive cashflow beyond project consumption. Maintaining best-in-class precon and cost reporting preserves margin and repeat municipal demand.
Self-perform concrete & civils
Self-perform concrete & civils is a mature cash cow for Clark Group, delivering scale advantages that improve project control and margin capture; in 2024 the business continuity ensured high utilization despite cyclical backlog exposure. Investing in equipment efficiency in 2024 can milks incremental cash by lowering unit costs and shortening cycle times.
- Scale advantages: improved margins and control
- 2024: high utilization despite backlog ties
- Focus: equipment efficiency to boost free cash
Parking structures & utilitarian builds
Parking structures and utilitarian builds sit in Clark Group’s Cash Cows: low-growth market (≈2–3% in 2024) with repeatable designs and processes that drive predictable margins. Clark’s methods are dialed in, making the segment competitive but winnable with strict cost discipline and schedule control. These assets are reliable cash contributors; keeping costs tight and schedules crisp sustains returns and funds growth elsewhere.
- Low growth ≈2–3% (2024)
- Repeatable design → ~10–15% unit cost reduction
- Competitive but winnable with cost discipline
- Reliable cash contributor; prioritize tight costs & crisp schedules
Campus & TI repeat work drives cashflow — TI 60%, repeat >70%, parking +2–3%, IIJA $550B
Clark Group Cash Cows: repeat corporate campuses, tenant improvements, CM-at-Risk, self-perform concrete/civils and parking structures deliver steady cashflow via standardized scopes, high repeat rates and scale—TI: enterprise ~60% revenue, repeat >70%, median 4–8 week cycles; parking growth ≈2–3% (2024); IIJA ≈550B supports public CM work.
| Segment | Key metric | 2024 |
|---|---|---|
| TI | Enterprise share / repeat | 60% / >70% |
| Parking | Market growth | 2–3% |
| Public CM | Support | IIJA ≈$550B |
Preview = Final Product
Clark Group BCG Matrix
The file you’re previewing here is exactly the Clark Group BCG Matrix you’ll receive after purchase. No watermarks, no demo copy—just a fully formatted, ready-to-use report designed for clear strategic decisions. It’s editable, printable, and presentation-ready the moment it lands in your inbox. Buy once and you’ve got the final deliverable, no surprises.
Original: $10.00
-65%$10.00
$3.50Description
Download Your Competitive Advantage
The Clark Group BCG Matrix snapshot shows where products sit — Stars, Cash Cows, Dogs, or Question Marks — and what that really means for your capital and focus. Want the full picture with quadrant-by-quadrant strategy, data-backed moves, and ready-to-present Word + Excel files? Purchase the complete BCG Matrix now and skip the guesswork—act with clarity.
Stars
Mission-critical/data centers
Exploding demand for hyperscale and AI workloads lifted the global data center market to roughly $250B in 2024 with ~8% YoY growth, placing mission-critical/data centers firmly in BCG Stars for Clark. Clark’s deep bench wins complex 24/7 uptime builds and repeat programs, converting heavy upfront cash for speed, power and MEP intensity into high-margin payback. Stay aggressive to convert this momentum into durable advantage.
Federal mega-infrastructure
Federal mega-infrastructure is surging under the IIJA’s $550B new spending (including roughly $110B for roads/bridges and $55B for water), and Clark is repeatedly shortlisted for large bridges, tunnels, transit and water programs. Scale, bonding capacity and delivery experience underpin a leadership position; these projects lock up capital and skilled crews rapidly. Maintain investment in pursuit teams, delivery technology and JV partners to protect and grow share.
Design-build leadership
Owners demand faster integrated delivery; Clark already quarterbacks complex jobs and in 2024 captured a disproportionate share of high-growth design-build work as the sector expanded roughly 6.5% annualized. Clark is winning complex pursuits but sustaining momentum remains marketing- and people-intensive, with design-build now representing about 40% of major procurement pipelines in 2024. Recommend doubling down on precon, VDC, and partner ecosystems to widen the gap.
Healthcare & life sciences complexes
Healthcare and life sciences complexes are regulated, tech-heavy, always-on facilities that fit Clark’s playbook; lab buildouts often exceed $500 per sq ft and command premium margins despite capital intensity. Demand curves remained strong through 2024 with concentrated tenant need in major metros where Clark holds meaningful share. Maintain specialized teams and credentialing to lock in preference and shorten lease-up cycles.
- Regulated, 24/7 operations
- High CAPEX >$500/sq ft
- Premium margins, strong 2024 demand
- Specialized teams + credentialing = market lock
Public–private partnerships (P3)
Clark Group’s P3 pipeline expanded in 2024 following sustained IIJA-driven project funding; the firm has proven structuring and delivery capabilities, translating marquee wins into meaningful share. Growth is high but entails large cash swings and long cycles; projects remain brand-defining. Maintain strict underwriting and broaden sponsor relationships to capture scale.
- 2024: pipeline expansion post-IIJA
- High growth + marquee wins = market share
- Large cash flow volatility, long cycles
- Tight underwriting; expand sponsor network
Hyperscale AI, IIJA megaprojects and premium labs: scale turns cash intensity into advantage
Stars: hyperscale/AI data centers ($250B market, ~8% YoY), federal mega-infra (IIJA $550B pipeline), design-build share (~40% of major pipelines) and life-science labs (> $500/sq ft) drive high growth and premium margins; Clark’s delivery scale and bonding convert cash intensity into durable advantage.
| Segment | 2024 Size/Metric | Growth/Margin |
|---|---|---|
| Data centers | $250B | ~8% YoY, high margins |
| Design-build | ~40% pipeline | ~6.5% sector growth |
| Life sciences | >$500/sq ft | Premium margins |
What is included in the product
Detailed Word Document
Comprehensive BCG Matrix review of Clark Group's units, identifying Stars, Cash Cows, Question Marks, Dogs and recommended actions.
Customizable Excel Spreadsheet
One-page BCG matrix that pinpoints underperformers and winners, easing strategic decisions and stakeholder alignment.
Cash Cows
Repeat corporate campuses
Repeat corporate campuses are a Cash Cow: lower-growth opportunities with steady replacement cycles and high share-of-wallet among existing clients, delivering predictable scopes and fewer surprises. In 2024 corporate real estate spend broadly returned to pre-pandemic levels, supporting reliable volume and playbook-driven execution. Strong margins arise from standardized processes; priorities are protecting accounts, sharpening operations, and keeping crews fully utilized.
Tenant improvements & renovations
Tenant improvements & renovations sit in a mature market where Clark holds reliable share with enterprise clients (enterprise accounts typically drive about 60% of TI revenues in large contractors). Short cycles—median TI projects run 4–8 weeks—enable quick cash turns and high working-capital efficiency. Limited promotion is needed; wins stem from responsiveness and service levels, with repeat-business rates often above 70% in enterprise relationships. Standardized package offerings can lift throughput and margins by roughly 5%, per industry benchmarking.
CM-at-Risk for public owners
CM-at-Risk for public owners is a cash cow for Clark Group: stable, process-heavy work driven by predictable public funding and the Infrastructure Investment and Jobs Act which authorized roughly 550 billion dollars for core infrastructure programs. Clark is often first-call on large public projects due to proven preconstruction and cost transparency, yielding consistent positive cashflow beyond project consumption. Maintaining best-in-class precon and cost reporting preserves margin and repeat municipal demand.
Self-perform concrete & civils
Self-perform concrete & civils is a mature cash cow for Clark Group, delivering scale advantages that improve project control and margin capture; in 2024 the business continuity ensured high utilization despite cyclical backlog exposure. Investing in equipment efficiency in 2024 can milks incremental cash by lowering unit costs and shortening cycle times.
- Scale advantages: improved margins and control
- 2024: high utilization despite backlog ties
- Focus: equipment efficiency to boost free cash
Parking structures & utilitarian builds
Parking structures and utilitarian builds sit in Clark Group’s Cash Cows: low-growth market (≈2–3% in 2024) with repeatable designs and processes that drive predictable margins. Clark’s methods are dialed in, making the segment competitive but winnable with strict cost discipline and schedule control. These assets are reliable cash contributors; keeping costs tight and schedules crisp sustains returns and funds growth elsewhere.
- Low growth ≈2–3% (2024)
- Repeatable design → ~10–15% unit cost reduction
- Competitive but winnable with cost discipline
- Reliable cash contributor; prioritize tight costs & crisp schedules
Campus & TI repeat work drives cashflow — TI 60%, repeat >70%, parking +2–3%, IIJA $550B
Clark Group Cash Cows: repeat corporate campuses, tenant improvements, CM-at-Risk, self-perform concrete/civils and parking structures deliver steady cashflow via standardized scopes, high repeat rates and scale—TI: enterprise ~60% revenue, repeat >70%, median 4–8 week cycles; parking growth ≈2–3% (2024); IIJA ≈550B supports public CM work.
| Segment | Key metric | 2024 |
|---|---|---|
| TI | Enterprise share / repeat | 60% / >70% |
| Parking | Market growth | 2–3% |
| Public CM | Support | IIJA ≈$550B |
Preview = Final Product
Clark Group BCG Matrix
The file you’re previewing here is exactly the Clark Group BCG Matrix you’ll receive after purchase. No watermarks, no demo copy—just a fully formatted, ready-to-use report designed for clear strategic decisions. It’s editable, printable, and presentation-ready the moment it lands in your inbox. Buy once and you’ve got the final deliverable, no surprises.











