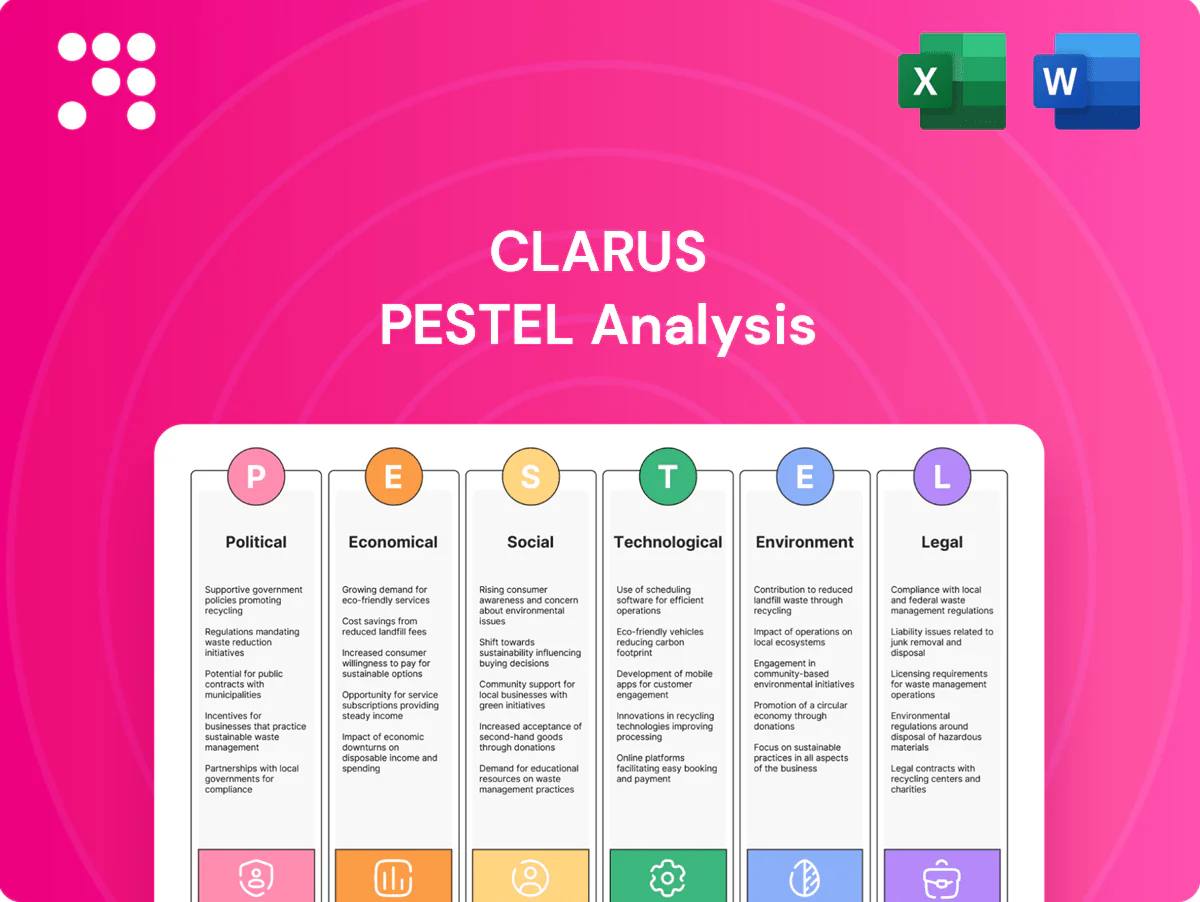
Clarus PESTLE Analysis

Your Shortcut to Market Insight Starts Here
Gain strategic clarity with our Clarus PESTLE Analysis—concise, professionally researched insights into political, economic, social, technological, legal, and environmental forces shaping the company. Perfect for investors and strategists; buy the full version to access the complete, editable report and actionable recommendations instantly.
Political factors

Trade policy volatility
Clarus sources and sells across the US, EU and APAC, exposing it to shifting tariffs and customs rules such as US Section 232 steel/aluminum duties (25%/10%) and regional measures that affect input costs. Tariff hikes on metals, textiles or finished gear can squeeze margins or force price increases. Preferential deals like USMCA, CPTPP (11 members) and RCEP (15 members, ~30% global GDP) can lower landed costs. Continual scenario planning is needed to adapt sourcing and pricing.
Public lands and access
Government policies on public land access directly shape climbing, skiing and overlanding demand across BLM's 245 million acres and USFS's ~193 million acres; the US outdoor recreation sector generated about 1.03 trillion dollars in 2022, amplifying stakes for access rules. Trail permits, park fees and conservation regs can expand or restrict participation; capital investments in access infrastructure boost use while closures depress it, and advocacy/partnerships are pivotal in shaping favorable outcomes.

Defense and hunting policy
Changes in wildlife management and hunting regulations drive Sierra’s ammunition demand, with over 10 million licensed hunters in the U.S. influencing volumes (USFWS surveys). Political sentiment on firearms can tighten controls or spur buying, seen in past spikes in background checks. State-by-state variability across 50 states complicates forecasting. Active engagement with hunting groups and regulators helps anticipate shifts.

Industrial policy and incentives
Clarus can capture subsidies that lower capex and logistics risk: the US CHIPS and Science Act commits about 52 billion USD for domestic advanced manufacturing and the Inflation Reduction Act allocates roughly 369 billion USD for clean-energy tax credits and incentives. Energy incentives under the IRA and IRA-backed tax credits improve cost stability for cleaner production. Local-content rules for IRA EV tax credits and other schemes may force supply-chain adjustments, so Clarus should align footprint strategy to qualify.
- CHIPS: 52bn USD manufacturing funds
- IRA: ~369bn USD clean-energy incentives
- Local-content rules: EV tax-credit domestic-assembly/mineral requirements
Geopolitical risk and sanctions
Sanctions and export controls since the 2022 Russia–Ukraine war and 2022–24 semiconductor export restrictions have disrupted suppliers of metals, electronics and components, while regional conflicts pushed freight costs (container rates rose over 200% in 2020–21 and remained elevated into 2024) and lengthened lead times; currency controls can impede cross‑border payments. Diversified sourcing and 3–6 months of inventory buffers mitigate exposure.
- Sanctions: 2022–24 export controls on semiconductors
- Freight: container rates +200% (2020–21), elevated through 2024
- Payments: currency restrictions impede flows
- Mitigation: diversify suppliers; 3–6 months inventory
Tariffs (steel 25%, aluminum 10%), public‑lands and subsidies reshape costs
Clarus faces tariff/customs risk across US/EU/APAC (eg US Section 232: steel 25%/aluminum 10%) that can raise input costs and compress margins. Public‑land policies over BLM 245M and USFS ~193M acres affect outdoor demand (US outdoor recreation ≈ $1.03T in 2022). Subsidies (CHIPS $52B; IRA ≈ $369B) and sanctions/export controls (2022–24 semiconductor curbs) reshape sourcing and capex.
| Policy | Key figure |
|---|---|
| BLM/USFS acres | 245M / ~193M |
| Outdoor sector | $1.03T (2022) |
| CHIPS / IRA | $52B / ~$369B |
What is included in the product
 Detailed Word Document
Explores how external macro-environmental factors uniquely affect Clarus across Political, Economic, Social, Technological, Environmental and Legal dimensions, with detailed sub-points and examples specific to its industry and region. Backed by current data and forward‑looking insights, the analysis is formatted for executive use—supporting scenario planning, risk mitigation and investor‑grade reporting.

 Customizable Excel Spreadsheet
A concise, visually segmented PESTLE summary that’s easily editable and shareable—slide-ready for presentations, compatible with tablets and Excel, and designed to reduce prep time while clarifying external risks for faster team alignment during planning.
Economic factors

Consumer discretionary cycles
Outdoor gear is highly cyclical: global outdoor equipment market estimated about $19.6B in 2024 with ~5% CAGR, so downturns curb premium purchases while booms lift demand. Black Diamond and Rhino-Rack show strong sensitivity to travel and adventure spending cycles. Promotional intensity rises in slowdowns, compressing margins. Flexible cost structures and variable SG&A help protect cash flow.
Input cost inflation
Input-cost inflation for Clarus is driven by aluminum, steel, resins, technical fabrics and electronics, which together account for the bulk of COGS; LME aluminum hovered near $2,400/ton in 2024 and ocean freight volatility (SCFI swings >30% year-on-year) has amplified pricing and inventory decisions. Active hedging and multi-sourcing have reduced shock exposure, while value engineering has cut unit material costs by mid-single-digit percentages in recent product cycles.

FX and international mix
Revenue in euros, AUD and other currencies exposes Clarus to translation and transaction risk; the US dollar, after peaking above 110 on the DXY in 2022–23, remained elevated into 2024, weighing on overseas sales and margins. Local sourcing and regional production provide natural hedges that reduce cross‑currency costs. Rigorous pricing discipline and active hedging programs (forwards/options) help stabilize reported results and protect margins.

Channel shift and DTC
Direct-to-consumer and e-commerce lift gross margin versus wholesale; global e-commerce hit 22.3% of retail sales in 2024, but DTC brands commonly spend ~20–30% of revenue on marketing and fulfillment. Wholesale partners expand reach but typically require predictable supply and ~60-day terms. Accurate inventory across channels prevents out-of-stocks (≈3–4% sales loss) and omnichannel execution can cut seasonality impacts.
- DTC: +margin, +20–30% marketing/fulfillment spend
- Wholesale: reach, ~60-day terms
- Inventory accuracy: prevents ~3–4% lost sales
- Omnichannel: smooths seasonality
Interest rates and credit
Higher rates (Fed funds 5.25–5.50% mid‑2025) raise working capital and debt service, compressing margins. Tight cycles elevate retailer credit risk and bad‑debt exposure as delinquencies and financing costs climb. Consumers trade down to value lines, pressuring ASPs and mix; prudent liquidity management preserves strategic flexibility.
- Fed funds 5.25–5.50% (mid‑2025)
- US consumer credit ≈ $5.2T (Q1‑2025)
- Focus: liquidity, cost of carry, credit provisions
Tariffs (steel 25%, aluminum 10%), public‑lands and subsidies reshape costs
Outdoor gear market ~$19.6B (2024; ~5% CAGR) is cyclical, compressing premium demand in downturns; input-cost inflation (LME Al ~$2,400/t in 2024) and SCFI freight swings >30% raise COGS. FX exposure and elevated USD pressure margins; DTC (22.3% e‑commerce 2024) boosts gross margin but raises 20–30% marketing/fulfillment spend. Fed funds 5.25–5.50% (mid‑2025) increases working capital costs and retailer credit risk.
| Metric | Value |
|---|---|
| Market size (2024) | $19.6B |
| LME aluminum (2024) | $2,400/t |
| E‑commerce (2024) | 22.3% |
| Fed funds (mid‑2025) | 5.25–5.50% |
| US consumer credit (Q1‑2025) | $5.2T |
Same Document Delivered
Clarus PESTLE Analysis
The preview shown here is the exact Clarus PESTLE Analysis you’ll receive after purchase—fully formatted and ready to use. No placeholders or teasers are included. The content, layout, and file are identical to the downloadable final document available immediately after payment.

Your Shortcut to Market Insight Starts Here
Gain strategic clarity with our Clarus PESTLE Analysis—concise, professionally researched insights into political, economic, social, technological, legal, and environmental forces shaping the company. Perfect for investors and strategists; buy the full version to access the complete, editable report and actionable recommendations instantly.
Political factors
Trade policy volatility
Clarus sources and sells across the US, EU and APAC, exposing it to shifting tariffs and customs rules such as US Section 232 steel/aluminum duties (25%/10%) and regional measures that affect input costs. Tariff hikes on metals, textiles or finished gear can squeeze margins or force price increases. Preferential deals like USMCA, CPTPP (11 members) and RCEP (15 members, ~30% global GDP) can lower landed costs. Continual scenario planning is needed to adapt sourcing and pricing.
Public lands and access
Government policies on public land access directly shape climbing, skiing and overlanding demand across BLM's 245 million acres and USFS's ~193 million acres; the US outdoor recreation sector generated about 1.03 trillion dollars in 2022, amplifying stakes for access rules. Trail permits, park fees and conservation regs can expand or restrict participation; capital investments in access infrastructure boost use while closures depress it, and advocacy/partnerships are pivotal in shaping favorable outcomes.
Defense and hunting policy
Changes in wildlife management and hunting regulations drive Sierra’s ammunition demand, with over 10 million licensed hunters in the U.S. influencing volumes (USFWS surveys). Political sentiment on firearms can tighten controls or spur buying, seen in past spikes in background checks. State-by-state variability across 50 states complicates forecasting. Active engagement with hunting groups and regulators helps anticipate shifts.
Industrial policy and incentives
Clarus can capture subsidies that lower capex and logistics risk: the US CHIPS and Science Act commits about 52 billion USD for domestic advanced manufacturing and the Inflation Reduction Act allocates roughly 369 billion USD for clean-energy tax credits and incentives. Energy incentives under the IRA and IRA-backed tax credits improve cost stability for cleaner production. Local-content rules for IRA EV tax credits and other schemes may force supply-chain adjustments, so Clarus should align footprint strategy to qualify.
- CHIPS: 52bn USD manufacturing funds
- IRA: ~369bn USD clean-energy incentives
- Local-content rules: EV tax-credit domestic-assembly/mineral requirements
Geopolitical risk and sanctions
Sanctions and export controls since the 2022 Russia–Ukraine war and 2022–24 semiconductor export restrictions have disrupted suppliers of metals, electronics and components, while regional conflicts pushed freight costs (container rates rose over 200% in 2020–21 and remained elevated into 2024) and lengthened lead times; currency controls can impede cross‑border payments. Diversified sourcing and 3–6 months of inventory buffers mitigate exposure.
- Sanctions: 2022–24 export controls on semiconductors
- Freight: container rates +200% (2020–21), elevated through 2024
- Payments: currency restrictions impede flows
- Mitigation: diversify suppliers; 3–6 months inventory
Tariffs (steel 25%, aluminum 10%), public‑lands and subsidies reshape costs
Clarus faces tariff/customs risk across US/EU/APAC (eg US Section 232: steel 25%/aluminum 10%) that can raise input costs and compress margins. Public‑land policies over BLM 245M and USFS ~193M acres affect outdoor demand (US outdoor recreation ≈ $1.03T in 2022). Subsidies (CHIPS $52B; IRA ≈ $369B) and sanctions/export controls (2022–24 semiconductor curbs) reshape sourcing and capex.
| Policy | Key figure |
|---|---|
| BLM/USFS acres | 245M / ~193M |
| Outdoor sector | $1.03T (2022) |
| CHIPS / IRA | $52B / ~$369B |
What is included in the product
Detailed Word Document
Explores how external macro-environmental factors uniquely affect Clarus across Political, Economic, Social, Technological, Environmental and Legal dimensions, with detailed sub-points and examples specific to its industry and region. Backed by current data and forward‑looking insights, the analysis is formatted for executive use—supporting scenario planning, risk mitigation and investor‑grade reporting.
Customizable Excel Spreadsheet
A concise, visually segmented PESTLE summary that’s easily editable and shareable—slide-ready for presentations, compatible with tablets and Excel, and designed to reduce prep time while clarifying external risks for faster team alignment during planning.
Economic factors
Consumer discretionary cycles
Outdoor gear is highly cyclical: global outdoor equipment market estimated about $19.6B in 2024 with ~5% CAGR, so downturns curb premium purchases while booms lift demand. Black Diamond and Rhino-Rack show strong sensitivity to travel and adventure spending cycles. Promotional intensity rises in slowdowns, compressing margins. Flexible cost structures and variable SG&A help protect cash flow.
Input cost inflation
Input-cost inflation for Clarus is driven by aluminum, steel, resins, technical fabrics and electronics, which together account for the bulk of COGS; LME aluminum hovered near $2,400/ton in 2024 and ocean freight volatility (SCFI swings >30% year-on-year) has amplified pricing and inventory decisions. Active hedging and multi-sourcing have reduced shock exposure, while value engineering has cut unit material costs by mid-single-digit percentages in recent product cycles.
FX and international mix
Revenue in euros, AUD and other currencies exposes Clarus to translation and transaction risk; the US dollar, after peaking above 110 on the DXY in 2022–23, remained elevated into 2024, weighing on overseas sales and margins. Local sourcing and regional production provide natural hedges that reduce cross‑currency costs. Rigorous pricing discipline and active hedging programs (forwards/options) help stabilize reported results and protect margins.
Channel shift and DTC
Direct-to-consumer and e-commerce lift gross margin versus wholesale; global e-commerce hit 22.3% of retail sales in 2024, but DTC brands commonly spend ~20–30% of revenue on marketing and fulfillment. Wholesale partners expand reach but typically require predictable supply and ~60-day terms. Accurate inventory across channels prevents out-of-stocks (≈3–4% sales loss) and omnichannel execution can cut seasonality impacts.
- DTC: +margin, +20–30% marketing/fulfillment spend
- Wholesale: reach, ~60-day terms
- Inventory accuracy: prevents ~3–4% lost sales
- Omnichannel: smooths seasonality
Interest rates and credit
Higher rates (Fed funds 5.25–5.50% mid‑2025) raise working capital and debt service, compressing margins. Tight cycles elevate retailer credit risk and bad‑debt exposure as delinquencies and financing costs climb. Consumers trade down to value lines, pressuring ASPs and mix; prudent liquidity management preserves strategic flexibility.
- Fed funds 5.25–5.50% (mid‑2025)
- US consumer credit ≈ $5.2T (Q1‑2025)
- Focus: liquidity, cost of carry, credit provisions
Tariffs (steel 25%, aluminum 10%), public‑lands and subsidies reshape costs
Outdoor gear market ~$19.6B (2024; ~5% CAGR) is cyclical, compressing premium demand in downturns; input-cost inflation (LME Al ~$2,400/t in 2024) and SCFI freight swings >30% raise COGS. FX exposure and elevated USD pressure margins; DTC (22.3% e‑commerce 2024) boosts gross margin but raises 20–30% marketing/fulfillment spend. Fed funds 5.25–5.50% (mid‑2025) increases working capital costs and retailer credit risk.
| Metric | Value |
|---|---|
| Market size (2024) | $19.6B |
| LME aluminum (2024) | $2,400/t |
| E‑commerce (2024) | 22.3% |
| Fed funds (mid‑2025) | 5.25–5.50% |
| US consumer credit (Q1‑2025) | $5.2T |
Same Document Delivered
Clarus PESTLE Analysis
The preview shown here is the exact Clarus PESTLE Analysis you’ll receive after purchase—fully formatted and ready to use. No placeholders or teasers are included. The content, layout, and file are identical to the downloadable final document available immediately after payment.
Description
Your Shortcut to Market Insight Starts Here
Gain strategic clarity with our Clarus PESTLE Analysis—concise, professionally researched insights into political, economic, social, technological, legal, and environmental forces shaping the company. Perfect for investors and strategists; buy the full version to access the complete, editable report and actionable recommendations instantly.
Political factors
Trade policy volatility
Clarus sources and sells across the US, EU and APAC, exposing it to shifting tariffs and customs rules such as US Section 232 steel/aluminum duties (25%/10%) and regional measures that affect input costs. Tariff hikes on metals, textiles or finished gear can squeeze margins or force price increases. Preferential deals like USMCA, CPTPP (11 members) and RCEP (15 members, ~30% global GDP) can lower landed costs. Continual scenario planning is needed to adapt sourcing and pricing.
Public lands and access
Government policies on public land access directly shape climbing, skiing and overlanding demand across BLM's 245 million acres and USFS's ~193 million acres; the US outdoor recreation sector generated about 1.03 trillion dollars in 2022, amplifying stakes for access rules. Trail permits, park fees and conservation regs can expand or restrict participation; capital investments in access infrastructure boost use while closures depress it, and advocacy/partnerships are pivotal in shaping favorable outcomes.
Defense and hunting policy
Changes in wildlife management and hunting regulations drive Sierra’s ammunition demand, with over 10 million licensed hunters in the U.S. influencing volumes (USFWS surveys). Political sentiment on firearms can tighten controls or spur buying, seen in past spikes in background checks. State-by-state variability across 50 states complicates forecasting. Active engagement with hunting groups and regulators helps anticipate shifts.
Industrial policy and incentives
Clarus can capture subsidies that lower capex and logistics risk: the US CHIPS and Science Act commits about 52 billion USD for domestic advanced manufacturing and the Inflation Reduction Act allocates roughly 369 billion USD for clean-energy tax credits and incentives. Energy incentives under the IRA and IRA-backed tax credits improve cost stability for cleaner production. Local-content rules for IRA EV tax credits and other schemes may force supply-chain adjustments, so Clarus should align footprint strategy to qualify.
- CHIPS: 52bn USD manufacturing funds
- IRA: ~369bn USD clean-energy incentives
- Local-content rules: EV tax-credit domestic-assembly/mineral requirements
Geopolitical risk and sanctions
Sanctions and export controls since the 2022 Russia–Ukraine war and 2022–24 semiconductor export restrictions have disrupted suppliers of metals, electronics and components, while regional conflicts pushed freight costs (container rates rose over 200% in 2020–21 and remained elevated into 2024) and lengthened lead times; currency controls can impede cross‑border payments. Diversified sourcing and 3–6 months of inventory buffers mitigate exposure.
- Sanctions: 2022–24 export controls on semiconductors
- Freight: container rates +200% (2020–21), elevated through 2024
- Payments: currency restrictions impede flows
- Mitigation: diversify suppliers; 3–6 months inventory
Tariffs (steel 25%, aluminum 10%), public‑lands and subsidies reshape costs
Clarus faces tariff/customs risk across US/EU/APAC (eg US Section 232: steel 25%/aluminum 10%) that can raise input costs and compress margins. Public‑land policies over BLM 245M and USFS ~193M acres affect outdoor demand (US outdoor recreation ≈ $1.03T in 2022). Subsidies (CHIPS $52B; IRA ≈ $369B) and sanctions/export controls (2022–24 semiconductor curbs) reshape sourcing and capex.
| Policy | Key figure |
|---|---|
| BLM/USFS acres | 245M / ~193M |
| Outdoor sector | $1.03T (2022) |
| CHIPS / IRA | $52B / ~$369B |
What is included in the product
Detailed Word Document
Explores how external macro-environmental factors uniquely affect Clarus across Political, Economic, Social, Technological, Environmental and Legal dimensions, with detailed sub-points and examples specific to its industry and region. Backed by current data and forward‑looking insights, the analysis is formatted for executive use—supporting scenario planning, risk mitigation and investor‑grade reporting.
Customizable Excel Spreadsheet
A concise, visually segmented PESTLE summary that’s easily editable and shareable—slide-ready for presentations, compatible with tablets and Excel, and designed to reduce prep time while clarifying external risks for faster team alignment during planning.
Economic factors
Consumer discretionary cycles
Outdoor gear is highly cyclical: global outdoor equipment market estimated about $19.6B in 2024 with ~5% CAGR, so downturns curb premium purchases while booms lift demand. Black Diamond and Rhino-Rack show strong sensitivity to travel and adventure spending cycles. Promotional intensity rises in slowdowns, compressing margins. Flexible cost structures and variable SG&A help protect cash flow.
Input cost inflation
Input-cost inflation for Clarus is driven by aluminum, steel, resins, technical fabrics and electronics, which together account for the bulk of COGS; LME aluminum hovered near $2,400/ton in 2024 and ocean freight volatility (SCFI swings >30% year-on-year) has amplified pricing and inventory decisions. Active hedging and multi-sourcing have reduced shock exposure, while value engineering has cut unit material costs by mid-single-digit percentages in recent product cycles.
FX and international mix
Revenue in euros, AUD and other currencies exposes Clarus to translation and transaction risk; the US dollar, after peaking above 110 on the DXY in 2022–23, remained elevated into 2024, weighing on overseas sales and margins. Local sourcing and regional production provide natural hedges that reduce cross‑currency costs. Rigorous pricing discipline and active hedging programs (forwards/options) help stabilize reported results and protect margins.
Channel shift and DTC
Direct-to-consumer and e-commerce lift gross margin versus wholesale; global e-commerce hit 22.3% of retail sales in 2024, but DTC brands commonly spend ~20–30% of revenue on marketing and fulfillment. Wholesale partners expand reach but typically require predictable supply and ~60-day terms. Accurate inventory across channels prevents out-of-stocks (≈3–4% sales loss) and omnichannel execution can cut seasonality impacts.
- DTC: +margin, +20–30% marketing/fulfillment spend
- Wholesale: reach, ~60-day terms
- Inventory accuracy: prevents ~3–4% lost sales
- Omnichannel: smooths seasonality
Interest rates and credit
Higher rates (Fed funds 5.25–5.50% mid‑2025) raise working capital and debt service, compressing margins. Tight cycles elevate retailer credit risk and bad‑debt exposure as delinquencies and financing costs climb. Consumers trade down to value lines, pressuring ASPs and mix; prudent liquidity management preserves strategic flexibility.
- Fed funds 5.25–5.50% (mid‑2025)
- US consumer credit ≈ $5.2T (Q1‑2025)
- Focus: liquidity, cost of carry, credit provisions
Tariffs (steel 25%, aluminum 10%), public‑lands and subsidies reshape costs
Outdoor gear market ~$19.6B (2024; ~5% CAGR) is cyclical, compressing premium demand in downturns; input-cost inflation (LME Al ~$2,400/t in 2024) and SCFI freight swings >30% raise COGS. FX exposure and elevated USD pressure margins; DTC (22.3% e‑commerce 2024) boosts gross margin but raises 20–30% marketing/fulfillment spend. Fed funds 5.25–5.50% (mid‑2025) increases working capital costs and retailer credit risk.
| Metric | Value |
|---|---|
| Market size (2024) | $19.6B |
| LME aluminum (2024) | $2,400/t |
| E‑commerce (2024) | 22.3% |
| Fed funds (mid‑2025) | 5.25–5.50% |
| US consumer credit (Q1‑2025) | $5.2T |
Same Document Delivered
Clarus PESTLE Analysis
The preview shown here is the exact Clarus PESTLE Analysis you’ll receive after purchase—fully formatted and ready to use. No placeholders or teasers are included. The content, layout, and file are identical to the downloadable final document available immediately after payment.











