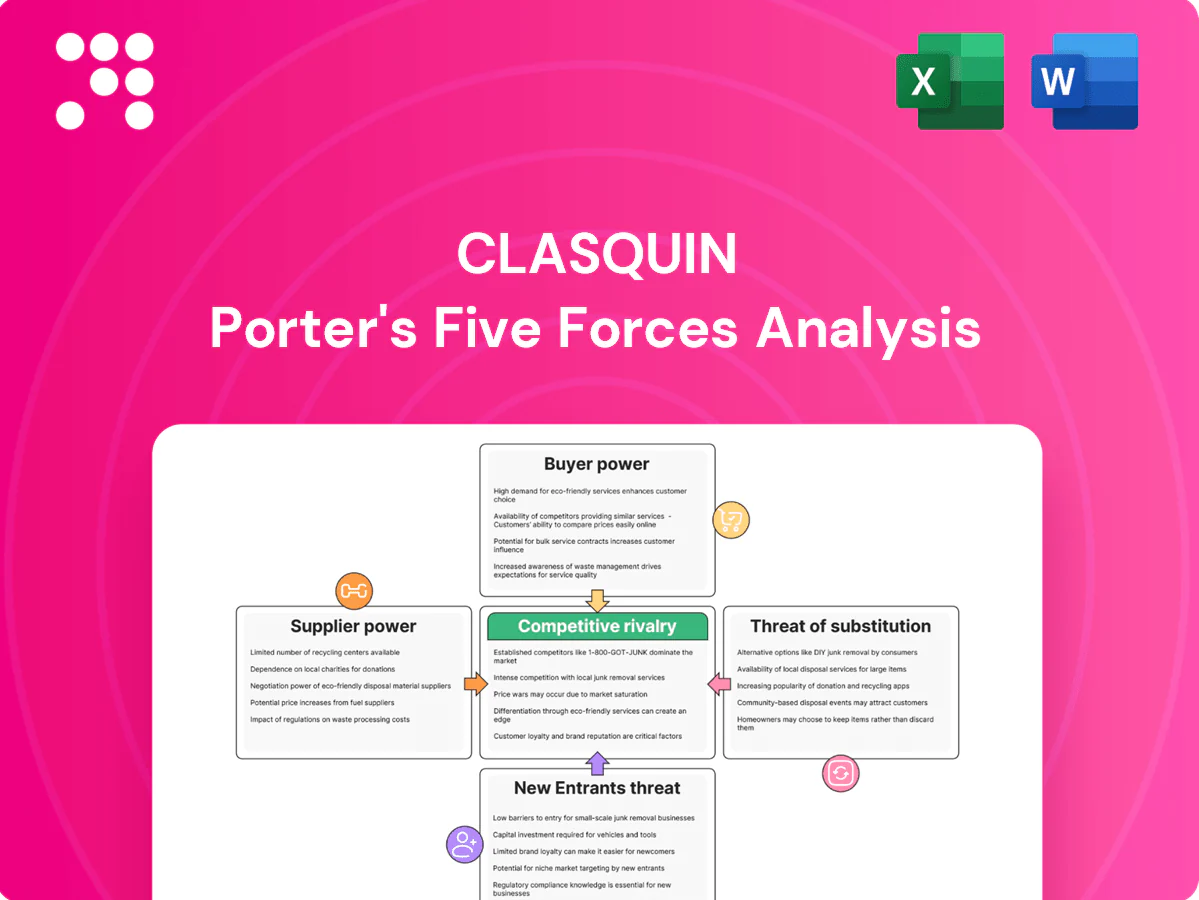
Clasquin Porter's Five Forces Analysis

A Must-Have Tool for Decision-Makers
Clasquin faces mixed pressures: moderate supplier leverage, fragmented buyers with selective bargaining, steady rivalry from global logistics players, manageable threat of new entrants, and emerging substitute digital platforms reshaping value propositions. This snapshot hints at risks and opportunities—unlock the full Porter's Five Forces Analysis for force-by-force ratings, visuals, and actionable strategy to guide investment or strategic decisions.
Suppliers Bargaining Power

Carrier consolidation and alliances
Ocean carriers and major airlines have consolidated, with the top 10 container carriers controlling about 85% of global container capacity in 2024, concentrating pricing power. Alliances coordinate sailings and surcharges, limiting forwarders’ negotiating leverage. Clasquin mitigates this via multi-carrier sourcing and a balanced modal mix (air/sea/rail). Peak-season allocations still tighten supplier grip, forcing higher spot rates and capacity premiums.
Capacity cyclicality and volatility
Air and ocean capacity swings drive sharp rate spikes and rollovers; when space tightness peaks suppliers prioritize higher-yield cargo and strategic partners, squeezing brokers and smaller shippers. Clasquin’s strong forecast accuracy and use of block-space and service contracts help secure allotments and mitigate rollovers. Slack markets briefly flip bargaining power back to freight buyers, but these periods are typically transient.

Port, terminal, and ground handling dependencies
Ports, terminals and ground handlers act as choke points—over 80% of global trade flows via ports and top hubs like Shanghai move on the order of 40 million TEU annually—giving facility operators localized monopolistic leverage. Congestion and labor disruptions raise dwell times by days and drove peak surcharges of several hundred dollars per container in 2021–22, shifting cost and negotiating power toward operators. Diversions are possible but add routing costs and complexity, while strong local agent networks mitigate Clasquin’s exposure.

Fuel and surcharge pass-throughs
Suppliers impose bunker, fuel, congestion and GRI surcharges with limited transparency; global Brent averaged about $86/bbl in 2024, keeping carrier bunker-linked surcharges elevated. Pass-through clauses largely protect Clasquin margins but face client pushback on timing and quantum. Clasquin’s procurement scale can delay or smooth surcharge hits; hedging and modal shifts (sea-to-rail/truck) have softened recent shocks.
- Suppliers: opaque bunker/fuel/GRI surcharges
- Pass-throughs: margin protection vs client resistance
- Scale: procurement timing/size advantage for Clasquin
- Mitigants: hedging, modal shift reduce volatility
Digital data access and integration
Carriers and platforms control APIs, EDI and visibility feeds, using access tiers and deliberate data latency to levy fees or enforce service asymmetry; Clasquin’s integrations and partner ties improve negotiation leverage and data quality, while vendor switching costs remain manageable but non-trivial.
- APIs/EDI controlled by carriers
- Access tiers = fee leverage
- Latency limits parity
- Clasquin tech mitigates risk
- Switching costs moderate
Suppliers hold leverage: top10 ~85%, ports >80%, Brent $86/bbl
Suppliers hold high leverage: top 10 container carriers ~85% of capacity in 2024, ports handle >80% of trade and hubs like Shanghai ~40m TEU, and Brent averaged ~$86/bbl in 2024 driving elevated bunker surcharges. Peak 2021–22 surcharges reached ~$300–$600/TEU; Clasquin offsets via multi-carrier sourcing, contracts, hedging and modal shifts.
| Metric | 2024/Peak |
|---|---|
| Top10 carrier share | ~85% |
| Port trade share | >80% |
| Shanghai TEU | ~40m |
| Brent avg | $86/bbl (2024) |
| Peak surcharges | $300–$600/TEU |
What is included in the product
 Detailed Word Document
Porter’s Five Forces analysis for Clasquin assesses new-entrant risks, supplier and buyer power, substitute threats and competitive rivalry, highlighting disruptive trends, pricing pressures, and entry barriers to deliver actionable strategic insights for investors and management.

 Customizable Excel Spreadsheet
Clasquin Porter's Five Forces one-sheet quickly pinpoints competitive pressures and bottlenecks, simplifying strategic decisions and cutting analysis time; customizable metrics and clean visuals make it deck-ready for executives and non-finance users alike.
Customers Bargaining Power

Price transparency and e-tendering
Shippers now run granular lane-level RFPs and 2024 industry surveys show e-tendering adoption exceeds 50% among large shippers, boosting price transparency and compressing margins.
Digital platforms expose live spot and contract rates, intensifying price pressure and forcing Clasquin to differentiate beyond base rates.
KPI-driven SLAs, demonstrated value proofs and bundled services (visibility, claims reduction) are essential to defend margins against pure price buys.
Enterprise accounts vs SME mix
Larger multinationals press Clasquin with global tenders and concentrated volumes, driving price concessions, while SMEs—which represent 99% of EU businesses—value service and guidance, yielding higher per-account margins but fragmented demand. Clasquin’s enterprise vs SME mix therefore determines average buyer power and margin pressure. Deep sector specialization can raise switching costs and protect pricing.

Service breadth and integration needs
Clients demand end-to-end logistics, customs clearance and real-time visibility, and in 2024 the global 3PL market was estimated at USD 1.4 trillion, raising expectations for integrated services. Deep ERP/WMS and control-tower integration materially increases customer stickiness and reduces buyer churn; lack of integration therefore amplifies buyer leverage. Clasquin’s digital tools can lock in customers by embedding workflows and shared data across the supply chain.

Performance-based penalties and SLAs
Performance-based SLAs for on-time, damage and milestone metrics shift financial and operational risk to forwarders, with buyers enforcing penalties that materially affect margins and drive rapid reallocation of volumes via supplier scorecards and e-auctions. Proactive exception management and real-time tracking cut penalty exposure by resolving deviations before SLA breach, while transparent reporting increases trust and eases renegotiations.
Multi-sourcing and lane splitting
E-tendering >50% compresses margins; dual-sourcing ~60%
E-tendering >50% among large shippers (2024) and live rate platforms increase price transparency, compressing margins. Dual-sourcing ~60% (2024) and global tenders concentrate buyer power; SMEs (99% EU firms) prefer service, lifting per-account margins. Performance SLAs and integrations (ERP/WMS/control tower) raise switching costs when present, else amplify buyer leverage.
| Metric | 2024 | Impact |
|---|---|---|
| E-tendering adoption (large shippers) | >50% | Higher price transparency |
| Dual-sourcing | ~60% | Volume fragmentation |
| Global 3PL market | USD 1.4T | Expectations for integrated services |
Preview Before You Purchase
Clasquin Porter's Five Forces Analysis
This preview shows the exact Clasquin Porter’s Five Forces analysis you’ll receive—fully written, professionally formatted and ready to download the moment you purchase. It includes the full competitive assessment, explanations and implications for strategy. No samples or placeholders—this is the final deliverable. Instant access, no surprises.

A Must-Have Tool for Decision-Makers
Clasquin faces mixed pressures: moderate supplier leverage, fragmented buyers with selective bargaining, steady rivalry from global logistics players, manageable threat of new entrants, and emerging substitute digital platforms reshaping value propositions. This snapshot hints at risks and opportunities—unlock the full Porter's Five Forces Analysis for force-by-force ratings, visuals, and actionable strategy to guide investment or strategic decisions.
Suppliers Bargaining Power
Carrier consolidation and alliances
Ocean carriers and major airlines have consolidated, with the top 10 container carriers controlling about 85% of global container capacity in 2024, concentrating pricing power. Alliances coordinate sailings and surcharges, limiting forwarders’ negotiating leverage. Clasquin mitigates this via multi-carrier sourcing and a balanced modal mix (air/sea/rail). Peak-season allocations still tighten supplier grip, forcing higher spot rates and capacity premiums.
Capacity cyclicality and volatility
Air and ocean capacity swings drive sharp rate spikes and rollovers; when space tightness peaks suppliers prioritize higher-yield cargo and strategic partners, squeezing brokers and smaller shippers. Clasquin’s strong forecast accuracy and use of block-space and service contracts help secure allotments and mitigate rollovers. Slack markets briefly flip bargaining power back to freight buyers, but these periods are typically transient.
Port, terminal, and ground handling dependencies
Ports, terminals and ground handlers act as choke points—over 80% of global trade flows via ports and top hubs like Shanghai move on the order of 40 million TEU annually—giving facility operators localized monopolistic leverage. Congestion and labor disruptions raise dwell times by days and drove peak surcharges of several hundred dollars per container in 2021–22, shifting cost and negotiating power toward operators. Diversions are possible but add routing costs and complexity, while strong local agent networks mitigate Clasquin’s exposure.
Fuel and surcharge pass-throughs
Suppliers impose bunker, fuel, congestion and GRI surcharges with limited transparency; global Brent averaged about $86/bbl in 2024, keeping carrier bunker-linked surcharges elevated. Pass-through clauses largely protect Clasquin margins but face client pushback on timing and quantum. Clasquin’s procurement scale can delay or smooth surcharge hits; hedging and modal shifts (sea-to-rail/truck) have softened recent shocks.
- Suppliers: opaque bunker/fuel/GRI surcharges
- Pass-throughs: margin protection vs client resistance
- Scale: procurement timing/size advantage for Clasquin
- Mitigants: hedging, modal shift reduce volatility
Digital data access and integration
Carriers and platforms control APIs, EDI and visibility feeds, using access tiers and deliberate data latency to levy fees or enforce service asymmetry; Clasquin’s integrations and partner ties improve negotiation leverage and data quality, while vendor switching costs remain manageable but non-trivial.
- APIs/EDI controlled by carriers
- Access tiers = fee leverage
- Latency limits parity
- Clasquin tech mitigates risk
- Switching costs moderate
Suppliers hold leverage: top10 ~85%, ports >80%, Brent $86/bbl
Suppliers hold high leverage: top 10 container carriers ~85% of capacity in 2024, ports handle >80% of trade and hubs like Shanghai ~40m TEU, and Brent averaged ~$86/bbl in 2024 driving elevated bunker surcharges. Peak 2021–22 surcharges reached ~$300–$600/TEU; Clasquin offsets via multi-carrier sourcing, contracts, hedging and modal shifts.
| Metric | 2024/Peak |
|---|---|
| Top10 carrier share | ~85% |
| Port trade share | >80% |
| Shanghai TEU | ~40m |
| Brent avg | $86/bbl (2024) |
| Peak surcharges | $300–$600/TEU |
What is included in the product
Detailed Word Document
Porter’s Five Forces analysis for Clasquin assesses new-entrant risks, supplier and buyer power, substitute threats and competitive rivalry, highlighting disruptive trends, pricing pressures, and entry barriers to deliver actionable strategic insights for investors and management.
Customizable Excel Spreadsheet
Clasquin Porter's Five Forces one-sheet quickly pinpoints competitive pressures and bottlenecks, simplifying strategic decisions and cutting analysis time; customizable metrics and clean visuals make it deck-ready for executives and non-finance users alike.
Customers Bargaining Power
Price transparency and e-tendering
Shippers now run granular lane-level RFPs and 2024 industry surveys show e-tendering adoption exceeds 50% among large shippers, boosting price transparency and compressing margins.
Digital platforms expose live spot and contract rates, intensifying price pressure and forcing Clasquin to differentiate beyond base rates.
KPI-driven SLAs, demonstrated value proofs and bundled services (visibility, claims reduction) are essential to defend margins against pure price buys.
Enterprise accounts vs SME mix
Larger multinationals press Clasquin with global tenders and concentrated volumes, driving price concessions, while SMEs—which represent 99% of EU businesses—value service and guidance, yielding higher per-account margins but fragmented demand. Clasquin’s enterprise vs SME mix therefore determines average buyer power and margin pressure. Deep sector specialization can raise switching costs and protect pricing.
Service breadth and integration needs
Clients demand end-to-end logistics, customs clearance and real-time visibility, and in 2024 the global 3PL market was estimated at USD 1.4 trillion, raising expectations for integrated services. Deep ERP/WMS and control-tower integration materially increases customer stickiness and reduces buyer churn; lack of integration therefore amplifies buyer leverage. Clasquin’s digital tools can lock in customers by embedding workflows and shared data across the supply chain.
Performance-based penalties and SLAs
Performance-based SLAs for on-time, damage and milestone metrics shift financial and operational risk to forwarders, with buyers enforcing penalties that materially affect margins and drive rapid reallocation of volumes via supplier scorecards and e-auctions. Proactive exception management and real-time tracking cut penalty exposure by resolving deviations before SLA breach, while transparent reporting increases trust and eases renegotiations.
Multi-sourcing and lane splitting
E-tendering >50% compresses margins; dual-sourcing ~60%
E-tendering >50% among large shippers (2024) and live rate platforms increase price transparency, compressing margins. Dual-sourcing ~60% (2024) and global tenders concentrate buyer power; SMEs (99% EU firms) prefer service, lifting per-account margins. Performance SLAs and integrations (ERP/WMS/control tower) raise switching costs when present, else amplify buyer leverage.
| Metric | 2024 | Impact |
|---|---|---|
| E-tendering adoption (large shippers) | >50% | Higher price transparency |
| Dual-sourcing | ~60% | Volume fragmentation |
| Global 3PL market | USD 1.4T | Expectations for integrated services |
Preview Before You Purchase
Clasquin Porter's Five Forces Analysis
This preview shows the exact Clasquin Porter’s Five Forces analysis you’ll receive—fully written, professionally formatted and ready to download the moment you purchase. It includes the full competitive assessment, explanations and implications for strategy. No samples or placeholders—this is the final deliverable. Instant access, no surprises.
Original: $10.00
-65%$10.00
$3.50Description
A Must-Have Tool for Decision-Makers
Clasquin faces mixed pressures: moderate supplier leverage, fragmented buyers with selective bargaining, steady rivalry from global logistics players, manageable threat of new entrants, and emerging substitute digital platforms reshaping value propositions. This snapshot hints at risks and opportunities—unlock the full Porter's Five Forces Analysis for force-by-force ratings, visuals, and actionable strategy to guide investment or strategic decisions.
Suppliers Bargaining Power
Carrier consolidation and alliances
Ocean carriers and major airlines have consolidated, with the top 10 container carriers controlling about 85% of global container capacity in 2024, concentrating pricing power. Alliances coordinate sailings and surcharges, limiting forwarders’ negotiating leverage. Clasquin mitigates this via multi-carrier sourcing and a balanced modal mix (air/sea/rail). Peak-season allocations still tighten supplier grip, forcing higher spot rates and capacity premiums.
Capacity cyclicality and volatility
Air and ocean capacity swings drive sharp rate spikes and rollovers; when space tightness peaks suppliers prioritize higher-yield cargo and strategic partners, squeezing brokers and smaller shippers. Clasquin’s strong forecast accuracy and use of block-space and service contracts help secure allotments and mitigate rollovers. Slack markets briefly flip bargaining power back to freight buyers, but these periods are typically transient.
Port, terminal, and ground handling dependencies
Ports, terminals and ground handlers act as choke points—over 80% of global trade flows via ports and top hubs like Shanghai move on the order of 40 million TEU annually—giving facility operators localized monopolistic leverage. Congestion and labor disruptions raise dwell times by days and drove peak surcharges of several hundred dollars per container in 2021–22, shifting cost and negotiating power toward operators. Diversions are possible but add routing costs and complexity, while strong local agent networks mitigate Clasquin’s exposure.
Fuel and surcharge pass-throughs
Suppliers impose bunker, fuel, congestion and GRI surcharges with limited transparency; global Brent averaged about $86/bbl in 2024, keeping carrier bunker-linked surcharges elevated. Pass-through clauses largely protect Clasquin margins but face client pushback on timing and quantum. Clasquin’s procurement scale can delay or smooth surcharge hits; hedging and modal shifts (sea-to-rail/truck) have softened recent shocks.
- Suppliers: opaque bunker/fuel/GRI surcharges
- Pass-throughs: margin protection vs client resistance
- Scale: procurement timing/size advantage for Clasquin
- Mitigants: hedging, modal shift reduce volatility
Digital data access and integration
Carriers and platforms control APIs, EDI and visibility feeds, using access tiers and deliberate data latency to levy fees or enforce service asymmetry; Clasquin’s integrations and partner ties improve negotiation leverage and data quality, while vendor switching costs remain manageable but non-trivial.
- APIs/EDI controlled by carriers
- Access tiers = fee leverage
- Latency limits parity
- Clasquin tech mitigates risk
- Switching costs moderate
Suppliers hold leverage: top10 ~85%, ports >80%, Brent $86/bbl
Suppliers hold high leverage: top 10 container carriers ~85% of capacity in 2024, ports handle >80% of trade and hubs like Shanghai ~40m TEU, and Brent averaged ~$86/bbl in 2024 driving elevated bunker surcharges. Peak 2021–22 surcharges reached ~$300–$600/TEU; Clasquin offsets via multi-carrier sourcing, contracts, hedging and modal shifts.
| Metric | 2024/Peak |
|---|---|
| Top10 carrier share | ~85% |
| Port trade share | >80% |
| Shanghai TEU | ~40m |
| Brent avg | $86/bbl (2024) |
| Peak surcharges | $300–$600/TEU |
What is included in the product
Detailed Word Document
Porter’s Five Forces analysis for Clasquin assesses new-entrant risks, supplier and buyer power, substitute threats and competitive rivalry, highlighting disruptive trends, pricing pressures, and entry barriers to deliver actionable strategic insights for investors and management.
Customizable Excel Spreadsheet
Clasquin Porter's Five Forces one-sheet quickly pinpoints competitive pressures and bottlenecks, simplifying strategic decisions and cutting analysis time; customizable metrics and clean visuals make it deck-ready for executives and non-finance users alike.
Customers Bargaining Power
Price transparency and e-tendering
Shippers now run granular lane-level RFPs and 2024 industry surveys show e-tendering adoption exceeds 50% among large shippers, boosting price transparency and compressing margins.
Digital platforms expose live spot and contract rates, intensifying price pressure and forcing Clasquin to differentiate beyond base rates.
KPI-driven SLAs, demonstrated value proofs and bundled services (visibility, claims reduction) are essential to defend margins against pure price buys.
Enterprise accounts vs SME mix
Larger multinationals press Clasquin with global tenders and concentrated volumes, driving price concessions, while SMEs—which represent 99% of EU businesses—value service and guidance, yielding higher per-account margins but fragmented demand. Clasquin’s enterprise vs SME mix therefore determines average buyer power and margin pressure. Deep sector specialization can raise switching costs and protect pricing.
Service breadth and integration needs
Clients demand end-to-end logistics, customs clearance and real-time visibility, and in 2024 the global 3PL market was estimated at USD 1.4 trillion, raising expectations for integrated services. Deep ERP/WMS and control-tower integration materially increases customer stickiness and reduces buyer churn; lack of integration therefore amplifies buyer leverage. Clasquin’s digital tools can lock in customers by embedding workflows and shared data across the supply chain.
Performance-based penalties and SLAs
Performance-based SLAs for on-time, damage and milestone metrics shift financial and operational risk to forwarders, with buyers enforcing penalties that materially affect margins and drive rapid reallocation of volumes via supplier scorecards and e-auctions. Proactive exception management and real-time tracking cut penalty exposure by resolving deviations before SLA breach, while transparent reporting increases trust and eases renegotiations.
Multi-sourcing and lane splitting
E-tendering >50% compresses margins; dual-sourcing ~60%
E-tendering >50% among large shippers (2024) and live rate platforms increase price transparency, compressing margins. Dual-sourcing ~60% (2024) and global tenders concentrate buyer power; SMEs (99% EU firms) prefer service, lifting per-account margins. Performance SLAs and integrations (ERP/WMS/control tower) raise switching costs when present, else amplify buyer leverage.
| Metric | 2024 | Impact |
|---|---|---|
| E-tendering adoption (large shippers) | >50% | Higher price transparency |
| Dual-sourcing | ~60% | Volume fragmentation |
| Global 3PL market | USD 1.4T | Expectations for integrated services |
Preview Before You Purchase
Clasquin Porter's Five Forces Analysis
This preview shows the exact Clasquin Porter’s Five Forces analysis you’ll receive—fully written, professionally formatted and ready to download the moment you purchase. It includes the full competitive assessment, explanations and implications for strategy. No samples or placeholders—this is the final deliverable. Instant access, no surprises.











