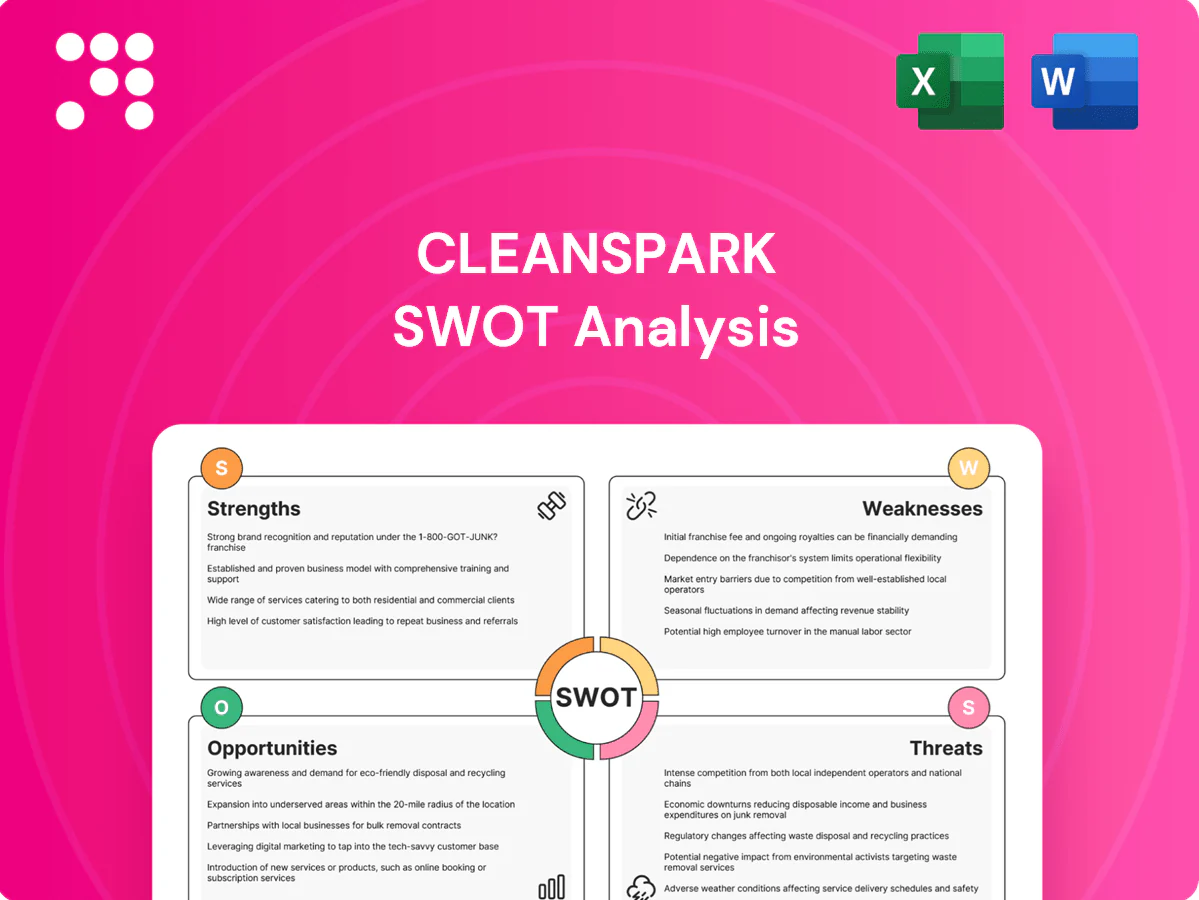
CleanSpark SWOT Analysis

Dive Deeper Into the Company’s Strategic Blueprint
CleanSpark's SWOT preview highlights rapid growth in bitcoin mining and energy software, balanced by regulatory, capital, and grid-exposure risks. Our full SWOT delivers detailed, research-backed strengths, weaknesses, opportunities, and threats. Purchase the complete report for editable Word and Excel deliverables to inform investment, strategy, and presentations.
Strengths

High-efficiency mining fleet
CleanSpark prioritizes latest-generation ASICs (eg S19 XP ~21 J/TH), cutting energy cost per BTC and protecting margins after the April 2024 halving that reduced rewards to 3.125 BTC. Higher efficiency cushions revenue through difficulty spikes, improves uptime in constrained power windows, and compounds advantage as network competition and hashrate rise.
Low-cost, sustainable power access
Operations co-located with renewable and low-carbon sources give CleanSpark cost stability and ESG alignment, enabling lower variable power exposure across its Bitcoin mining and microgrid services.
Use of long-term power contracts and participation in demand response programs reduces effective rates and revenue volatility while unlocking grid services revenue streams.
Sustainable sourcing lowers reputational risk, attracts institutional capital, and supports scalable growth without proportional emissions increases.

Energy infrastructure capabilities
CleanSpark (NASDAQ: CLSK) builds in-house power and data center infrastructure, adding vertical integration that shortens deployment timelines and improves site economics; this model supports optimization of load, curtailment, and grid-services revenue. In-house expertise creates optionality to shift between merchant and contracted revenue streams and can be leveraged across future expansions or strategic partnerships.

Scaled U.S. operational footprint
CleanSpark (NASDAQ: CLSK), headquartered in Tampa, Florida, leverages a concentrated U.S. footprint to access deep capital markets and relatively mature energy grids; proximity to OEMs, service providers and financial institutions improves operational responsiveness, reduces geopolitical risk versus certain international jurisdictions, and allows standardized compliance to streamline multi-site operations.
- US focus: improved access to capital markets (NASDAQ: CLSK)
- Proximity to OEMs and service providers: faster deployment
- Lower geopolitical risk vs offshore operations
- Standardized compliance: efficient multi-site management
Operational discipline and optimization
Operational discipline—firmware tuning, fleet orchestration and uptime focus—has lifted realized hashrate and efficiency; CleanSpark reported miner uptime around 99.5% in 2024, translating to higher BTC production per MW. Data-driven maintenance cuts failure rates and downtime, while dynamic curtailment ties generation to price signals to boost margins. These practices compound returns across cycles.
- Uptime: ~99.5% (2024)
- Firmware/fleet: higher realized hashrate
- Maintenance: lower failure/downtime
- Curtailment: price-aligned profitability
S19 XP efficiency (~21 J/TH) preserves margins after 3.125 BTC halving
CleanSpark leverages S19 XP-class ASICs (~21 J/TH) to lower energy cost per BTC, preserving margins after the April 2024 halving to 3.125 BTC. Renewable co-location, long-term contracts and demand-response participation reduce power exposure and unlock grid-services revenue. Vertical integration and ~99.5% miner uptime in 2024 improve deployment speed, realized hashrate and site economics.
| Metric | Value |
|---|---|
| ASIC efficiency | ~21 J/TH |
| Miner uptime (2024) | ~99.5% |
| Post-halving BTC reward | 3.125 BTC |
| Ticker | CLSK (NASDAQ) |
What is included in the product
 Detailed Word Document
Provides a concise strategic assessment of CleanSpark’s internal strengths and weaknesses and external opportunities and threats, highlighting competitive position and growth drivers (microgrids, energy software, Bitcoin mining) alongside operational, regulatory, and market risks such as crypto volatility, capital intensity, and supply constraints.

 Customizable Excel Spreadsheet
Provides a concise, visual SWOT matrix tailored to CleanSpark for rapid alignment across teams; editable format enables quick updates as energy, microgrid, and crypto-mining dynamics or regulatory shifts evolve.
Weaknesses

Bitcoin price dependence
Revenue remains tightly coupled to BTC spot and hashprice volatility; Bitcoin swung from a ~69,000 peak in Nov 2021 to ~15,500 in Nov 2022 (≈78% drawdown), illustrating how prolonged price drops can compress margins even with efficient hardware. Treasury strategies (hodling/sales timing) can reduce short-term pain but cannot eliminate market exposure, leaving cash flows inherently cyclical and sensitive to high realized volatility (annualized ~60%).
Capital intensity and dilution risk
Fleet growth and site buildouts require significant capex—large-scale mining expansions often demand hundreds of millions of dollars—forcing CleanSpark to access equity or debt that can dilute shareholders or elevate leverage. ASIC upgrade cycles run roughly 12–18 months, pressuring free cash flow as newer, 20–40% more efficient rigs arrive. Returns are highly sensitive to deployment timing versus Bitcoin ~4-year market cycles.

Narrow business concentration
Primary focus on Bitcoin mining leaves CleanSpark concentrated, with mining generating over 90% of revenue in 2024 and reported operational hash rate near 6 EH/s at end‑2024, limiting diversification. Limited non‑mining revenue streams heighten single‑asset risk and exposure to BTC price swings. Fee market shifts or protocol changes (eg, mempool/fee dynamics) could quickly alter mining economics, while diversification into adjacent services remains nascent.

Supply chain reliance on few OEMs
CleanSpark’s ASIC procurement is concentrated among a few manufacturers (notably Bitmain and MicroBT), creating exposure to vendor-specific lead times, pricing power and export controls that can slow fleet upgrades and raise capital intensity. Industry-wide component shortages have delayed planned capacity additions, and variability in ASIC quality has increased downtime and OPEX through higher repair and replacement costs.
- concentrated suppliers: Bitmain, MicroBT
- lead-time/export risk
- component shortages delay builds
- quality variability raises OPEX
Energy cost sensitivity
Power is CleanSpark's largest operating expense; industry Bitcoin-mining opex is typically 50–70% electricity-driven, so regional price spikes or curtailments quickly compress margins. Hedging and long-term supply contracts mitigate but do not fully offset spot volatility. Poor site selection can lock in suboptimal rates for years.
- Electricity share: industry 50–70% of opex
- Spot-risk: regional spikes cut short-term margins
- Hedges: limit but not eliminate volatility
- Site risk: long-term contracts can be costly
BTC-exposed miner: >90% rev, ~6 EH/s, ≈60% vol
Revenue >90% from Bitcoin (2024) and ~6 EH/s end‑2024 concentrate market exposure; BTC realized volatility ≈60% annualized with a 78% peak‑to‑trough drawdown (Nov‑2021 to Nov‑2022). Capex needs and ASIC churn (12–18m) drive dilution/leverage; suppliers concentrated (Bitmain, MicroBT). Electricity is 50–70% of opex, exposing margins to regional spikes.
| Metric | Value |
|---|---|
| Bitcoin revenue share (2024) | >90% |
| Hash rate (end‑2024) | ~6 EH/s |
| BTC realized vol | ≈60% ann. |
| Peak‑to‑trough drawdown | ≈78% |
| Electricity share of opex | 50–70% |
| Major ASIC suppliers | Bitmain, MicroBT |
Preview Before You Purchase
CleanSpark SWOT Analysis
This is the actual CleanSpark SWOT analysis document you’ll receive upon purchase—no surprises, just professional quality. The preview below is taken directly from the full report you'll get; buy to unlock the complete, editable version. You’re viewing a live preview of the real file, ready for immediate download after checkout.

Dive Deeper Into the Company’s Strategic Blueprint
CleanSpark's SWOT preview highlights rapid growth in bitcoin mining and energy software, balanced by regulatory, capital, and grid-exposure risks. Our full SWOT delivers detailed, research-backed strengths, weaknesses, opportunities, and threats. Purchase the complete report for editable Word and Excel deliverables to inform investment, strategy, and presentations.
Strengths
High-efficiency mining fleet
CleanSpark prioritizes latest-generation ASICs (eg S19 XP ~21 J/TH), cutting energy cost per BTC and protecting margins after the April 2024 halving that reduced rewards to 3.125 BTC. Higher efficiency cushions revenue through difficulty spikes, improves uptime in constrained power windows, and compounds advantage as network competition and hashrate rise.
Low-cost, sustainable power access
Operations co-located with renewable and low-carbon sources give CleanSpark cost stability and ESG alignment, enabling lower variable power exposure across its Bitcoin mining and microgrid services.
Use of long-term power contracts and participation in demand response programs reduces effective rates and revenue volatility while unlocking grid services revenue streams.
Sustainable sourcing lowers reputational risk, attracts institutional capital, and supports scalable growth without proportional emissions increases.
Energy infrastructure capabilities
CleanSpark (NASDAQ: CLSK) builds in-house power and data center infrastructure, adding vertical integration that shortens deployment timelines and improves site economics; this model supports optimization of load, curtailment, and grid-services revenue. In-house expertise creates optionality to shift between merchant and contracted revenue streams and can be leveraged across future expansions or strategic partnerships.
Scaled U.S. operational footprint
CleanSpark (NASDAQ: CLSK), headquartered in Tampa, Florida, leverages a concentrated U.S. footprint to access deep capital markets and relatively mature energy grids; proximity to OEMs, service providers and financial institutions improves operational responsiveness, reduces geopolitical risk versus certain international jurisdictions, and allows standardized compliance to streamline multi-site operations.
- US focus: improved access to capital markets (NASDAQ: CLSK)
- Proximity to OEMs and service providers: faster deployment
- Lower geopolitical risk vs offshore operations
- Standardized compliance: efficient multi-site management
Operational discipline and optimization
Operational discipline—firmware tuning, fleet orchestration and uptime focus—has lifted realized hashrate and efficiency; CleanSpark reported miner uptime around 99.5% in 2024, translating to higher BTC production per MW. Data-driven maintenance cuts failure rates and downtime, while dynamic curtailment ties generation to price signals to boost margins. These practices compound returns across cycles.
- Uptime: ~99.5% (2024)
- Firmware/fleet: higher realized hashrate
- Maintenance: lower failure/downtime
- Curtailment: price-aligned profitability
S19 XP efficiency (~21 J/TH) preserves margins after 3.125 BTC halving
CleanSpark leverages S19 XP-class ASICs (~21 J/TH) to lower energy cost per BTC, preserving margins after the April 2024 halving to 3.125 BTC. Renewable co-location, long-term contracts and demand-response participation reduce power exposure and unlock grid-services revenue. Vertical integration and ~99.5% miner uptime in 2024 improve deployment speed, realized hashrate and site economics.
| Metric | Value |
|---|---|
| ASIC efficiency | ~21 J/TH |
| Miner uptime (2024) | ~99.5% |
| Post-halving BTC reward | 3.125 BTC |
| Ticker | CLSK (NASDAQ) |
What is included in the product
Detailed Word Document
Provides a concise strategic assessment of CleanSpark’s internal strengths and weaknesses and external opportunities and threats, highlighting competitive position and growth drivers (microgrids, energy software, Bitcoin mining) alongside operational, regulatory, and market risks such as crypto volatility, capital intensity, and supply constraints.
Customizable Excel Spreadsheet
Provides a concise, visual SWOT matrix tailored to CleanSpark for rapid alignment across teams; editable format enables quick updates as energy, microgrid, and crypto-mining dynamics or regulatory shifts evolve.
Weaknesses
Bitcoin price dependence
Revenue remains tightly coupled to BTC spot and hashprice volatility; Bitcoin swung from a ~69,000 peak in Nov 2021 to ~15,500 in Nov 2022 (≈78% drawdown), illustrating how prolonged price drops can compress margins even with efficient hardware. Treasury strategies (hodling/sales timing) can reduce short-term pain but cannot eliminate market exposure, leaving cash flows inherently cyclical and sensitive to high realized volatility (annualized ~60%).
Capital intensity and dilution risk
Fleet growth and site buildouts require significant capex—large-scale mining expansions often demand hundreds of millions of dollars—forcing CleanSpark to access equity or debt that can dilute shareholders or elevate leverage. ASIC upgrade cycles run roughly 12–18 months, pressuring free cash flow as newer, 20–40% more efficient rigs arrive. Returns are highly sensitive to deployment timing versus Bitcoin ~4-year market cycles.
Narrow business concentration
Primary focus on Bitcoin mining leaves CleanSpark concentrated, with mining generating over 90% of revenue in 2024 and reported operational hash rate near 6 EH/s at end‑2024, limiting diversification. Limited non‑mining revenue streams heighten single‑asset risk and exposure to BTC price swings. Fee market shifts or protocol changes (eg, mempool/fee dynamics) could quickly alter mining economics, while diversification into adjacent services remains nascent.
Supply chain reliance on few OEMs
CleanSpark’s ASIC procurement is concentrated among a few manufacturers (notably Bitmain and MicroBT), creating exposure to vendor-specific lead times, pricing power and export controls that can slow fleet upgrades and raise capital intensity. Industry-wide component shortages have delayed planned capacity additions, and variability in ASIC quality has increased downtime and OPEX through higher repair and replacement costs.
- concentrated suppliers: Bitmain, MicroBT
- lead-time/export risk
- component shortages delay builds
- quality variability raises OPEX
Energy cost sensitivity
Power is CleanSpark's largest operating expense; industry Bitcoin-mining opex is typically 50–70% electricity-driven, so regional price spikes or curtailments quickly compress margins. Hedging and long-term supply contracts mitigate but do not fully offset spot volatility. Poor site selection can lock in suboptimal rates for years.
- Electricity share: industry 50–70% of opex
- Spot-risk: regional spikes cut short-term margins
- Hedges: limit but not eliminate volatility
- Site risk: long-term contracts can be costly
BTC-exposed miner: >90% rev, ~6 EH/s, ≈60% vol
Revenue >90% from Bitcoin (2024) and ~6 EH/s end‑2024 concentrate market exposure; BTC realized volatility ≈60% annualized with a 78% peak‑to‑trough drawdown (Nov‑2021 to Nov‑2022). Capex needs and ASIC churn (12–18m) drive dilution/leverage; suppliers concentrated (Bitmain, MicroBT). Electricity is 50–70% of opex, exposing margins to regional spikes.
| Metric | Value |
|---|---|
| Bitcoin revenue share (2024) | >90% |
| Hash rate (end‑2024) | ~6 EH/s |
| BTC realized vol | ≈60% ann. |
| Peak‑to‑trough drawdown | ≈78% |
| Electricity share of opex | 50–70% |
| Major ASIC suppliers | Bitmain, MicroBT |
Preview Before You Purchase
CleanSpark SWOT Analysis
This is the actual CleanSpark SWOT analysis document you’ll receive upon purchase—no surprises, just professional quality. The preview below is taken directly from the full report you'll get; buy to unlock the complete, editable version. You’re viewing a live preview of the real file, ready for immediate download after checkout.
Description
Dive Deeper Into the Company’s Strategic Blueprint
CleanSpark's SWOT preview highlights rapid growth in bitcoin mining and energy software, balanced by regulatory, capital, and grid-exposure risks. Our full SWOT delivers detailed, research-backed strengths, weaknesses, opportunities, and threats. Purchase the complete report for editable Word and Excel deliverables to inform investment, strategy, and presentations.
Strengths
High-efficiency mining fleet
CleanSpark prioritizes latest-generation ASICs (eg S19 XP ~21 J/TH), cutting energy cost per BTC and protecting margins after the April 2024 halving that reduced rewards to 3.125 BTC. Higher efficiency cushions revenue through difficulty spikes, improves uptime in constrained power windows, and compounds advantage as network competition and hashrate rise.
Low-cost, sustainable power access
Operations co-located with renewable and low-carbon sources give CleanSpark cost stability and ESG alignment, enabling lower variable power exposure across its Bitcoin mining and microgrid services.
Use of long-term power contracts and participation in demand response programs reduces effective rates and revenue volatility while unlocking grid services revenue streams.
Sustainable sourcing lowers reputational risk, attracts institutional capital, and supports scalable growth without proportional emissions increases.
Energy infrastructure capabilities
CleanSpark (NASDAQ: CLSK) builds in-house power and data center infrastructure, adding vertical integration that shortens deployment timelines and improves site economics; this model supports optimization of load, curtailment, and grid-services revenue. In-house expertise creates optionality to shift between merchant and contracted revenue streams and can be leveraged across future expansions or strategic partnerships.
Scaled U.S. operational footprint
CleanSpark (NASDAQ: CLSK), headquartered in Tampa, Florida, leverages a concentrated U.S. footprint to access deep capital markets and relatively mature energy grids; proximity to OEMs, service providers and financial institutions improves operational responsiveness, reduces geopolitical risk versus certain international jurisdictions, and allows standardized compliance to streamline multi-site operations.
- US focus: improved access to capital markets (NASDAQ: CLSK)
- Proximity to OEMs and service providers: faster deployment
- Lower geopolitical risk vs offshore operations
- Standardized compliance: efficient multi-site management
Operational discipline and optimization
Operational discipline—firmware tuning, fleet orchestration and uptime focus—has lifted realized hashrate and efficiency; CleanSpark reported miner uptime around 99.5% in 2024, translating to higher BTC production per MW. Data-driven maintenance cuts failure rates and downtime, while dynamic curtailment ties generation to price signals to boost margins. These practices compound returns across cycles.
- Uptime: ~99.5% (2024)
- Firmware/fleet: higher realized hashrate
- Maintenance: lower failure/downtime
- Curtailment: price-aligned profitability
S19 XP efficiency (~21 J/TH) preserves margins after 3.125 BTC halving
CleanSpark leverages S19 XP-class ASICs (~21 J/TH) to lower energy cost per BTC, preserving margins after the April 2024 halving to 3.125 BTC. Renewable co-location, long-term contracts and demand-response participation reduce power exposure and unlock grid-services revenue. Vertical integration and ~99.5% miner uptime in 2024 improve deployment speed, realized hashrate and site economics.
| Metric | Value |
|---|---|
| ASIC efficiency | ~21 J/TH |
| Miner uptime (2024) | ~99.5% |
| Post-halving BTC reward | 3.125 BTC |
| Ticker | CLSK (NASDAQ) |
What is included in the product
Detailed Word Document
Provides a concise strategic assessment of CleanSpark’s internal strengths and weaknesses and external opportunities and threats, highlighting competitive position and growth drivers (microgrids, energy software, Bitcoin mining) alongside operational, regulatory, and market risks such as crypto volatility, capital intensity, and supply constraints.
Customizable Excel Spreadsheet
Provides a concise, visual SWOT matrix tailored to CleanSpark for rapid alignment across teams; editable format enables quick updates as energy, microgrid, and crypto-mining dynamics or regulatory shifts evolve.
Weaknesses
Bitcoin price dependence
Revenue remains tightly coupled to BTC spot and hashprice volatility; Bitcoin swung from a ~69,000 peak in Nov 2021 to ~15,500 in Nov 2022 (≈78% drawdown), illustrating how prolonged price drops can compress margins even with efficient hardware. Treasury strategies (hodling/sales timing) can reduce short-term pain but cannot eliminate market exposure, leaving cash flows inherently cyclical and sensitive to high realized volatility (annualized ~60%).
Capital intensity and dilution risk
Fleet growth and site buildouts require significant capex—large-scale mining expansions often demand hundreds of millions of dollars—forcing CleanSpark to access equity or debt that can dilute shareholders or elevate leverage. ASIC upgrade cycles run roughly 12–18 months, pressuring free cash flow as newer, 20–40% more efficient rigs arrive. Returns are highly sensitive to deployment timing versus Bitcoin ~4-year market cycles.
Narrow business concentration
Primary focus on Bitcoin mining leaves CleanSpark concentrated, with mining generating over 90% of revenue in 2024 and reported operational hash rate near 6 EH/s at end‑2024, limiting diversification. Limited non‑mining revenue streams heighten single‑asset risk and exposure to BTC price swings. Fee market shifts or protocol changes (eg, mempool/fee dynamics) could quickly alter mining economics, while diversification into adjacent services remains nascent.
Supply chain reliance on few OEMs
CleanSpark’s ASIC procurement is concentrated among a few manufacturers (notably Bitmain and MicroBT), creating exposure to vendor-specific lead times, pricing power and export controls that can slow fleet upgrades and raise capital intensity. Industry-wide component shortages have delayed planned capacity additions, and variability in ASIC quality has increased downtime and OPEX through higher repair and replacement costs.
- concentrated suppliers: Bitmain, MicroBT
- lead-time/export risk
- component shortages delay builds
- quality variability raises OPEX
Energy cost sensitivity
Power is CleanSpark's largest operating expense; industry Bitcoin-mining opex is typically 50–70% electricity-driven, so regional price spikes or curtailments quickly compress margins. Hedging and long-term supply contracts mitigate but do not fully offset spot volatility. Poor site selection can lock in suboptimal rates for years.
- Electricity share: industry 50–70% of opex
- Spot-risk: regional spikes cut short-term margins
- Hedges: limit but not eliminate volatility
- Site risk: long-term contracts can be costly
BTC-exposed miner: >90% rev, ~6 EH/s, ≈60% vol
Revenue >90% from Bitcoin (2024) and ~6 EH/s end‑2024 concentrate market exposure; BTC realized volatility ≈60% annualized with a 78% peak‑to‑trough drawdown (Nov‑2021 to Nov‑2022). Capex needs and ASIC churn (12–18m) drive dilution/leverage; suppliers concentrated (Bitmain, MicroBT). Electricity is 50–70% of opex, exposing margins to regional spikes.
| Metric | Value |
|---|---|
| Bitcoin revenue share (2024) | >90% |
| Hash rate (end‑2024) | ~6 EH/s |
| BTC realized vol | ≈60% ann. |
| Peak‑to‑trough drawdown | ≈78% |
| Electricity share of opex | 50–70% |
| Major ASIC suppliers | Bitmain, MicroBT |
Preview Before You Purchase
CleanSpark SWOT Analysis
This is the actual CleanSpark SWOT analysis document you’ll receive upon purchase—no surprises, just professional quality. The preview below is taken directly from the full report you'll get; buy to unlock the complete, editable version. You’re viewing a live preview of the real file, ready for immediate download after checkout.











