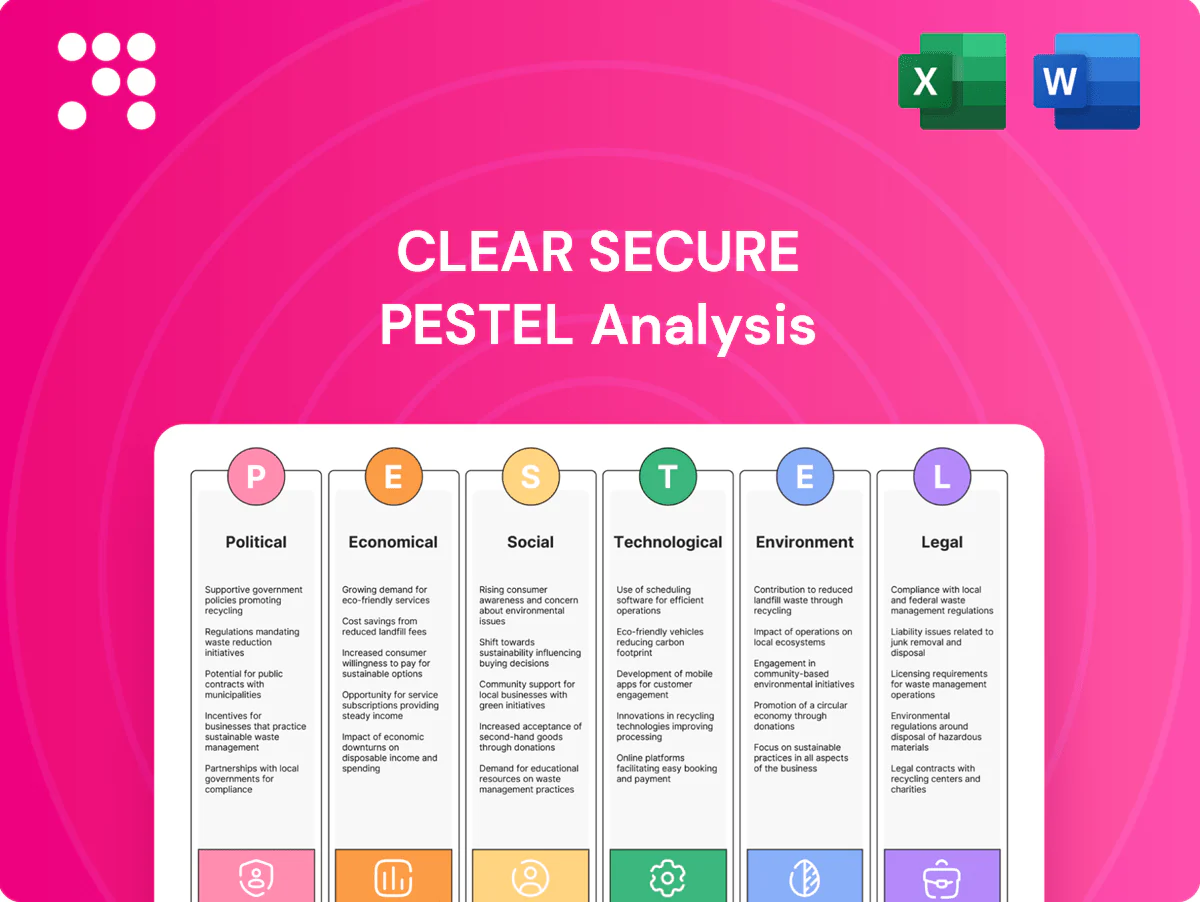
Clear Secure PESTLE Analysis

Make Smarter Strategic Decisions with a Complete PESTEL View
Discover how political, economic, social, technological, legal, and environmental forces are shaping Clear Secure’s strategic outlook in our concise PESTLE brief. Use these insights to anticipate risks, spot opportunities, and sharpen your investment thesis. Purchase the full analysis for the complete, editable report and actionable recommendations.
Political factors

Aviation security policy alignment
National security priorities set stricter standards for identity screening and airport access, shaping Clear Secure’s product requirements. Alignment with TSA and analogous agencies enables lane access and program expansion, supporting Clear’s presence at over 50 airports and serving millions of travelers. Policy shifts that tighten identity or biometric rules raise compliance costs and create higher barriers to entry for competitors. Political backing for secure, seamless travel increases adoption and public funding opportunities.
Public–private partnerships
Access to checkpoints and venues for Clear often hinges on government and quasi-government contracts; US federal procurement exceeded 700 billion in FY2024, underscoring the scale of public-sector buying power. Stable partnerships can lock in long-term lanes and data-sharing frameworks, improving member throughput. Changes in administrations or procurement rules may alter renewal cadence, while transparent collaboration boosts legitimacy and scale.

Digital identity initiatives
Governments exploring digital IDs can either complement Clear Secure’s private identity platform or compete directly; as of 2024 more than 150 countries have national digital ID programs, creating mixed opportunities. Active participation in standards bodies positions Clear as an implementation partner and boosts bids for public contracts. Public endorsement by governments can rapidly increase consumer trust and enrollment, while fragmented national approaches complicate cross‑border rollout and scale economies.

Geopolitical travel volatility
Geopolitical tensions and health advisories drive sharp swings in passenger volumes and venue access, with IATA reporting global RPKs at about 97% of 2019 levels in 2024; lower travel demand directly depresses CLEAR subscription conversions and renewals, squeezing recurring revenue. Rapid rebounds—TSA recorded a 2.9 million passenger peak on July 3, 2023—strain operations and staffing at checkpoints, while political stability enables predictable throughput planning.
- IATA 2024 RPKs ~97% of 2019
- TSA peak 2.9M passengers (Jul 3, 2023)
- Subscription revenue tied to passenger throughput
- Political stability = predictable staffing/planning
Data sovereignty pressures
Policymakers increasingly demand local data storage and control, driven by regimes such as the EU GDPR and India’s Digital Personal Data Protection Act 2023, forcing Clear to consider regional infrastructure and independent audits to lawfully transfer biometric data. Divergent national rules raise operating complexity and uplift compliance costs, while proven local compliance facilitates market entry into highly regulated EU and APAC venues.
- Local storage & audits: regional data centers, third-party attestations
- Regulatory drivers: GDPR; India DPDP Act 2023
- Impact: higher OPEX/CapEx, increased contractual complexity
- Benefit: smoother entry into regulated airports/venues
Biometric airport access grows with TSA alignment, security focus and stricter data laws
National security priorities and TSA alignment shape CLEAR’s biometric requirements and lane access, supporting operations at over 50 airports and millions of members. US federal procurement topped 700B in FY2024, affecting contract scale; IATA reported 2024 RPKs ~97% of 2019, linking passenger throughput to subscription revenue. GDPR and India DPDP Act 2023 force local data controls, raising OPEX/CapEx and compliance audits.
| Metric | Value |
|---|---|
| US federal procurement FY2024 | $700B+ |
| IATA 2024 RPKs vs 2019 | ~97% |
| TSA peak (Jul 3, 2023) | 2.9M pax |
What is included in the product
 Detailed Word Document
Explores how macro-environmental forces uniquely affect Clear Secure across Political, Economic, Social, Technological, Environmental, and Legal dimensions, with each category expanded into actionable sub-points and examples specific to the company and industry. Backed by current data and forward-looking insights, it’s designed for executives, investors, and strategists to identify threats, opportunities, and scenario-ready responses.

 Customizable Excel Spreadsheet
A concise, visually segmented PESTLE summary for Clear Secure that distills external risks and opportunities into an easily shareable format, ideal for quick reference in meetings or slide decks. It lets teams align faster, add contextual notes, and support strategy discussions with clear, actionable insights.
Economic factors

Air travel demand cycles
Passenger volumes are the primary driver of CLEAR enrollments and usage; IATA reported 2024 global air passengers at about 4.4 billion, roughly 95–96% of 2019 levels. Economic expansions boost business travel and premium convenience spending, lifting renewals. Recessions pressure renewals and increase downgrade rates, squeezing recurring revenue. CLEAR's expansion into stadiums, sports venues and non-airport sites helps smooth this cyclicality.
Subscription pricing power
Recurring revenue for Clear hinges on subscription pricing, perceived value, and realized wait-time savings; consumers tolerate higher fees when time saved is clear. Clear’s footprint at 50+ airports and venues as of 2024 and high reliability raise willingness to pay. Co-branded bundles with card issuers (e.g., AmEx partnerships) can lift ARPU but often compress platform take rates. Elasticity testing—used in 2023–24—guides churn-safe price moves.

Inflation and operating costs
Hardware, staffing and site leases face clear inflationary pressure as US CPI averaged about 3.4% in 2024, pushing input costs for biometric kiosks and facility rents. Airport frontline wages rose roughly 5% YoY in 2024, increasing unit screening costs per passenger. Efficiency gains from automation can protect margins by lowering labor intensity. Long-term vendor contracts mute price volatility but constrain operational flexibility.

Partnership economics
Revenue-sharing with airports, airlines and card issuers materially shapes CLEARs unit economics; company disclosures show partnerships across over 60 airports and venues as of mid-2025. Co-marketing subsidies from partners reduce incremental acquisition cost per member. Concentration with a few large partners amplifies revenue volatility while a balanced partner mix stabilizes contribution margins.
- Revenue-share: key driver
- Co-marketing reduces CAC
- Concentration = partner risk
- Portfolio balance stabilizes margins
Capital markets and rates
Expansion requires capital for kiosks, sensors and software; with the US federal funds rate near 5.25–5.50% in 2024–2025, higher hurdle rates and leasing costs increase project IRRs needed and raise OPEX for financed deployments.
Recurring subscription cash flow, which comprises the majority of Clear Secure’s revenue mix, helps self-fund rollouts and reduces near-term dilution; however, negative market sentiment toward biometrics can compress valuation and raise dilution risk on any future equity raises.
- Rate environment: Fed funds ~5.25–5.50%
- Capex needs: kiosks, sensors, software
- Funding: subscription-driven cash generation
- Risk: biometric sentiment → valuation/dilution
Biometric airport access grows with TSA alignment, security focus and stricter data laws
Passenger volumes (IATA 2024 ~4.4bn) and disposable income drive CLEAR subscriptions; recessions cut renewals. Inflation (US CPI 2024 ~3.4%) raises input costs while automation offsets labor. Fed funds ~5.25–5.50% (2024–25) lifts capex hurdles but subscription cash flow supports rollouts.
| Metric | Value |
|---|---|
| Global pax | ~4.4bn (2024) |
| US CPI | ~3.4% (2024) |
| Fed funds | 5.25–5.50% (2024–25) |
Preview the Actual Deliverable
Clear Secure PESTLE Analysis
The preview shown here is the exact Clear Secure PESTLE Analysis you’ll receive after purchase—fully formatted and ready to use. This file contains the complete political, economic, social, technological, legal, and environmental evaluation as presented. No placeholders or teasers—what you see is the final, downloadable document.

Make Smarter Strategic Decisions with a Complete PESTEL View
Discover how political, economic, social, technological, legal, and environmental forces are shaping Clear Secure’s strategic outlook in our concise PESTLE brief. Use these insights to anticipate risks, spot opportunities, and sharpen your investment thesis. Purchase the full analysis for the complete, editable report and actionable recommendations.
Political factors
Aviation security policy alignment
National security priorities set stricter standards for identity screening and airport access, shaping Clear Secure’s product requirements. Alignment with TSA and analogous agencies enables lane access and program expansion, supporting Clear’s presence at over 50 airports and serving millions of travelers. Policy shifts that tighten identity or biometric rules raise compliance costs and create higher barriers to entry for competitors. Political backing for secure, seamless travel increases adoption and public funding opportunities.
Public–private partnerships
Access to checkpoints and venues for Clear often hinges on government and quasi-government contracts; US federal procurement exceeded 700 billion in FY2024, underscoring the scale of public-sector buying power. Stable partnerships can lock in long-term lanes and data-sharing frameworks, improving member throughput. Changes in administrations or procurement rules may alter renewal cadence, while transparent collaboration boosts legitimacy and scale.
Digital identity initiatives
Governments exploring digital IDs can either complement Clear Secure’s private identity platform or compete directly; as of 2024 more than 150 countries have national digital ID programs, creating mixed opportunities. Active participation in standards bodies positions Clear as an implementation partner and boosts bids for public contracts. Public endorsement by governments can rapidly increase consumer trust and enrollment, while fragmented national approaches complicate cross‑border rollout and scale economies.
Geopolitical travel volatility
Geopolitical tensions and health advisories drive sharp swings in passenger volumes and venue access, with IATA reporting global RPKs at about 97% of 2019 levels in 2024; lower travel demand directly depresses CLEAR subscription conversions and renewals, squeezing recurring revenue. Rapid rebounds—TSA recorded a 2.9 million passenger peak on July 3, 2023—strain operations and staffing at checkpoints, while political stability enables predictable throughput planning.
- IATA 2024 RPKs ~97% of 2019
- TSA peak 2.9M passengers (Jul 3, 2023)
- Subscription revenue tied to passenger throughput
- Political stability = predictable staffing/planning
Data sovereignty pressures
Policymakers increasingly demand local data storage and control, driven by regimes such as the EU GDPR and India’s Digital Personal Data Protection Act 2023, forcing Clear to consider regional infrastructure and independent audits to lawfully transfer biometric data. Divergent national rules raise operating complexity and uplift compliance costs, while proven local compliance facilitates market entry into highly regulated EU and APAC venues.
- Local storage & audits: regional data centers, third-party attestations
- Regulatory drivers: GDPR; India DPDP Act 2023
- Impact: higher OPEX/CapEx, increased contractual complexity
- Benefit: smoother entry into regulated airports/venues
Biometric airport access grows with TSA alignment, security focus and stricter data laws
National security priorities and TSA alignment shape CLEAR’s biometric requirements and lane access, supporting operations at over 50 airports and millions of members. US federal procurement topped 700B in FY2024, affecting contract scale; IATA reported 2024 RPKs ~97% of 2019, linking passenger throughput to subscription revenue. GDPR and India DPDP Act 2023 force local data controls, raising OPEX/CapEx and compliance audits.
| Metric | Value |
|---|---|
| US federal procurement FY2024 | $700B+ |
| IATA 2024 RPKs vs 2019 | ~97% |
| TSA peak (Jul 3, 2023) | 2.9M pax |
What is included in the product
Detailed Word Document
Explores how macro-environmental forces uniquely affect Clear Secure across Political, Economic, Social, Technological, Environmental, and Legal dimensions, with each category expanded into actionable sub-points and examples specific to the company and industry. Backed by current data and forward-looking insights, it’s designed for executives, investors, and strategists to identify threats, opportunities, and scenario-ready responses.
Customizable Excel Spreadsheet
A concise, visually segmented PESTLE summary for Clear Secure that distills external risks and opportunities into an easily shareable format, ideal for quick reference in meetings or slide decks. It lets teams align faster, add contextual notes, and support strategy discussions with clear, actionable insights.
Economic factors
Air travel demand cycles
Passenger volumes are the primary driver of CLEAR enrollments and usage; IATA reported 2024 global air passengers at about 4.4 billion, roughly 95–96% of 2019 levels. Economic expansions boost business travel and premium convenience spending, lifting renewals. Recessions pressure renewals and increase downgrade rates, squeezing recurring revenue. CLEAR's expansion into stadiums, sports venues and non-airport sites helps smooth this cyclicality.
Subscription pricing power
Recurring revenue for Clear hinges on subscription pricing, perceived value, and realized wait-time savings; consumers tolerate higher fees when time saved is clear. Clear’s footprint at 50+ airports and venues as of 2024 and high reliability raise willingness to pay. Co-branded bundles with card issuers (e.g., AmEx partnerships) can lift ARPU but often compress platform take rates. Elasticity testing—used in 2023–24—guides churn-safe price moves.
Inflation and operating costs
Hardware, staffing and site leases face clear inflationary pressure as US CPI averaged about 3.4% in 2024, pushing input costs for biometric kiosks and facility rents. Airport frontline wages rose roughly 5% YoY in 2024, increasing unit screening costs per passenger. Efficiency gains from automation can protect margins by lowering labor intensity. Long-term vendor contracts mute price volatility but constrain operational flexibility.
Partnership economics
Revenue-sharing with airports, airlines and card issuers materially shapes CLEARs unit economics; company disclosures show partnerships across over 60 airports and venues as of mid-2025. Co-marketing subsidies from partners reduce incremental acquisition cost per member. Concentration with a few large partners amplifies revenue volatility while a balanced partner mix stabilizes contribution margins.
- Revenue-share: key driver
- Co-marketing reduces CAC
- Concentration = partner risk
- Portfolio balance stabilizes margins
Capital markets and rates
Expansion requires capital for kiosks, sensors and software; with the US federal funds rate near 5.25–5.50% in 2024–2025, higher hurdle rates and leasing costs increase project IRRs needed and raise OPEX for financed deployments.
Recurring subscription cash flow, which comprises the majority of Clear Secure’s revenue mix, helps self-fund rollouts and reduces near-term dilution; however, negative market sentiment toward biometrics can compress valuation and raise dilution risk on any future equity raises.
- Rate environment: Fed funds ~5.25–5.50%
- Capex needs: kiosks, sensors, software
- Funding: subscription-driven cash generation
- Risk: biometric sentiment → valuation/dilution
Biometric airport access grows with TSA alignment, security focus and stricter data laws
Passenger volumes (IATA 2024 ~4.4bn) and disposable income drive CLEAR subscriptions; recessions cut renewals. Inflation (US CPI 2024 ~3.4%) raises input costs while automation offsets labor. Fed funds ~5.25–5.50% (2024–25) lifts capex hurdles but subscription cash flow supports rollouts.
| Metric | Value |
|---|---|
| Global pax | ~4.4bn (2024) |
| US CPI | ~3.4% (2024) |
| Fed funds | 5.25–5.50% (2024–25) |
Preview the Actual Deliverable
Clear Secure PESTLE Analysis
The preview shown here is the exact Clear Secure PESTLE Analysis you’ll receive after purchase—fully formatted and ready to use. This file contains the complete political, economic, social, technological, legal, and environmental evaluation as presented. No placeholders or teasers—what you see is the final, downloadable document.
Original: $10.00
-65%$10.00
$3.50Description
Make Smarter Strategic Decisions with a Complete PESTEL View
Discover how political, economic, social, technological, legal, and environmental forces are shaping Clear Secure’s strategic outlook in our concise PESTLE brief. Use these insights to anticipate risks, spot opportunities, and sharpen your investment thesis. Purchase the full analysis for the complete, editable report and actionable recommendations.
Political factors
Aviation security policy alignment
National security priorities set stricter standards for identity screening and airport access, shaping Clear Secure’s product requirements. Alignment with TSA and analogous agencies enables lane access and program expansion, supporting Clear’s presence at over 50 airports and serving millions of travelers. Policy shifts that tighten identity or biometric rules raise compliance costs and create higher barriers to entry for competitors. Political backing for secure, seamless travel increases adoption and public funding opportunities.
Public–private partnerships
Access to checkpoints and venues for Clear often hinges on government and quasi-government contracts; US federal procurement exceeded 700 billion in FY2024, underscoring the scale of public-sector buying power. Stable partnerships can lock in long-term lanes and data-sharing frameworks, improving member throughput. Changes in administrations or procurement rules may alter renewal cadence, while transparent collaboration boosts legitimacy and scale.
Digital identity initiatives
Governments exploring digital IDs can either complement Clear Secure’s private identity platform or compete directly; as of 2024 more than 150 countries have national digital ID programs, creating mixed opportunities. Active participation in standards bodies positions Clear as an implementation partner and boosts bids for public contracts. Public endorsement by governments can rapidly increase consumer trust and enrollment, while fragmented national approaches complicate cross‑border rollout and scale economies.
Geopolitical travel volatility
Geopolitical tensions and health advisories drive sharp swings in passenger volumes and venue access, with IATA reporting global RPKs at about 97% of 2019 levels in 2024; lower travel demand directly depresses CLEAR subscription conversions and renewals, squeezing recurring revenue. Rapid rebounds—TSA recorded a 2.9 million passenger peak on July 3, 2023—strain operations and staffing at checkpoints, while political stability enables predictable throughput planning.
- IATA 2024 RPKs ~97% of 2019
- TSA peak 2.9M passengers (Jul 3, 2023)
- Subscription revenue tied to passenger throughput
- Political stability = predictable staffing/planning
Data sovereignty pressures
Policymakers increasingly demand local data storage and control, driven by regimes such as the EU GDPR and India’s Digital Personal Data Protection Act 2023, forcing Clear to consider regional infrastructure and independent audits to lawfully transfer biometric data. Divergent national rules raise operating complexity and uplift compliance costs, while proven local compliance facilitates market entry into highly regulated EU and APAC venues.
- Local storage & audits: regional data centers, third-party attestations
- Regulatory drivers: GDPR; India DPDP Act 2023
- Impact: higher OPEX/CapEx, increased contractual complexity
- Benefit: smoother entry into regulated airports/venues
Biometric airport access grows with TSA alignment, security focus and stricter data laws
National security priorities and TSA alignment shape CLEAR’s biometric requirements and lane access, supporting operations at over 50 airports and millions of members. US federal procurement topped 700B in FY2024, affecting contract scale; IATA reported 2024 RPKs ~97% of 2019, linking passenger throughput to subscription revenue. GDPR and India DPDP Act 2023 force local data controls, raising OPEX/CapEx and compliance audits.
| Metric | Value |
|---|---|
| US federal procurement FY2024 | $700B+ |
| IATA 2024 RPKs vs 2019 | ~97% |
| TSA peak (Jul 3, 2023) | 2.9M pax |
What is included in the product
Detailed Word Document
Explores how macro-environmental forces uniquely affect Clear Secure across Political, Economic, Social, Technological, Environmental, and Legal dimensions, with each category expanded into actionable sub-points and examples specific to the company and industry. Backed by current data and forward-looking insights, it’s designed for executives, investors, and strategists to identify threats, opportunities, and scenario-ready responses.
Customizable Excel Spreadsheet
A concise, visually segmented PESTLE summary for Clear Secure that distills external risks and opportunities into an easily shareable format, ideal for quick reference in meetings or slide decks. It lets teams align faster, add contextual notes, and support strategy discussions with clear, actionable insights.
Economic factors
Air travel demand cycles
Passenger volumes are the primary driver of CLEAR enrollments and usage; IATA reported 2024 global air passengers at about 4.4 billion, roughly 95–96% of 2019 levels. Economic expansions boost business travel and premium convenience spending, lifting renewals. Recessions pressure renewals and increase downgrade rates, squeezing recurring revenue. CLEAR's expansion into stadiums, sports venues and non-airport sites helps smooth this cyclicality.
Subscription pricing power
Recurring revenue for Clear hinges on subscription pricing, perceived value, and realized wait-time savings; consumers tolerate higher fees when time saved is clear. Clear’s footprint at 50+ airports and venues as of 2024 and high reliability raise willingness to pay. Co-branded bundles with card issuers (e.g., AmEx partnerships) can lift ARPU but often compress platform take rates. Elasticity testing—used in 2023–24—guides churn-safe price moves.
Inflation and operating costs
Hardware, staffing and site leases face clear inflationary pressure as US CPI averaged about 3.4% in 2024, pushing input costs for biometric kiosks and facility rents. Airport frontline wages rose roughly 5% YoY in 2024, increasing unit screening costs per passenger. Efficiency gains from automation can protect margins by lowering labor intensity. Long-term vendor contracts mute price volatility but constrain operational flexibility.
Partnership economics
Revenue-sharing with airports, airlines and card issuers materially shapes CLEARs unit economics; company disclosures show partnerships across over 60 airports and venues as of mid-2025. Co-marketing subsidies from partners reduce incremental acquisition cost per member. Concentration with a few large partners amplifies revenue volatility while a balanced partner mix stabilizes contribution margins.
- Revenue-share: key driver
- Co-marketing reduces CAC
- Concentration = partner risk
- Portfolio balance stabilizes margins
Capital markets and rates
Expansion requires capital for kiosks, sensors and software; with the US federal funds rate near 5.25–5.50% in 2024–2025, higher hurdle rates and leasing costs increase project IRRs needed and raise OPEX for financed deployments.
Recurring subscription cash flow, which comprises the majority of Clear Secure’s revenue mix, helps self-fund rollouts and reduces near-term dilution; however, negative market sentiment toward biometrics can compress valuation and raise dilution risk on any future equity raises.
- Rate environment: Fed funds ~5.25–5.50%
- Capex needs: kiosks, sensors, software
- Funding: subscription-driven cash generation
- Risk: biometric sentiment → valuation/dilution
Biometric airport access grows with TSA alignment, security focus and stricter data laws
Passenger volumes (IATA 2024 ~4.4bn) and disposable income drive CLEAR subscriptions; recessions cut renewals. Inflation (US CPI 2024 ~3.4%) raises input costs while automation offsets labor. Fed funds ~5.25–5.50% (2024–25) lifts capex hurdles but subscription cash flow supports rollouts.
| Metric | Value |
|---|---|
| Global pax | ~4.4bn (2024) |
| US CPI | ~3.4% (2024) |
| Fed funds | 5.25–5.50% (2024–25) |
Preview the Actual Deliverable
Clear Secure PESTLE Analysis
The preview shown here is the exact Clear Secure PESTLE Analysis you’ll receive after purchase—fully formatted and ready to use. This file contains the complete political, economic, social, technological, legal, and environmental evaluation as presented. No placeholders or teasers—what you see is the final, downloadable document.











