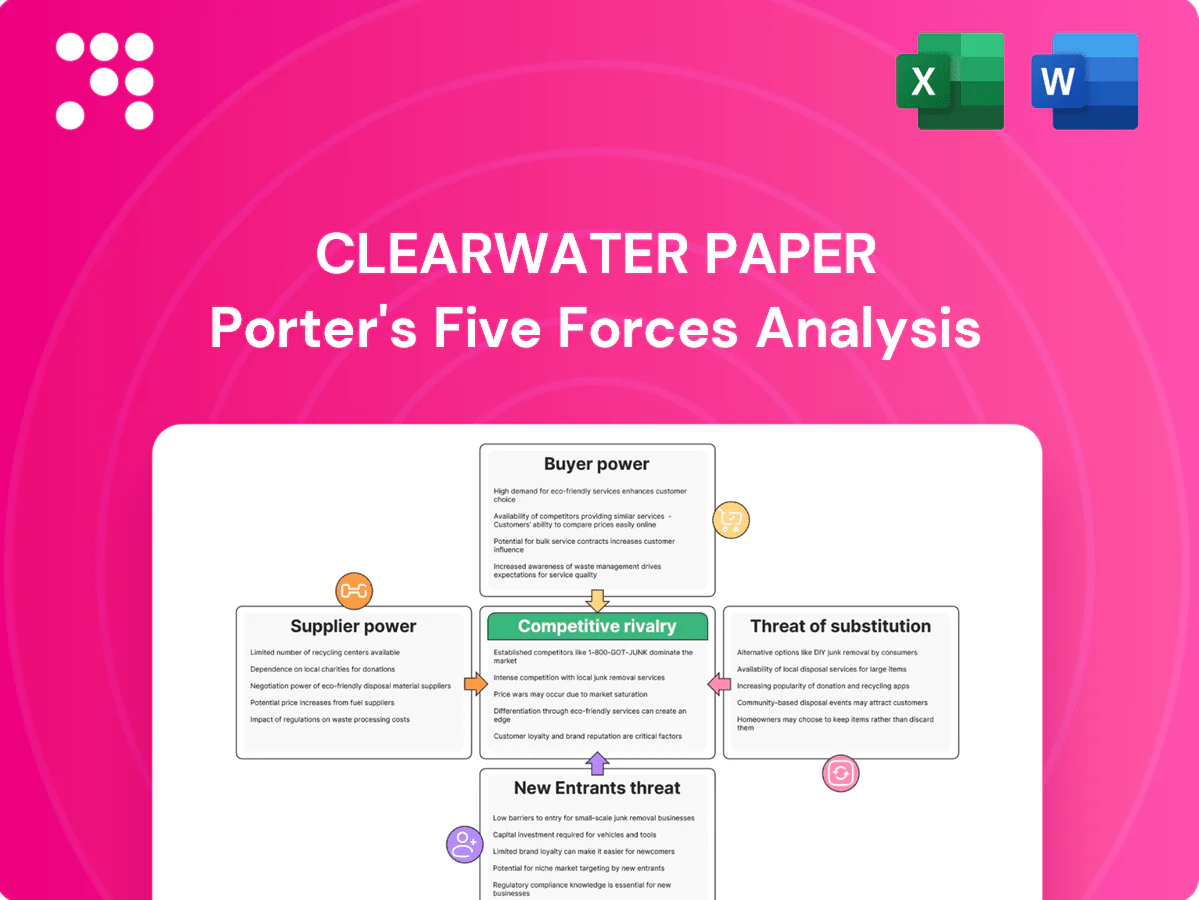
Clearwater Paper Porter's Five Forces Analysis

From Overview to Strategy Blueprint
Clearwater Paper faces concentrated supplier power for pulp and energy, cyclical buyer demand in tissue & specialty papers, and moderate threat from substitutes and new entrants given capital intensity; scale and cost control are key levers. This preview is just the beginning. The full analysis provides a complete strategic snapshot with force-by-force ratings, visuals, and business implications tailored to Clearwater Paper.
Suppliers Bargaining Power

Wood pulp and fiber control
Clearwater Paper relies on sustainably sourced virgin and recycled fiber, and in 2024 regional timber owners and pulp producers tightened supply during constrained harvest cycles, pushing spot pulp premiums and stumpage higher. Certification requirements (FSC/PEFC/SFI) — covering over 60% of North American timberlands in 2024 — narrow eligible sources and raise switching costs. Clearwater Paper's backward integration into pulp reduces exposure but does not eliminate market volatility.
Chemicals, adhesives, and specialty inputs
Tissue and paperboard production relies on chemicals such as caustic soda, starch, resins and bleaching agents, and in 2024 these inputs remained critical cost drivers for Clearwater Paper. The limited set of qualified suppliers and strict technical specs raise supplier leverage, enabling price transmission to producers. Commodity price spikes cascade into margin pressure, while multi-sourcing and long-term contracts are used to stabilize costs and preserve gross margins.

Energy and transportation dependencies
Production is energy intensive and freight heavy; in 2024 US paper producers saw fuel and freight push delivered costs higher, with transportation often contributing roughly 10–15% of unit delivered cost and energy volatility linked to gas markets and utility rates. Utility providers, gas and carriers therefore drive cost variability and service risk, while mill siting relative to fiber and end markets materially affects delivered cost. Hedging and modal flexibility partially offset supplier power.

Capital equipment and MRO OEMs
Capital equipment and MRO OEMs supply tissue machines, coaters and converting lines with proprietary parts and specialized service, creating pricing and timing leverage due to long lead times and limited alternative suppliers. Downtime amplifies supplier bargaining power as production interruption raises replacement and lost-margin costs. Preventive maintenance programs and strategic spare-part inventories materially reduce this exposure.
- Proprietary components = higher OEM pricing power
- Long lead times = timing leverage
- Downtime risk = increased asymmetry
- Preventive maintenance + inventory = lower supplier risk
Sustainability-certified supply constraints
Certified-fiber constraints and OEM inputs boost supplier power, pushing input costs higher
Clearwater Paper faces elevated supplier power in 2024 as certified fiber constraints (FSC/PEFC/SFI >60% of N. American timberlands) and spot pulp tightness raise input cost exposure. Chemicals and proprietary OEM parts limit alternatives and create timing leverage; transportation and energy drive ~10–15% of delivered unit cost. Backward integration, multi‑sourcing and long‑term contracts partially mitigate risk.
| Metric | 2024 |
|---|---|
| Certified timber coverage | >60% |
| Transport & energy share of delivered cost | 10–15% |
What is included in the product
 Detailed Word Document
Tailored Porter’s Five Forces analysis for Clearwater Paper that uncovers competitive drivers, supplier and buyer power, threat of substitutes and entrants, and identifies disruptive risks and strategic levers affecting its pricing, margins and market positioning.

 Customizable Excel Spreadsheet
A concise one-sheet Porter’s Five Forces for Clearwater Paper—instantly visualize supplier, buyer, rivalry, substitutes and entry pressures with a radar chart, customizable inputs, no macros, and a clean layout ready for decks or integration into reports.
Customers Bargaining Power

Concentrated big-box and club retailers
Major big-box and club retailers aggregate volumes and press Clearwater Paper on price and service, with top retail chains controlling purchasing power and driving private-label benchmarks against national brands. Slotting fees, promotional funding and service-level penalties compress margins and raise switching risk as a few customers dominate orders. In fiscal 2024 Clearwater Paper reported roughly $1.4 billion in net sales, amplifying customer concentration exposure. Retailer negotiation leverage materially limits pricing flexibility.
Private label specification power
Retailers dictate fiber mix, softness, strength and packaging sustainability for private-label tissue, forcing Clearwater Paper to meet custom specs that raise switching costs while giving buyers leverage on price; US private-label penetration in grocery categories topped 20% in 2024, intensifying buyer power. Performance parity with national brands is required to win shelf space, so strict cost-to-serve discipline is crucial to protect margins.

Away-from-home distributors and aggregators
AFH channels bundle tissue with jan/san supplies through large distributors (top national players account for ~40% of AFH spend), with bid cycles typically 12–36 months driving price visibility and churn; end-users’ focus on delivered cost keeps pricing compressed, while reliable service and logistics can command a 5–10% premium, partially offsetting margin pressure.

Paperboard converters and CPG brands
Folding carton and CPG buyers can dual-source across mills, but quality, caliper and printability constraints keep switching costs meaningful; in 2024 buyers pressed for pulp-cost pass-throughs amid commodity volatility, even under long-term contracts. Value-added coatings and sustainability claims (recyclable/PCR) increased supplier stickiness and reduced churn.
- Dual-sourcing common
- Quality limits alternatives
- 2024: pulp pass-throughs enforced
- Coatings/sustainability boost retention
ESG and transparency expectations
Customers now demand chain-of-custody certification, recyclability proof and emissions disclosure; failure can lead to delisting or price concessions, while verified sustainability helps win bids but triggers rigorous audits. The 2024 rollout of the EU CSRD (affecting ~50,000 companies) and growing procurement ESG clauses shift bargaining power toward buyers and increase data-sharing requirements.
- Chain-of-custody required
- Recyclability & emissions disclosure
- Non-compliance = delisting/price cuts
- Verified ESG wins bids but invites audits
- 2024 CSRD ≈50,000 firms; buyer leverage up
Retailer concentration and private-label >20% pressure margins
Major retailers and clubs exert strong price/service leverage; Clearwater Paper reported ~$1.4B net sales in FY2024, concentrating customer risk. US private-label tissue penetration exceeded 20% in 2024 and AFH distributors account for ~40% of AFH spend, compressing pricing. 2024 pulp-cost pass-throughs were enforced and EU CSRD rollout (~50,000 firms) increased buyer ESG leverage.
| Metric | 2024 | Impact |
|---|---|---|
| Net sales | $1.4B | Customer concentration |
| Private-label | >20% | Pricing pressure |
| AFH distributor share | ~40% | Bid-driven pricing |
| CSRD reach | ~50,000 firms | ESG leverage |
Preview the Actual Deliverable
Clearwater Paper Porter's Five Forces Analysis
This Clearwater Paper Porter’s Five Forces Analysis is the exact, fully formatted document you’re previewing now and the same file you’ll receive instantly after purchase. It contains the complete competitive assessment, ready for download and immediate use. No placeholders, no mockups—just the final deliverable.

From Overview to Strategy Blueprint
Clearwater Paper faces concentrated supplier power for pulp and energy, cyclical buyer demand in tissue & specialty papers, and moderate threat from substitutes and new entrants given capital intensity; scale and cost control are key levers. This preview is just the beginning. The full analysis provides a complete strategic snapshot with force-by-force ratings, visuals, and business implications tailored to Clearwater Paper.
Suppliers Bargaining Power
Wood pulp and fiber control
Clearwater Paper relies on sustainably sourced virgin and recycled fiber, and in 2024 regional timber owners and pulp producers tightened supply during constrained harvest cycles, pushing spot pulp premiums and stumpage higher. Certification requirements (FSC/PEFC/SFI) — covering over 60% of North American timberlands in 2024 — narrow eligible sources and raise switching costs. Clearwater Paper's backward integration into pulp reduces exposure but does not eliminate market volatility.
Chemicals, adhesives, and specialty inputs
Tissue and paperboard production relies on chemicals such as caustic soda, starch, resins and bleaching agents, and in 2024 these inputs remained critical cost drivers for Clearwater Paper. The limited set of qualified suppliers and strict technical specs raise supplier leverage, enabling price transmission to producers. Commodity price spikes cascade into margin pressure, while multi-sourcing and long-term contracts are used to stabilize costs and preserve gross margins.
Energy and transportation dependencies
Production is energy intensive and freight heavy; in 2024 US paper producers saw fuel and freight push delivered costs higher, with transportation often contributing roughly 10–15% of unit delivered cost and energy volatility linked to gas markets and utility rates. Utility providers, gas and carriers therefore drive cost variability and service risk, while mill siting relative to fiber and end markets materially affects delivered cost. Hedging and modal flexibility partially offset supplier power.
Capital equipment and MRO OEMs
Capital equipment and MRO OEMs supply tissue machines, coaters and converting lines with proprietary parts and specialized service, creating pricing and timing leverage due to long lead times and limited alternative suppliers. Downtime amplifies supplier bargaining power as production interruption raises replacement and lost-margin costs. Preventive maintenance programs and strategic spare-part inventories materially reduce this exposure.
- Proprietary components = higher OEM pricing power
- Long lead times = timing leverage
- Downtime risk = increased asymmetry
- Preventive maintenance + inventory = lower supplier risk
Sustainability-certified supply constraints
Certified-fiber constraints and OEM inputs boost supplier power, pushing input costs higher
Clearwater Paper faces elevated supplier power in 2024 as certified fiber constraints (FSC/PEFC/SFI >60% of N. American timberlands) and spot pulp tightness raise input cost exposure. Chemicals and proprietary OEM parts limit alternatives and create timing leverage; transportation and energy drive ~10–15% of delivered unit cost. Backward integration, multi‑sourcing and long‑term contracts partially mitigate risk.
| Metric | 2024 |
|---|---|
| Certified timber coverage | >60% |
| Transport & energy share of delivered cost | 10–15% |
What is included in the product
Detailed Word Document
Tailored Porter’s Five Forces analysis for Clearwater Paper that uncovers competitive drivers, supplier and buyer power, threat of substitutes and entrants, and identifies disruptive risks and strategic levers affecting its pricing, margins and market positioning.
Customizable Excel Spreadsheet
A concise one-sheet Porter’s Five Forces for Clearwater Paper—instantly visualize supplier, buyer, rivalry, substitutes and entry pressures with a radar chart, customizable inputs, no macros, and a clean layout ready for decks or integration into reports.
Customers Bargaining Power
Concentrated big-box and club retailers
Major big-box and club retailers aggregate volumes and press Clearwater Paper on price and service, with top retail chains controlling purchasing power and driving private-label benchmarks against national brands. Slotting fees, promotional funding and service-level penalties compress margins and raise switching risk as a few customers dominate orders. In fiscal 2024 Clearwater Paper reported roughly $1.4 billion in net sales, amplifying customer concentration exposure. Retailer negotiation leverage materially limits pricing flexibility.
Private label specification power
Retailers dictate fiber mix, softness, strength and packaging sustainability for private-label tissue, forcing Clearwater Paper to meet custom specs that raise switching costs while giving buyers leverage on price; US private-label penetration in grocery categories topped 20% in 2024, intensifying buyer power. Performance parity with national brands is required to win shelf space, so strict cost-to-serve discipline is crucial to protect margins.
Away-from-home distributors and aggregators
AFH channels bundle tissue with jan/san supplies through large distributors (top national players account for ~40% of AFH spend), with bid cycles typically 12–36 months driving price visibility and churn; end-users’ focus on delivered cost keeps pricing compressed, while reliable service and logistics can command a 5–10% premium, partially offsetting margin pressure.
Paperboard converters and CPG brands
Folding carton and CPG buyers can dual-source across mills, but quality, caliper and printability constraints keep switching costs meaningful; in 2024 buyers pressed for pulp-cost pass-throughs amid commodity volatility, even under long-term contracts. Value-added coatings and sustainability claims (recyclable/PCR) increased supplier stickiness and reduced churn.
- Dual-sourcing common
- Quality limits alternatives
- 2024: pulp pass-throughs enforced
- Coatings/sustainability boost retention
ESG and transparency expectations
Customers now demand chain-of-custody certification, recyclability proof and emissions disclosure; failure can lead to delisting or price concessions, while verified sustainability helps win bids but triggers rigorous audits. The 2024 rollout of the EU CSRD (affecting ~50,000 companies) and growing procurement ESG clauses shift bargaining power toward buyers and increase data-sharing requirements.
- Chain-of-custody required
- Recyclability & emissions disclosure
- Non-compliance = delisting/price cuts
- Verified ESG wins bids but invites audits
- 2024 CSRD ≈50,000 firms; buyer leverage up
Retailer concentration and private-label >20% pressure margins
Major retailers and clubs exert strong price/service leverage; Clearwater Paper reported ~$1.4B net sales in FY2024, concentrating customer risk. US private-label tissue penetration exceeded 20% in 2024 and AFH distributors account for ~40% of AFH spend, compressing pricing. 2024 pulp-cost pass-throughs were enforced and EU CSRD rollout (~50,000 firms) increased buyer ESG leverage.
| Metric | 2024 | Impact |
|---|---|---|
| Net sales | $1.4B | Customer concentration |
| Private-label | >20% | Pricing pressure |
| AFH distributor share | ~40% | Bid-driven pricing |
| CSRD reach | ~50,000 firms | ESG leverage |
Preview the Actual Deliverable
Clearwater Paper Porter's Five Forces Analysis
This Clearwater Paper Porter’s Five Forces Analysis is the exact, fully formatted document you’re previewing now and the same file you’ll receive instantly after purchase. It contains the complete competitive assessment, ready for download and immediate use. No placeholders, no mockups—just the final deliverable.
Original: $10.00
-65%$10.00
$3.50Description
From Overview to Strategy Blueprint
Clearwater Paper faces concentrated supplier power for pulp and energy, cyclical buyer demand in tissue & specialty papers, and moderate threat from substitutes and new entrants given capital intensity; scale and cost control are key levers. This preview is just the beginning. The full analysis provides a complete strategic snapshot with force-by-force ratings, visuals, and business implications tailored to Clearwater Paper.
Suppliers Bargaining Power
Wood pulp and fiber control
Clearwater Paper relies on sustainably sourced virgin and recycled fiber, and in 2024 regional timber owners and pulp producers tightened supply during constrained harvest cycles, pushing spot pulp premiums and stumpage higher. Certification requirements (FSC/PEFC/SFI) — covering over 60% of North American timberlands in 2024 — narrow eligible sources and raise switching costs. Clearwater Paper's backward integration into pulp reduces exposure but does not eliminate market volatility.
Chemicals, adhesives, and specialty inputs
Tissue and paperboard production relies on chemicals such as caustic soda, starch, resins and bleaching agents, and in 2024 these inputs remained critical cost drivers for Clearwater Paper. The limited set of qualified suppliers and strict technical specs raise supplier leverage, enabling price transmission to producers. Commodity price spikes cascade into margin pressure, while multi-sourcing and long-term contracts are used to stabilize costs and preserve gross margins.
Energy and transportation dependencies
Production is energy intensive and freight heavy; in 2024 US paper producers saw fuel and freight push delivered costs higher, with transportation often contributing roughly 10–15% of unit delivered cost and energy volatility linked to gas markets and utility rates. Utility providers, gas and carriers therefore drive cost variability and service risk, while mill siting relative to fiber and end markets materially affects delivered cost. Hedging and modal flexibility partially offset supplier power.
Capital equipment and MRO OEMs
Capital equipment and MRO OEMs supply tissue machines, coaters and converting lines with proprietary parts and specialized service, creating pricing and timing leverage due to long lead times and limited alternative suppliers. Downtime amplifies supplier bargaining power as production interruption raises replacement and lost-margin costs. Preventive maintenance programs and strategic spare-part inventories materially reduce this exposure.
- Proprietary components = higher OEM pricing power
- Long lead times = timing leverage
- Downtime risk = increased asymmetry
- Preventive maintenance + inventory = lower supplier risk
Sustainability-certified supply constraints
Certified-fiber constraints and OEM inputs boost supplier power, pushing input costs higher
Clearwater Paper faces elevated supplier power in 2024 as certified fiber constraints (FSC/PEFC/SFI >60% of N. American timberlands) and spot pulp tightness raise input cost exposure. Chemicals and proprietary OEM parts limit alternatives and create timing leverage; transportation and energy drive ~10–15% of delivered unit cost. Backward integration, multi‑sourcing and long‑term contracts partially mitigate risk.
| Metric | 2024 |
|---|---|
| Certified timber coverage | >60% |
| Transport & energy share of delivered cost | 10–15% |
What is included in the product
Detailed Word Document
Tailored Porter’s Five Forces analysis for Clearwater Paper that uncovers competitive drivers, supplier and buyer power, threat of substitutes and entrants, and identifies disruptive risks and strategic levers affecting its pricing, margins and market positioning.
Customizable Excel Spreadsheet
A concise one-sheet Porter’s Five Forces for Clearwater Paper—instantly visualize supplier, buyer, rivalry, substitutes and entry pressures with a radar chart, customizable inputs, no macros, and a clean layout ready for decks or integration into reports.
Customers Bargaining Power
Concentrated big-box and club retailers
Major big-box and club retailers aggregate volumes and press Clearwater Paper on price and service, with top retail chains controlling purchasing power and driving private-label benchmarks against national brands. Slotting fees, promotional funding and service-level penalties compress margins and raise switching risk as a few customers dominate orders. In fiscal 2024 Clearwater Paper reported roughly $1.4 billion in net sales, amplifying customer concentration exposure. Retailer negotiation leverage materially limits pricing flexibility.
Private label specification power
Retailers dictate fiber mix, softness, strength and packaging sustainability for private-label tissue, forcing Clearwater Paper to meet custom specs that raise switching costs while giving buyers leverage on price; US private-label penetration in grocery categories topped 20% in 2024, intensifying buyer power. Performance parity with national brands is required to win shelf space, so strict cost-to-serve discipline is crucial to protect margins.
Away-from-home distributors and aggregators
AFH channels bundle tissue with jan/san supplies through large distributors (top national players account for ~40% of AFH spend), with bid cycles typically 12–36 months driving price visibility and churn; end-users’ focus on delivered cost keeps pricing compressed, while reliable service and logistics can command a 5–10% premium, partially offsetting margin pressure.
Paperboard converters and CPG brands
Folding carton and CPG buyers can dual-source across mills, but quality, caliper and printability constraints keep switching costs meaningful; in 2024 buyers pressed for pulp-cost pass-throughs amid commodity volatility, even under long-term contracts. Value-added coatings and sustainability claims (recyclable/PCR) increased supplier stickiness and reduced churn.
- Dual-sourcing common
- Quality limits alternatives
- 2024: pulp pass-throughs enforced
- Coatings/sustainability boost retention
ESG and transparency expectations
Customers now demand chain-of-custody certification, recyclability proof and emissions disclosure; failure can lead to delisting or price concessions, while verified sustainability helps win bids but triggers rigorous audits. The 2024 rollout of the EU CSRD (affecting ~50,000 companies) and growing procurement ESG clauses shift bargaining power toward buyers and increase data-sharing requirements.
- Chain-of-custody required
- Recyclability & emissions disclosure
- Non-compliance = delisting/price cuts
- Verified ESG wins bids but invites audits
- 2024 CSRD ≈50,000 firms; buyer leverage up
Retailer concentration and private-label >20% pressure margins
Major retailers and clubs exert strong price/service leverage; Clearwater Paper reported ~$1.4B net sales in FY2024, concentrating customer risk. US private-label tissue penetration exceeded 20% in 2024 and AFH distributors account for ~40% of AFH spend, compressing pricing. 2024 pulp-cost pass-throughs were enforced and EU CSRD rollout (~50,000 firms) increased buyer ESG leverage.
| Metric | 2024 | Impact |
|---|---|---|
| Net sales | $1.4B | Customer concentration |
| Private-label | >20% | Pricing pressure |
| AFH distributor share | ~40% | Bid-driven pricing |
| CSRD reach | ~50,000 firms | ESG leverage |
Preview the Actual Deliverable
Clearwater Paper Porter's Five Forces Analysis
This Clearwater Paper Porter’s Five Forces Analysis is the exact, fully formatted document you’re previewing now and the same file you’ll receive instantly after purchase. It contains the complete competitive assessment, ready for download and immediate use. No placeholders, no mockups—just the final deliverable.











