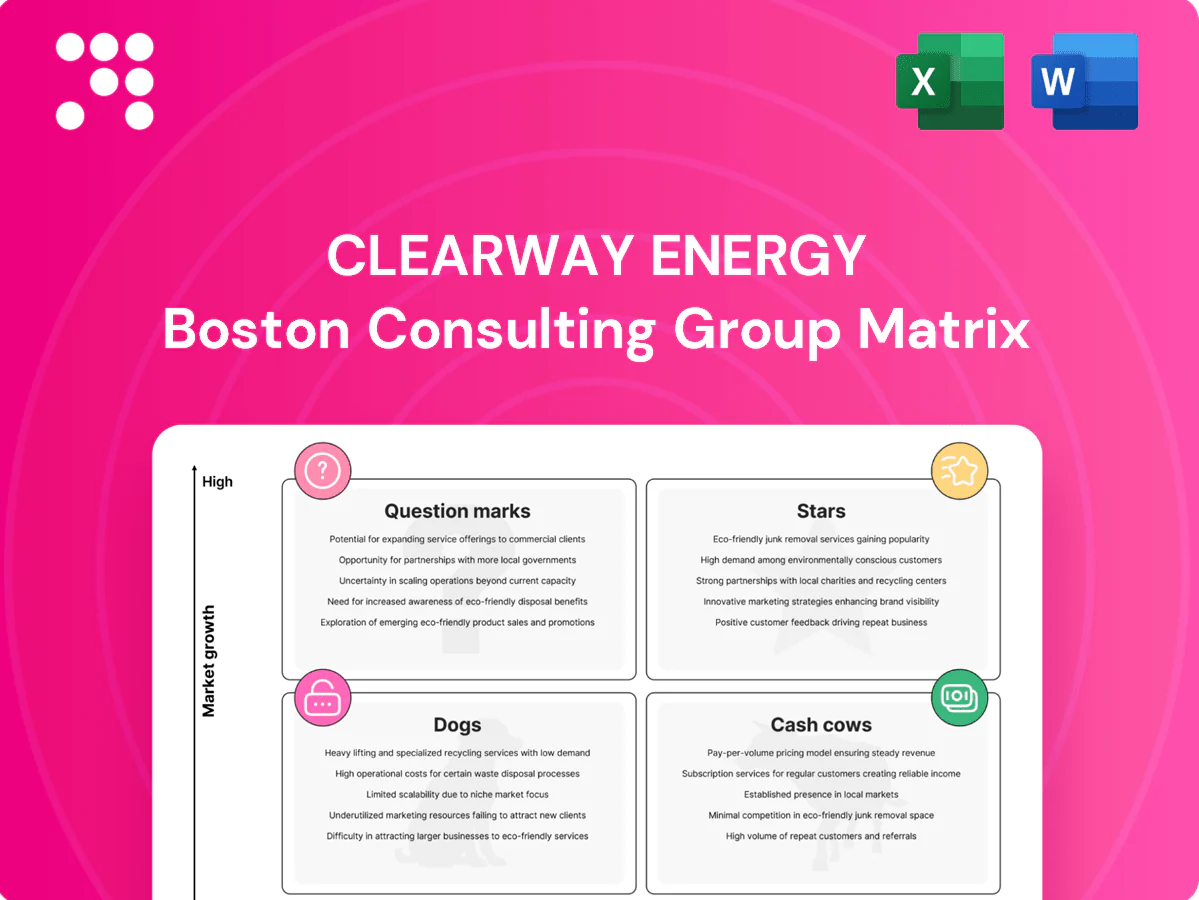
Clearway Energy Boston Consulting Group Matrix

Download Your Competitive Advantage
Curious where Clearway Energy’s assets sit—Stars, Cash Cows, Dogs, or Question Marks? This snapshot teases the story; buy the full BCG Matrix to get quadrant-by-quadrant placements, data-backed recommendations, and a practical roadmap for capital allocation and portfolio moves. Grab the complete Word report plus an Excel summary and skip the guesswork—actionable clarity for your next strategic decision.
Stars

Utility-scale solar PPAs in growth states
Clearway’s large utility-scale solar fleets across Sunbelt states—with over 4 GW of operating renewables—are benefitting from strong demand and grid reliability needs; long-dated PPAs, typically 15–25 years, lock predictable cashflows while valuable interconnection positions create real leverage amid a US interconnection queue that exceeded 1,000 GW in 2023. Leadership in this fast-growing lane still requires cash for buildouts, but continued capital support should let these assets mature into major earnings drivers.
Wind repowering in prime corridors
Wind repowering in prime corridors delivers 30–50% higher output and multi-decade life extension at aging high-wind sites, converting them to top-quartile assets. IRA tax incentives (PTC/ITC enhancements) plus Clearway’s known site inventory and ~6.9 GW fleet compress time-to-value and enable scale. Market growth in repowering-rich regions means Clearway holds meaningful share where it counts—invest now, harvest later.

Corporate PPA franchise with blue-chip buyers
Enterprise demand for clean power surged in 2024, with corporate PPA volumes rising roughly 30% year-over-year, and Clearway leverages that with bankable delivery across ~7.2 GW of operating capacity. Contracting depth and repeat blue-chip buyers create a leadership loop, underpinning visibility into revenue streams and long-duration cash flows. Growth is hot and capital-intensive, but payback is visible via contracted cash yields and pipeline scale. This is a scale game and Clearway sits in the lead pack.

Co-located solar + storage buildouts
Co-located solar+storage raise capacity value and firm up peak-hour deliveries, turning intermittent output into dispatchable MWs; interconnection reuse and shared O&M cut build costs and timelines as markets accelerate. Clearway’s ~6.0 GW renewables scale (2024) lets it set terms and timelines; projects remain cash-hungry today but show clear star potential tomorrow.
- Hybrid capacity value: higher peak deliverability
- Cost edge: reuse interconnection + shared O&M
- Scale: Clearway ~6.0 GW (2024)
- Financial: near-term cash needs, long-term upside
Community solar platforms in expanding states
Subscriber models are scaling fast in supportive states, with industry reports citing roughly 25% annual subscriber growth in 2023–24; Clearway can aggregate demand, manage churn, and convert waitlists faster than smaller players. Growth is brisk and cash cycles are heavy during ramp, but land this right and it graduates into a dependable earner.
- Scale advantage: faster aggregation and lower CAC
- Churn mgmt: portfolio-level retention reduces volatility
- Cash impact: heavy upfront capex and negative operating cash during ramp
- Exit potential: predictable cashflows once fully subscribed
6.0 GW renewables, >1,000 GW queue — repowering & storage raise output 30–50%
Clearway’s ~6.0 GW renewables (2024) and long-dated PPAs deliver predictable cashflows amid a US interconnection queue >1,000 GW (2023). Wind repowering and solar+storage hybrids raise output 30–50% and firm peak deliverability. Corporate PPAs rose ~30% YoY (2024), while subscriber growth ~25% (2023–24) fuels scale but demands upfront capex.
| Metric | Value |
|---|---|
| Operating renewables | ~6.0 GW (2024) |
| Interconnection queue | >1,000 GW (2023) |
| Corp PPA growth | ~30% YoY (2024) |
| Subscriber growth | ~25% (2023–24) |
What is included in the product
 Detailed Word Document
In-depth BCG Matrix review of Clearway Energy’s units with clear recommendations on Stars, Cash Cows, Question Marks, Dogs.

 Customizable Excel Spreadsheet
One-page BCG matrix for Clearway Energy—clarifies units, eases portfolio decisions and exports cleanly for presentations.
Cash Cows

Legacy contracted wind fleets
Legacy contracted wind fleets at Clearway Energy in 2024 deliver steady, predictable cash under long-term PPAs, with mature operations and optimized O&M that minimize variability. Growth is limited and operational drama is low, so these assets function as cash cows funding corporate needs. Financing is largely de-risked, allowing management to milk margins and redeploy proceeds upstream into growth projects and batteries.
Utility-scale solar under seasoned contracts
Older utility-scale solar under seasoned contracts deliver predictable output and low unit costs — industry LCOE for utility PV fell to roughly $35–45/MWh in 2024, tightening margins. Curtailment risk is quantified and hedged in Clearway’s PPAs, preserving cash flow. Net operating cash inflows typically exceed reinvestment needs; use surplus to fund the next wave of capacity additions.

Thermal district energy with take-or-pay
Thermal district energy with take-or-pay contracts serves institutions in mature grids, with contracts typically 10–25 years and high stickiness; EU district heating penetration was about 12% in 2024. Predictable cash flow and manageable capex cadence allow steady distributions, while efficiency retrofits (fuel-use gains commonly 5–15%) lift EBITDA without large bets. Classic Cow: keep it tight, keep it paying.

Conventional contracted generation
Where Clearway holds contracted conventional units, the cash profile is steady. Low growth, but grid-reliability premiums and capacity payments supported margins in 2024. Minimal promo spend; operations prioritize reliability and uptime—maintain and harvest.
- 2024 contracted conventional capacity ~7 GW
- Revenue stability driven by capacity payments and reliability premiums
- Strategy: maintain uptime, harvest cash
Asset-level O&M and origination know-how
Clearway’s asset-level O&M and origination know-how leverages a roughly 6.2 GW fleet (2024), driving lower per-MW operating costs across assets and lifting portfolio margins without needing headline growth.
The institutionalized know-how behaves like an annuity, generating predictable cashflow that quietly funds higher‑risk development and M&A plays.
- scale: 6.2 GW (2024)
- advantage: annuity-like O&M margins
- strategy: funds growth without headline spend
Annuity cash from legacy wind & low-LCOE utility PV in 2024
Legacy wind and seasoned utility PV deliver annuity-like cash in 2024, with Clearway’s 6.2 GW fleet and ~7 GW contracted conventional capacity underpinning stable margins; utility PV LCOE ~35–45/MWh (2024). District heating and contracted thermal add predictable take-or-pay cash; surplus funds development and batteries.
| Asset | 2024 GW | Cash trait | Contract |
|---|---|---|---|
| Wind | ≈3.0 | High predictability | Long-term PPA |
| Solar | ≈2.5 | Low LCOE | Seasoned PPA |
| Thermal | ≈0.7 | Take-or-pay | 10–25 yr |
| Conventional | ~7.0 | Capacity payments | Contracted |
Full Transparency, Always
Clearway Energy BCG Matrix
The Clearway Energy BCG Matrix you're previewing is the exact file you'll receive after purchase. No watermarks, no placeholders—just the finished, presentation-ready matrix built for strategic clarity. After buying, the full document is instantly downloadable and editable for your team or investors. It's the same professional analysis, formatted and ready to use.

Download Your Competitive Advantage
Curious where Clearway Energy’s assets sit—Stars, Cash Cows, Dogs, or Question Marks? This snapshot teases the story; buy the full BCG Matrix to get quadrant-by-quadrant placements, data-backed recommendations, and a practical roadmap for capital allocation and portfolio moves. Grab the complete Word report plus an Excel summary and skip the guesswork—actionable clarity for your next strategic decision.
Stars
Utility-scale solar PPAs in growth states
Clearway’s large utility-scale solar fleets across Sunbelt states—with over 4 GW of operating renewables—are benefitting from strong demand and grid reliability needs; long-dated PPAs, typically 15–25 years, lock predictable cashflows while valuable interconnection positions create real leverage amid a US interconnection queue that exceeded 1,000 GW in 2023. Leadership in this fast-growing lane still requires cash for buildouts, but continued capital support should let these assets mature into major earnings drivers.
Wind repowering in prime corridors
Wind repowering in prime corridors delivers 30–50% higher output and multi-decade life extension at aging high-wind sites, converting them to top-quartile assets. IRA tax incentives (PTC/ITC enhancements) plus Clearway’s known site inventory and ~6.9 GW fleet compress time-to-value and enable scale. Market growth in repowering-rich regions means Clearway holds meaningful share where it counts—invest now, harvest later.
Corporate PPA franchise with blue-chip buyers
Enterprise demand for clean power surged in 2024, with corporate PPA volumes rising roughly 30% year-over-year, and Clearway leverages that with bankable delivery across ~7.2 GW of operating capacity. Contracting depth and repeat blue-chip buyers create a leadership loop, underpinning visibility into revenue streams and long-duration cash flows. Growth is hot and capital-intensive, but payback is visible via contracted cash yields and pipeline scale. This is a scale game and Clearway sits in the lead pack.
Co-located solar + storage buildouts
Co-located solar+storage raise capacity value and firm up peak-hour deliveries, turning intermittent output into dispatchable MWs; interconnection reuse and shared O&M cut build costs and timelines as markets accelerate. Clearway’s ~6.0 GW renewables scale (2024) lets it set terms and timelines; projects remain cash-hungry today but show clear star potential tomorrow.
- Hybrid capacity value: higher peak deliverability
- Cost edge: reuse interconnection + shared O&M
- Scale: Clearway ~6.0 GW (2024)
- Financial: near-term cash needs, long-term upside
Community solar platforms in expanding states
Subscriber models are scaling fast in supportive states, with industry reports citing roughly 25% annual subscriber growth in 2023–24; Clearway can aggregate demand, manage churn, and convert waitlists faster than smaller players. Growth is brisk and cash cycles are heavy during ramp, but land this right and it graduates into a dependable earner.
- Scale advantage: faster aggregation and lower CAC
- Churn mgmt: portfolio-level retention reduces volatility
- Cash impact: heavy upfront capex and negative operating cash during ramp
- Exit potential: predictable cashflows once fully subscribed
6.0 GW renewables, >1,000 GW queue — repowering & storage raise output 30–50%
Clearway’s ~6.0 GW renewables (2024) and long-dated PPAs deliver predictable cashflows amid a US interconnection queue >1,000 GW (2023). Wind repowering and solar+storage hybrids raise output 30–50% and firm peak deliverability. Corporate PPAs rose ~30% YoY (2024), while subscriber growth ~25% (2023–24) fuels scale but demands upfront capex.
| Metric | Value |
|---|---|
| Operating renewables | ~6.0 GW (2024) |
| Interconnection queue | >1,000 GW (2023) |
| Corp PPA growth | ~30% YoY (2024) |
| Subscriber growth | ~25% (2023–24) |
What is included in the product
Detailed Word Document
In-depth BCG Matrix review of Clearway Energy’s units with clear recommendations on Stars, Cash Cows, Question Marks, Dogs.
Customizable Excel Spreadsheet
One-page BCG matrix for Clearway Energy—clarifies units, eases portfolio decisions and exports cleanly for presentations.
Cash Cows
Legacy contracted wind fleets
Legacy contracted wind fleets at Clearway Energy in 2024 deliver steady, predictable cash under long-term PPAs, with mature operations and optimized O&M that minimize variability. Growth is limited and operational drama is low, so these assets function as cash cows funding corporate needs. Financing is largely de-risked, allowing management to milk margins and redeploy proceeds upstream into growth projects and batteries.
Utility-scale solar under seasoned contracts
Older utility-scale solar under seasoned contracts deliver predictable output and low unit costs — industry LCOE for utility PV fell to roughly $35–45/MWh in 2024, tightening margins. Curtailment risk is quantified and hedged in Clearway’s PPAs, preserving cash flow. Net operating cash inflows typically exceed reinvestment needs; use surplus to fund the next wave of capacity additions.
Thermal district energy with take-or-pay
Thermal district energy with take-or-pay contracts serves institutions in mature grids, with contracts typically 10–25 years and high stickiness; EU district heating penetration was about 12% in 2024. Predictable cash flow and manageable capex cadence allow steady distributions, while efficiency retrofits (fuel-use gains commonly 5–15%) lift EBITDA without large bets. Classic Cow: keep it tight, keep it paying.
Conventional contracted generation
Where Clearway holds contracted conventional units, the cash profile is steady. Low growth, but grid-reliability premiums and capacity payments supported margins in 2024. Minimal promo spend; operations prioritize reliability and uptime—maintain and harvest.
- 2024 contracted conventional capacity ~7 GW
- Revenue stability driven by capacity payments and reliability premiums
- Strategy: maintain uptime, harvest cash
Asset-level O&M and origination know-how
Clearway’s asset-level O&M and origination know-how leverages a roughly 6.2 GW fleet (2024), driving lower per-MW operating costs across assets and lifting portfolio margins without needing headline growth.
The institutionalized know-how behaves like an annuity, generating predictable cashflow that quietly funds higher‑risk development and M&A plays.
- scale: 6.2 GW (2024)
- advantage: annuity-like O&M margins
- strategy: funds growth without headline spend
Annuity cash from legacy wind & low-LCOE utility PV in 2024
Legacy wind and seasoned utility PV deliver annuity-like cash in 2024, with Clearway’s 6.2 GW fleet and ~7 GW contracted conventional capacity underpinning stable margins; utility PV LCOE ~35–45/MWh (2024). District heating and contracted thermal add predictable take-or-pay cash; surplus funds development and batteries.
| Asset | 2024 GW | Cash trait | Contract |
|---|---|---|---|
| Wind | ≈3.0 | High predictability | Long-term PPA |
| Solar | ≈2.5 | Low LCOE | Seasoned PPA |
| Thermal | ≈0.7 | Take-or-pay | 10–25 yr |
| Conventional | ~7.0 | Capacity payments | Contracted |
Full Transparency, Always
Clearway Energy BCG Matrix
The Clearway Energy BCG Matrix you're previewing is the exact file you'll receive after purchase. No watermarks, no placeholders—just the finished, presentation-ready matrix built for strategic clarity. After buying, the full document is instantly downloadable and editable for your team or investors. It's the same professional analysis, formatted and ready to use.
Description
Download Your Competitive Advantage
Curious where Clearway Energy’s assets sit—Stars, Cash Cows, Dogs, or Question Marks? This snapshot teases the story; buy the full BCG Matrix to get quadrant-by-quadrant placements, data-backed recommendations, and a practical roadmap for capital allocation and portfolio moves. Grab the complete Word report plus an Excel summary and skip the guesswork—actionable clarity for your next strategic decision.
Stars
Utility-scale solar PPAs in growth states
Clearway’s large utility-scale solar fleets across Sunbelt states—with over 4 GW of operating renewables—are benefitting from strong demand and grid reliability needs; long-dated PPAs, typically 15–25 years, lock predictable cashflows while valuable interconnection positions create real leverage amid a US interconnection queue that exceeded 1,000 GW in 2023. Leadership in this fast-growing lane still requires cash for buildouts, but continued capital support should let these assets mature into major earnings drivers.
Wind repowering in prime corridors
Wind repowering in prime corridors delivers 30–50% higher output and multi-decade life extension at aging high-wind sites, converting them to top-quartile assets. IRA tax incentives (PTC/ITC enhancements) plus Clearway’s known site inventory and ~6.9 GW fleet compress time-to-value and enable scale. Market growth in repowering-rich regions means Clearway holds meaningful share where it counts—invest now, harvest later.
Corporate PPA franchise with blue-chip buyers
Enterprise demand for clean power surged in 2024, with corporate PPA volumes rising roughly 30% year-over-year, and Clearway leverages that with bankable delivery across ~7.2 GW of operating capacity. Contracting depth and repeat blue-chip buyers create a leadership loop, underpinning visibility into revenue streams and long-duration cash flows. Growth is hot and capital-intensive, but payback is visible via contracted cash yields and pipeline scale. This is a scale game and Clearway sits in the lead pack.
Co-located solar + storage buildouts
Co-located solar+storage raise capacity value and firm up peak-hour deliveries, turning intermittent output into dispatchable MWs; interconnection reuse and shared O&M cut build costs and timelines as markets accelerate. Clearway’s ~6.0 GW renewables scale (2024) lets it set terms and timelines; projects remain cash-hungry today but show clear star potential tomorrow.
- Hybrid capacity value: higher peak deliverability
- Cost edge: reuse interconnection + shared O&M
- Scale: Clearway ~6.0 GW (2024)
- Financial: near-term cash needs, long-term upside
Community solar platforms in expanding states
Subscriber models are scaling fast in supportive states, with industry reports citing roughly 25% annual subscriber growth in 2023–24; Clearway can aggregate demand, manage churn, and convert waitlists faster than smaller players. Growth is brisk and cash cycles are heavy during ramp, but land this right and it graduates into a dependable earner.
- Scale advantage: faster aggregation and lower CAC
- Churn mgmt: portfolio-level retention reduces volatility
- Cash impact: heavy upfront capex and negative operating cash during ramp
- Exit potential: predictable cashflows once fully subscribed
6.0 GW renewables, >1,000 GW queue — repowering & storage raise output 30–50%
Clearway’s ~6.0 GW renewables (2024) and long-dated PPAs deliver predictable cashflows amid a US interconnection queue >1,000 GW (2023). Wind repowering and solar+storage hybrids raise output 30–50% and firm peak deliverability. Corporate PPAs rose ~30% YoY (2024), while subscriber growth ~25% (2023–24) fuels scale but demands upfront capex.
| Metric | Value |
|---|---|
| Operating renewables | ~6.0 GW (2024) |
| Interconnection queue | >1,000 GW (2023) |
| Corp PPA growth | ~30% YoY (2024) |
| Subscriber growth | ~25% (2023–24) |
What is included in the product
Detailed Word Document
In-depth BCG Matrix review of Clearway Energy’s units with clear recommendations on Stars, Cash Cows, Question Marks, Dogs.
Customizable Excel Spreadsheet
One-page BCG matrix for Clearway Energy—clarifies units, eases portfolio decisions and exports cleanly for presentations.
Cash Cows
Legacy contracted wind fleets
Legacy contracted wind fleets at Clearway Energy in 2024 deliver steady, predictable cash under long-term PPAs, with mature operations and optimized O&M that minimize variability. Growth is limited and operational drama is low, so these assets function as cash cows funding corporate needs. Financing is largely de-risked, allowing management to milk margins and redeploy proceeds upstream into growth projects and batteries.
Utility-scale solar under seasoned contracts
Older utility-scale solar under seasoned contracts deliver predictable output and low unit costs — industry LCOE for utility PV fell to roughly $35–45/MWh in 2024, tightening margins. Curtailment risk is quantified and hedged in Clearway’s PPAs, preserving cash flow. Net operating cash inflows typically exceed reinvestment needs; use surplus to fund the next wave of capacity additions.
Thermal district energy with take-or-pay
Thermal district energy with take-or-pay contracts serves institutions in mature grids, with contracts typically 10–25 years and high stickiness; EU district heating penetration was about 12% in 2024. Predictable cash flow and manageable capex cadence allow steady distributions, while efficiency retrofits (fuel-use gains commonly 5–15%) lift EBITDA without large bets. Classic Cow: keep it tight, keep it paying.
Conventional contracted generation
Where Clearway holds contracted conventional units, the cash profile is steady. Low growth, but grid-reliability premiums and capacity payments supported margins in 2024. Minimal promo spend; operations prioritize reliability and uptime—maintain and harvest.
- 2024 contracted conventional capacity ~7 GW
- Revenue stability driven by capacity payments and reliability premiums
- Strategy: maintain uptime, harvest cash
Asset-level O&M and origination know-how
Clearway’s asset-level O&M and origination know-how leverages a roughly 6.2 GW fleet (2024), driving lower per-MW operating costs across assets and lifting portfolio margins without needing headline growth.
The institutionalized know-how behaves like an annuity, generating predictable cashflow that quietly funds higher‑risk development and M&A plays.
- scale: 6.2 GW (2024)
- advantage: annuity-like O&M margins
- strategy: funds growth without headline spend
Annuity cash from legacy wind & low-LCOE utility PV in 2024
Legacy wind and seasoned utility PV deliver annuity-like cash in 2024, with Clearway’s 6.2 GW fleet and ~7 GW contracted conventional capacity underpinning stable margins; utility PV LCOE ~35–45/MWh (2024). District heating and contracted thermal add predictable take-or-pay cash; surplus funds development and batteries.
| Asset | 2024 GW | Cash trait | Contract |
|---|---|---|---|
| Wind | ≈3.0 | High predictability | Long-term PPA |
| Solar | ≈2.5 | Low LCOE | Seasoned PPA |
| Thermal | ≈0.7 | Take-or-pay | 10–25 yr |
| Conventional | ~7.0 | Capacity payments | Contracted |
Full Transparency, Always
Clearway Energy BCG Matrix
The Clearway Energy BCG Matrix you're previewing is the exact file you'll receive after purchase. No watermarks, no placeholders—just the finished, presentation-ready matrix built for strategic clarity. After buying, the full document is instantly downloadable and editable for your team or investors. It's the same professional analysis, formatted and ready to use.











