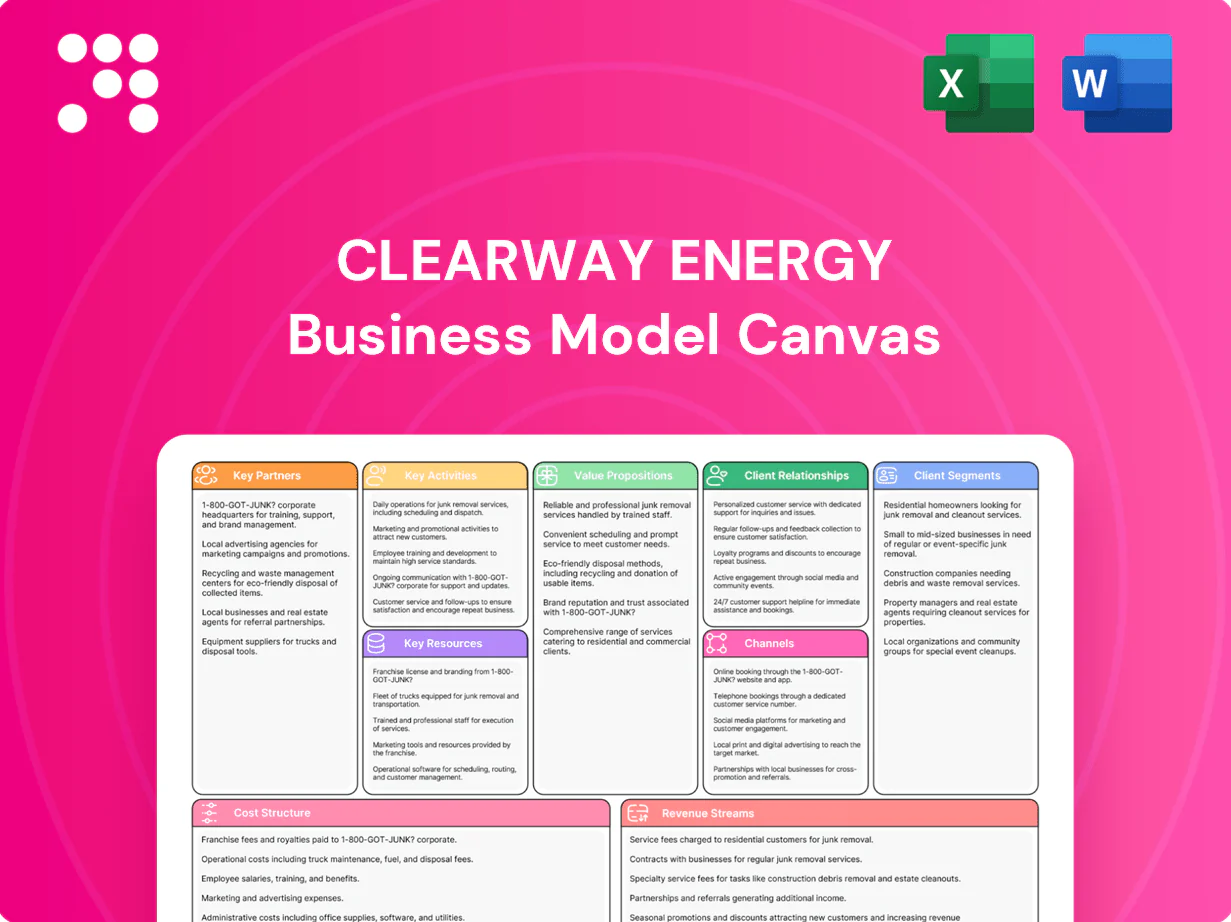
Clearway Energy Business Model Canvas

Business Model Canvas: Investor-Ready Renewable Energy Strategy Snapshot
Unlock Clearway Energy’s strategic blueprint with our Business Model Canvas—mapped across all nine blocks to show how the company creates and captures value. This concise, professional canvas highlights customer segments, revenue streams, key partnerships, and cost drivers with investor-ready clarity. Purchase the full Word and Excel files to get section-by-section insights, benchmarking metrics, and practical takeaways you can apply immediately.
Partnerships

OEM turbine and solar suppliers
Relationships with leading wind turbine and solar module/inverter manufacturers ensure reliable equipment and warranty support, with solar module performance warranties commonly 25 years and inverter warranties typically 10 years. Preferred vendor status can lower capex and shorten lead times through negotiated pricing and priority allocation. Access to spares and performance upgrades sustains availability, while technical collaboration enables repowering and life-extension strategies.
EPC and O&M service providers
EPC partners deliver projects on time and on budget, leveraging contracts and milestones to contain capital spend. Third-party and in-house O&M teams sustain fleet availability above 98% across seasonal cycles. Predictive maintenance programs cut unplanned outages by ~30%, lowering LCOE and repair costs. Long-term service agreements (10–25 years) align incentives on performance and uptime.

Utilities and corporate offtakers
Partnerships with creditworthy utilities and corporate offtakers underpin Clearway Energy’s long-term PPAs, supporting its ~7.7 GW renewables platform in 2024. Collaborative structuring aligns load profiles, ESG targets and budget certainty for buyers. Coordinated curtailment and scheduling with offtakers stabilizes delivery and revenue. Repeat counterparties enabled portfolio expansion and PPA renewals throughout 2024.

Financing, tax equity, and lenders
Banks, institutional investors, and tax-equity partners underpin Clearway’s capital-efficient growth, enabling project-level investments while ringfencing sponsor risk; project finance structures optimize cost of capital and in 2024 US tax-equity supply exceeded $20 billion, supporting scale-up. Hedging and interest-rate solutions boost cash-flow visibility, and long-term lender relationships accelerate subsequent transactions.
- Capital partners: banks, institutional investors, tax equity
- Structure: project finance ringfencing risk
- Risk tools: hedging and interest-rate swaps
- Benefit: faster follow-on deals from ongoing relationships
Developers and sponsor pipeline
Tie-ups with project developers secure a steady acquisition pipeline, supporting Clearway Energy’s portfolio growth to about 7.5 GW of operational renewable capacity as of 2024.
The sponsor ecosystem supplies origination, development expertise and drop-down opportunities, with co-development and early-stage options improving pricing and contract quality.
Co-development helps de-risk interconnection and permitting, shortening time-to-commission and preserving margin.
- pipeline: steady developer tie-ups
- sponsors: origination + drop-downs
- early-stage options: better pricing/contracts
- co-development: reduces interconnection/permitting risk
7.7 GW platform, >98% availability, ~30% fewer outages via predictive maintenance
Relationships with manufacturers, EPCs, O&M providers and financiers support Clearway’s 7.7 GW platform (2024), maintaining >98% availability and cutting unplanned outages ~30% via predictive maintenance. Long-term PPAs with utilities/corporates stabilize revenue; tax-equity and bank funding (US 2024 tax-equity >20B) enable project finance and rapid drop-downs.
| Partner | Role | 2024 metric |
|---|---|---|
| Manufacturers | Equipment/warranty | 25y modules/10y inverters |
| O&M/EPC | Availability/Build | >98% availability |
| Financiers | Project finance | US tax-equity >$20B |
What is included in the product
 Detailed Word Document
A concise, pre-written Business Model Canvas for Clearway Energy outlining customer segments, value propositions, channels, revenue streams, key partners, activities, resources, cost structure and governance aligned to its renewable power and storage strategy; ideal for investor presentations and strategic planning with SWOT-linked insights and competitive advantage analysis.

 Customizable Excel Spreadsheet
High-level view of Clearway Energy’s business model with editable cells, streamlining identification of revenue streams, asset mix, and regulatory or grid-integration pain points for faster strategic decisions.
Activities

Asset acquisition and integration
Source, diligence, and close contracted wind, solar, conventional, and thermal assets using standardized credit and resource models; Clearway’s fleet reached roughly 8 GW of capacity by 2024, guiding scale decisions. Evaluate counterparty credit, resource risk, and interconnection exposure with probabilistic dispatch and credit scoring. Structure financing to optimize tax attributes including ITC/PTC capture and transferability under 2024 law. Seamlessly onboard acquisitions into fleet operations and consolidated reporting.
Operations and maintenance
Run day-to-day plant operations to maximize safety and target fleet availability >98% across Clearway’s ~6.6 GW portfolio (2024). Execute preventive and corrective maintenance to cut forced outages, backed by 24/7 SCADA and analytics for real‑time O&M. Coordinate planned outages with offtakers and grid operators to protect PPA revenues and grid reliability.

Contract and risk management
Administering PPAs, heat supply and service agreements across Clearway’s ~7 GW portfolio ensures contractual delivery and settlement, with ~95% of generation under long-term contracts to meet obligations. The team manages market, weather, curtailment and credit risks using analytics and operational buffers, while hedges and insurance cover roughly 80% of expected cash flows to stabilize revenues. Ongoing monitoring enforces compliance with debt covenants and regulations tied to about $8 billion of financing.

Portfolio optimization and repowering
Portfolio optimization and repowering focus on identifying uprate, repower, or storage-add opportunities to lift yields, targeting industry-standard gains of 20–50% for repowered wind sites and multi-hour batteries to firm output. Recontracting expiring assets and rebalancing merchant exposure across regions/ISOs preserves value and aligns cashflows. Cost-out initiatives across vendors and sites aim to cut O&M and capex per MW by double-digit percentages.
- Identify uprate/repower/storage-add opportunities
- Recontract expiring assets to extend value
- Rebalance merchant exposure across ISOs/regions
- Execute vendor/site cost-out initiatives
Regulatory, ESG, and stakeholder engagement
Maintain permits, interconnection rights, and environmental compliance across Clearway’s portfolio, which exceeds 7 GW of renewable capacity as of 2024. Provide transparent ESG and SASB-aligned performance reporting in annual disclosures. Engage communities, regulators, and partners to sustain license to operate while supporting workforce safety and training programs.
- Maintain permits & interconnection rights for 7+ GW portfolio (2024)
- Annual ESG & SASB-aligned reporting
- Community, regulator & partner engagement
- Workforce safety & training programs
Source, finance, operate ~8 GW fleet, >98% avail, repower +20-50%, hedge 80%
Source, finance, and integrate wind/solar/thermal assets into ~8 GW fleet (2024), underwriting with probabilistic dispatch and credit scoring. Operate to >98% availability across ~6.6 GW portfolio with 24/7 SCADA O&M and 95% contracted generation. Optimize via repower/storage (target +20–50% yield), manage ~$8B debt and hedge ~80% of cash flows.
| Metric | Value | Year |
|---|---|---|
| Fleet capacity | ~8 GW | 2024 |
| Oper. availability | >98% | 2024 |
| Contracted generation | 95% | 2024 |
| Debt financing | ~$8B | 2024 |
| Hedge coverage | ~80% | 2024 |
| Repower uplift | 20–50% | Industry |
What You See Is What You Get
Business Model Canvas
The Clearway Energy Business Model Canvas you’re previewing is the actual deliverable, not a mockup. When you purchase, you’ll receive this same complete document immediately, formatted for editing and presentation. No placeholders, no surprises—what you see is what you’ll download.

Business Model Canvas: Investor-Ready Renewable Energy Strategy Snapshot
Unlock Clearway Energy’s strategic blueprint with our Business Model Canvas—mapped across all nine blocks to show how the company creates and captures value. This concise, professional canvas highlights customer segments, revenue streams, key partnerships, and cost drivers with investor-ready clarity. Purchase the full Word and Excel files to get section-by-section insights, benchmarking metrics, and practical takeaways you can apply immediately.
Partnerships
OEM turbine and solar suppliers
Relationships with leading wind turbine and solar module/inverter manufacturers ensure reliable equipment and warranty support, with solar module performance warranties commonly 25 years and inverter warranties typically 10 years. Preferred vendor status can lower capex and shorten lead times through negotiated pricing and priority allocation. Access to spares and performance upgrades sustains availability, while technical collaboration enables repowering and life-extension strategies.
EPC and O&M service providers
EPC partners deliver projects on time and on budget, leveraging contracts and milestones to contain capital spend. Third-party and in-house O&M teams sustain fleet availability above 98% across seasonal cycles. Predictive maintenance programs cut unplanned outages by ~30%, lowering LCOE and repair costs. Long-term service agreements (10–25 years) align incentives on performance and uptime.
Utilities and corporate offtakers
Partnerships with creditworthy utilities and corporate offtakers underpin Clearway Energy’s long-term PPAs, supporting its ~7.7 GW renewables platform in 2024. Collaborative structuring aligns load profiles, ESG targets and budget certainty for buyers. Coordinated curtailment and scheduling with offtakers stabilizes delivery and revenue. Repeat counterparties enabled portfolio expansion and PPA renewals throughout 2024.
Financing, tax equity, and lenders
Banks, institutional investors, and tax-equity partners underpin Clearway’s capital-efficient growth, enabling project-level investments while ringfencing sponsor risk; project finance structures optimize cost of capital and in 2024 US tax-equity supply exceeded $20 billion, supporting scale-up. Hedging and interest-rate solutions boost cash-flow visibility, and long-term lender relationships accelerate subsequent transactions.
- Capital partners: banks, institutional investors, tax equity
- Structure: project finance ringfencing risk
- Risk tools: hedging and interest-rate swaps
- Benefit: faster follow-on deals from ongoing relationships
Developers and sponsor pipeline
Tie-ups with project developers secure a steady acquisition pipeline, supporting Clearway Energy’s portfolio growth to about 7.5 GW of operational renewable capacity as of 2024.
The sponsor ecosystem supplies origination, development expertise and drop-down opportunities, with co-development and early-stage options improving pricing and contract quality.
Co-development helps de-risk interconnection and permitting, shortening time-to-commission and preserving margin.
- pipeline: steady developer tie-ups
- sponsors: origination + drop-downs
- early-stage options: better pricing/contracts
- co-development: reduces interconnection/permitting risk
7.7 GW platform, >98% availability, ~30% fewer outages via predictive maintenance
Relationships with manufacturers, EPCs, O&M providers and financiers support Clearway’s 7.7 GW platform (2024), maintaining >98% availability and cutting unplanned outages ~30% via predictive maintenance. Long-term PPAs with utilities/corporates stabilize revenue; tax-equity and bank funding (US 2024 tax-equity >20B) enable project finance and rapid drop-downs.
| Partner | Role | 2024 metric |
|---|---|---|
| Manufacturers | Equipment/warranty | 25y modules/10y inverters |
| O&M/EPC | Availability/Build | >98% availability |
| Financiers | Project finance | US tax-equity >$20B |
What is included in the product
Detailed Word Document
A concise, pre-written Business Model Canvas for Clearway Energy outlining customer segments, value propositions, channels, revenue streams, key partners, activities, resources, cost structure and governance aligned to its renewable power and storage strategy; ideal for investor presentations and strategic planning with SWOT-linked insights and competitive advantage analysis.
Customizable Excel Spreadsheet
High-level view of Clearway Energy’s business model with editable cells, streamlining identification of revenue streams, asset mix, and regulatory or grid-integration pain points for faster strategic decisions.
Activities
Asset acquisition and integration
Source, diligence, and close contracted wind, solar, conventional, and thermal assets using standardized credit and resource models; Clearway’s fleet reached roughly 8 GW of capacity by 2024, guiding scale decisions. Evaluate counterparty credit, resource risk, and interconnection exposure with probabilistic dispatch and credit scoring. Structure financing to optimize tax attributes including ITC/PTC capture and transferability under 2024 law. Seamlessly onboard acquisitions into fleet operations and consolidated reporting.
Operations and maintenance
Run day-to-day plant operations to maximize safety and target fleet availability >98% across Clearway’s ~6.6 GW portfolio (2024). Execute preventive and corrective maintenance to cut forced outages, backed by 24/7 SCADA and analytics for real‑time O&M. Coordinate planned outages with offtakers and grid operators to protect PPA revenues and grid reliability.
Contract and risk management
Administering PPAs, heat supply and service agreements across Clearway’s ~7 GW portfolio ensures contractual delivery and settlement, with ~95% of generation under long-term contracts to meet obligations. The team manages market, weather, curtailment and credit risks using analytics and operational buffers, while hedges and insurance cover roughly 80% of expected cash flows to stabilize revenues. Ongoing monitoring enforces compliance with debt covenants and regulations tied to about $8 billion of financing.
Portfolio optimization and repowering
Portfolio optimization and repowering focus on identifying uprate, repower, or storage-add opportunities to lift yields, targeting industry-standard gains of 20–50% for repowered wind sites and multi-hour batteries to firm output. Recontracting expiring assets and rebalancing merchant exposure across regions/ISOs preserves value and aligns cashflows. Cost-out initiatives across vendors and sites aim to cut O&M and capex per MW by double-digit percentages.
- Identify uprate/repower/storage-add opportunities
- Recontract expiring assets to extend value
- Rebalance merchant exposure across ISOs/regions
- Execute vendor/site cost-out initiatives
Regulatory, ESG, and stakeholder engagement
Maintain permits, interconnection rights, and environmental compliance across Clearway’s portfolio, which exceeds 7 GW of renewable capacity as of 2024. Provide transparent ESG and SASB-aligned performance reporting in annual disclosures. Engage communities, regulators, and partners to sustain license to operate while supporting workforce safety and training programs.
- Maintain permits & interconnection rights for 7+ GW portfolio (2024)
- Annual ESG & SASB-aligned reporting
- Community, regulator & partner engagement
- Workforce safety & training programs
Source, finance, operate ~8 GW fleet, >98% avail, repower +20-50%, hedge 80%
Source, finance, and integrate wind/solar/thermal assets into ~8 GW fleet (2024), underwriting with probabilistic dispatch and credit scoring. Operate to >98% availability across ~6.6 GW portfolio with 24/7 SCADA O&M and 95% contracted generation. Optimize via repower/storage (target +20–50% yield), manage ~$8B debt and hedge ~80% of cash flows.
| Metric | Value | Year |
|---|---|---|
| Fleet capacity | ~8 GW | 2024 |
| Oper. availability | >98% | 2024 |
| Contracted generation | 95% | 2024 |
| Debt financing | ~$8B | 2024 |
| Hedge coverage | ~80% | 2024 |
| Repower uplift | 20–50% | Industry |
What You See Is What You Get
Business Model Canvas
The Clearway Energy Business Model Canvas you’re previewing is the actual deliverable, not a mockup. When you purchase, you’ll receive this same complete document immediately, formatted for editing and presentation. No placeholders, no surprises—what you see is what you’ll download.
Description
Business Model Canvas: Investor-Ready Renewable Energy Strategy Snapshot
Unlock Clearway Energy’s strategic blueprint with our Business Model Canvas—mapped across all nine blocks to show how the company creates and captures value. This concise, professional canvas highlights customer segments, revenue streams, key partnerships, and cost drivers with investor-ready clarity. Purchase the full Word and Excel files to get section-by-section insights, benchmarking metrics, and practical takeaways you can apply immediately.
Partnerships
OEM turbine and solar suppliers
Relationships with leading wind turbine and solar module/inverter manufacturers ensure reliable equipment and warranty support, with solar module performance warranties commonly 25 years and inverter warranties typically 10 years. Preferred vendor status can lower capex and shorten lead times through negotiated pricing and priority allocation. Access to spares and performance upgrades sustains availability, while technical collaboration enables repowering and life-extension strategies.
EPC and O&M service providers
EPC partners deliver projects on time and on budget, leveraging contracts and milestones to contain capital spend. Third-party and in-house O&M teams sustain fleet availability above 98% across seasonal cycles. Predictive maintenance programs cut unplanned outages by ~30%, lowering LCOE and repair costs. Long-term service agreements (10–25 years) align incentives on performance and uptime.
Utilities and corporate offtakers
Partnerships with creditworthy utilities and corporate offtakers underpin Clearway Energy’s long-term PPAs, supporting its ~7.7 GW renewables platform in 2024. Collaborative structuring aligns load profiles, ESG targets and budget certainty for buyers. Coordinated curtailment and scheduling with offtakers stabilizes delivery and revenue. Repeat counterparties enabled portfolio expansion and PPA renewals throughout 2024.
Financing, tax equity, and lenders
Banks, institutional investors, and tax-equity partners underpin Clearway’s capital-efficient growth, enabling project-level investments while ringfencing sponsor risk; project finance structures optimize cost of capital and in 2024 US tax-equity supply exceeded $20 billion, supporting scale-up. Hedging and interest-rate solutions boost cash-flow visibility, and long-term lender relationships accelerate subsequent transactions.
- Capital partners: banks, institutional investors, tax equity
- Structure: project finance ringfencing risk
- Risk tools: hedging and interest-rate swaps
- Benefit: faster follow-on deals from ongoing relationships
Developers and sponsor pipeline
Tie-ups with project developers secure a steady acquisition pipeline, supporting Clearway Energy’s portfolio growth to about 7.5 GW of operational renewable capacity as of 2024.
The sponsor ecosystem supplies origination, development expertise and drop-down opportunities, with co-development and early-stage options improving pricing and contract quality.
Co-development helps de-risk interconnection and permitting, shortening time-to-commission and preserving margin.
- pipeline: steady developer tie-ups
- sponsors: origination + drop-downs
- early-stage options: better pricing/contracts
- co-development: reduces interconnection/permitting risk
7.7 GW platform, >98% availability, ~30% fewer outages via predictive maintenance
Relationships with manufacturers, EPCs, O&M providers and financiers support Clearway’s 7.7 GW platform (2024), maintaining >98% availability and cutting unplanned outages ~30% via predictive maintenance. Long-term PPAs with utilities/corporates stabilize revenue; tax-equity and bank funding (US 2024 tax-equity >20B) enable project finance and rapid drop-downs.
| Partner | Role | 2024 metric |
|---|---|---|
| Manufacturers | Equipment/warranty | 25y modules/10y inverters |
| O&M/EPC | Availability/Build | >98% availability |
| Financiers | Project finance | US tax-equity >$20B |
What is included in the product
Detailed Word Document
A concise, pre-written Business Model Canvas for Clearway Energy outlining customer segments, value propositions, channels, revenue streams, key partners, activities, resources, cost structure and governance aligned to its renewable power and storage strategy; ideal for investor presentations and strategic planning with SWOT-linked insights and competitive advantage analysis.
Customizable Excel Spreadsheet
High-level view of Clearway Energy’s business model with editable cells, streamlining identification of revenue streams, asset mix, and regulatory or grid-integration pain points for faster strategic decisions.
Activities
Asset acquisition and integration
Source, diligence, and close contracted wind, solar, conventional, and thermal assets using standardized credit and resource models; Clearway’s fleet reached roughly 8 GW of capacity by 2024, guiding scale decisions. Evaluate counterparty credit, resource risk, and interconnection exposure with probabilistic dispatch and credit scoring. Structure financing to optimize tax attributes including ITC/PTC capture and transferability under 2024 law. Seamlessly onboard acquisitions into fleet operations and consolidated reporting.
Operations and maintenance
Run day-to-day plant operations to maximize safety and target fleet availability >98% across Clearway’s ~6.6 GW portfolio (2024). Execute preventive and corrective maintenance to cut forced outages, backed by 24/7 SCADA and analytics for real‑time O&M. Coordinate planned outages with offtakers and grid operators to protect PPA revenues and grid reliability.
Contract and risk management
Administering PPAs, heat supply and service agreements across Clearway’s ~7 GW portfolio ensures contractual delivery and settlement, with ~95% of generation under long-term contracts to meet obligations. The team manages market, weather, curtailment and credit risks using analytics and operational buffers, while hedges and insurance cover roughly 80% of expected cash flows to stabilize revenues. Ongoing monitoring enforces compliance with debt covenants and regulations tied to about $8 billion of financing.
Portfolio optimization and repowering
Portfolio optimization and repowering focus on identifying uprate, repower, or storage-add opportunities to lift yields, targeting industry-standard gains of 20–50% for repowered wind sites and multi-hour batteries to firm output. Recontracting expiring assets and rebalancing merchant exposure across regions/ISOs preserves value and aligns cashflows. Cost-out initiatives across vendors and sites aim to cut O&M and capex per MW by double-digit percentages.
- Identify uprate/repower/storage-add opportunities
- Recontract expiring assets to extend value
- Rebalance merchant exposure across ISOs/regions
- Execute vendor/site cost-out initiatives
Regulatory, ESG, and stakeholder engagement
Maintain permits, interconnection rights, and environmental compliance across Clearway’s portfolio, which exceeds 7 GW of renewable capacity as of 2024. Provide transparent ESG and SASB-aligned performance reporting in annual disclosures. Engage communities, regulators, and partners to sustain license to operate while supporting workforce safety and training programs.
- Maintain permits & interconnection rights for 7+ GW portfolio (2024)
- Annual ESG & SASB-aligned reporting
- Community, regulator & partner engagement
- Workforce safety & training programs
Source, finance, operate ~8 GW fleet, >98% avail, repower +20-50%, hedge 80%
Source, finance, and integrate wind/solar/thermal assets into ~8 GW fleet (2024), underwriting with probabilistic dispatch and credit scoring. Operate to >98% availability across ~6.6 GW portfolio with 24/7 SCADA O&M and 95% contracted generation. Optimize via repower/storage (target +20–50% yield), manage ~$8B debt and hedge ~80% of cash flows.
| Metric | Value | Year |
|---|---|---|
| Fleet capacity | ~8 GW | 2024 |
| Oper. availability | >98% | 2024 |
| Contracted generation | 95% | 2024 |
| Debt financing | ~$8B | 2024 |
| Hedge coverage | ~80% | 2024 |
| Repower uplift | 20–50% | Industry |
What You See Is What You Get
Business Model Canvas
The Clearway Energy Business Model Canvas you’re previewing is the actual deliverable, not a mockup. When you purchase, you’ll receive this same complete document immediately, formatted for editing and presentation. No placeholders, no surprises—what you see is what you’ll download.











