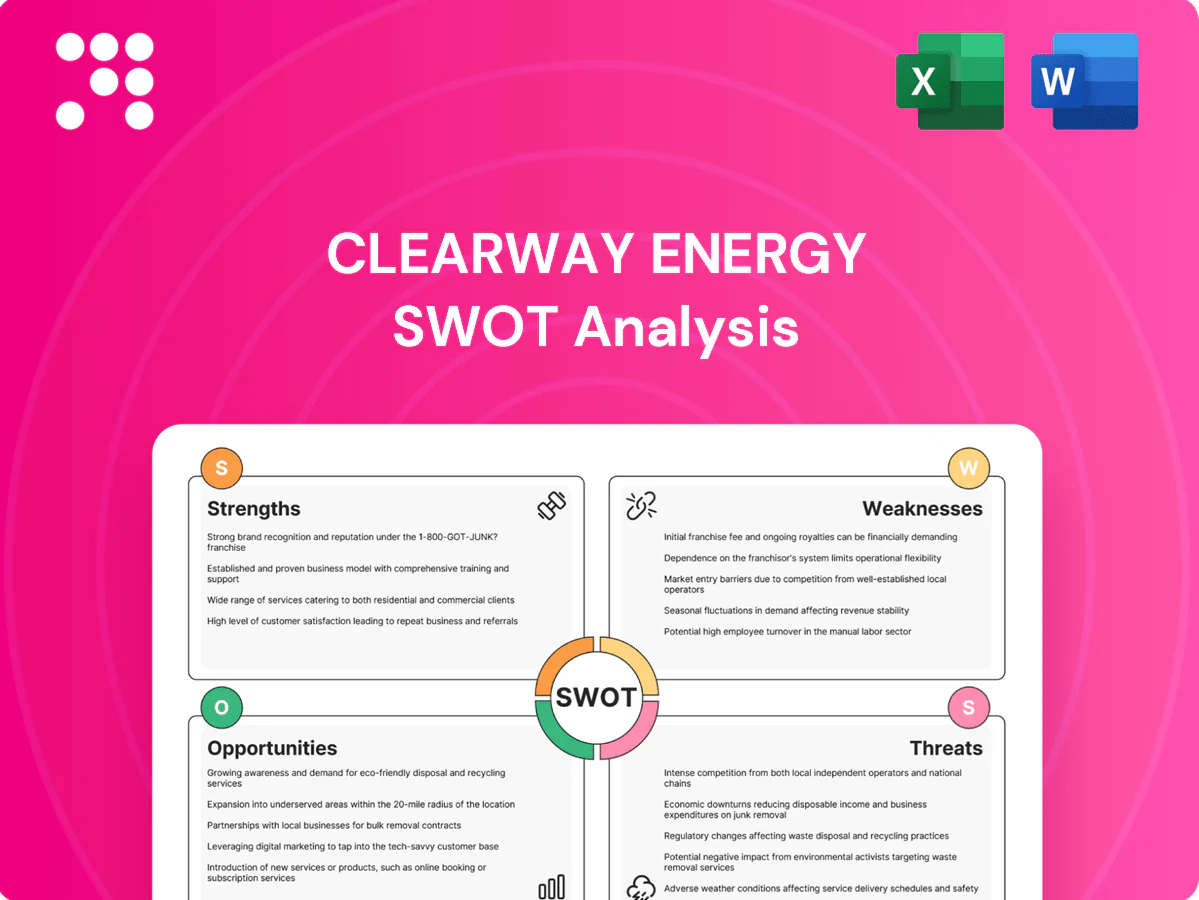
Clearway Energy SWOT Analysis

Your Strategic Toolkit Starts Here
Clearway Energy combines a diversified renewable fleet and long-term contracted cash flows—strengths that support stable returns—yet faces high leverage and regulatory exposure that dampen flexibility. Opportunities in battery storage and clean energy demand contrast with threats from interest rates and policy shifts. Want full strategic clarity? Purchase the complete SWOT for a research-backed, editable Word + Excel package to plan, pitch, or invest with confidence.
Strengths

Diversified asset base
Clearway's diversified asset base spans roughly 6.6 GW of utility-scale wind, solar, conventional generation and thermal infrastructure, reducing revenue volatility. Multiple technologies and varied offtake structures (majority long-term PPAs) balance seasonal and resource risks. Thermal and conventional units supply grid support and stable cash flow alongside intermittent renewables. Diversification smooths performance, aiding capital access and financing terms.
Long-term contracted cash flows
Clearway's ~6.7 GW portfolio is largely backed by long-dated PPAs and service contracts with investment-grade counterparties, with over 90% of expected 2024 revenue contracted. This contracted revenue boosts cash flow visibility and lowers volatility, underpinning dividend stability. Predictable cash flows expand debt capacity and have supported roughly $2.5 billion of financing at sub-250 bps spreads. Predictability is central to the yieldco model.

Scale and operating expertise
One of the largest U.S. renewable owners with ~6.5 GW of operational capacity (2024), enabling procurement leverage and O&M scale. Centralized asset management and data-driven optimization have lifted fleet availability to roughly 97%, boosting annual yield. Scale supports competitive contract bids and accretive acquisitions, accelerating growth. Deep multi-technology experience shortens repower and hybridization learning curves.

Sponsor and capital market access
Backed by Global Infrastructure Partners as sponsor, Clearway leverages a visible project pipeline and proven structuring know-how to lower development execution risk.
Dropdown transactions create a repeatable growth engine while established lender and tax-equity relationships enhance financing flexibility and recycling of capital via asset sales and refinancings.
- Sponsor: Global Infrastructure Partners
- Repeatable dropdown growth
- Strong lender and tax-equity access
- Capital recycling via sales/refis
Strong ESG positioning
Clearways exposure to clean energy aligns with investor mandates and US decarbonization rules, supported by a broadly contracted portfolio of roughly 5.3 GW of owned and managed renewable capacity (2024 disclosure), attracting ESG-focused capital and policy-aligned investors.
Strong ESG credentials expand the investor base and can lower cost of capital via ESG-linked debt, while positive stakeholder perception eases permitting and community engagement; transparent sustainability metrics enable benchmarking and improved disclosure.
- ESG-aligned portfolio: ~5.3 GW (2024)
- ESG-linked financing: reduced spreads
- Stronger permitting outcomes
- Robust sustainability disclosure
Diversified 6.6 GW fleet, 90% contracted revenue and $2.5B financing at sub-250 bps
Clearway's diversified ~6.6 GW portfolio (2024) and multi‑technology mix reduce revenue volatility; ~90% of 2024 revenue contracted under long‑dated PPAs boosts cash‑flow visibility. Scale drives ~97% fleet availability and procurement/O&M leverage; sponsor backing enables repeatable dropdowns and ~$2.5bn financing at <250 bps.
| Metric | Value (2024) |
|---|---|
| Portfolio capacity | ~6.6 GW |
| Renewable owned/managed | ~5.3 GW |
| Contracted revenue | ~90% |
| Fleet availability | ~97% |
| Financing | ~$2.5B @ <250 bps |
What is included in the product
 Detailed Word Document
Delivers a strategic overview of Clearway Energy’s strengths, weaknesses, opportunities, and threats, mapping internal capabilities, market drivers, regulatory risks, and competitive positioning to inform growth strategies and risk management decisions.

 Customizable Excel Spreadsheet
Provides a concise SWOT matrix tailored to Clearway Energy for fast, visual alignment of renewable asset strategy and regulatory risk mitigation.
Weaknesses

Resource and curtailment exposure
Wind and solar output varies daily and seasonally—U.S. EIA reported 2023 average capacity factors ~34% for wind and ~23% for utility‑scale solar—so contracted volumes can still miss forecasts. Grid constraints and localized curtailment in high‑penetration regions have trimmed delivered energy and revenue, with some ISO curtailments reaching multi‑percent levels during oversupply events. Physical resource risk is hard to hedge financially, complicating forecasts, covenant compliance, and liquidity planning.
Interest rate sensitivity
As a yield-oriented vehicle, Clearway’s valuation and dividend coverage are sensitive to interest rates; with the Fed funds target at 5.25–5.50% (July 2025) and 10-year Treasuries near 4.2% in H1 2025, rising yields lift financing costs and compress equity multiples. Refinancing waves can cut CAFD if spreads or base rates widen, and higher rates push required hurdle returns above Clearway’s ~6% dividend yield, challenging new investment economics.

Merchant tail risk
Clearway flagged merchant tail risk in its 2024 disclosures: cash flows decline as PPAs expire and assets become exposed to wholesale market prices. Recontracting may occur at less favorable prices if supply exceeds demand, eroding merchant-value. Older units face steeper discounts absent repowering or storage, requiring planning and capex to mitigate tail erosion.

Leverage and structural complexity
Project-level non-recourse debt combined with holdco borrowings creates layered obligations for Clearway, where covenants, DSCR thresholds and cash traps can sharply limit liquidity and strategic flexibility under stress. Complex capital structures increase administrative costs and execution risk, and elevated leverage amplifies sensitivity to operational deviations such as lower production or merchant price drops.
- Layered obligations: project + holdco debt
- Covenants: DSCR thresholds, cash traps restrict flexibility
- Operational sensitivity: high leverage amplifies downside
- Higher administrative and execution risk from complexity
Counterparty concentration
Revenues depend on a limited number of utilities and corporate offtakers, making cash flow vulnerable to a few counterparties; credit downgrades or contractual disputes can directly pressure distributions. In distressed markets, renegotiations and contract amendments can force lower pricing or revenue deferrals. Geographic project clustering further concentrates regulatory and permitting risk in specific states or regions.
- Counterparty concentration: limited pool of utilities/corporates
- Credit risk: downgrades can hit distributions
- Renegotiation risk: distressed pricing pressure
- Geographic/regulatory clustering: localized exposure
Wind/solar 34%/23%, merchant risk & rates hit ~6% div
Clearway faces variable wind/solar output (2023 capacity factors: wind ~34%, solar ~23%), merchant tail risk as PPAs expire, and sensitivity to rates (Fed funds 5.25–5.50% Jul 2025; 10‑yr ~4.2% H1 2025) that pressures its ~6% dividend coverage. Layered project/holdco debt and counterparty concentration heighten liquidity and execution risk.
| Weakness | Key metric | Impact |
|---|---|---|
| Resource variability | Wind 34%, Solar 23% (2023) | Forecast/revenue risk |
| Rate sensitivity | Fed 5.25–5.50%, 10yr ~4.2% | Dividend/financing pressure |
| Capital structure | Project+holdco debt | Liquidity/covenant risk |
What You See Is What You Get
Clearway Energy SWOT Analysis
This is the actual SWOT analysis document you’ll receive upon purchase—no surprises, just professional quality. The preview below is taken directly from the full SWOT report you'll get; purchase unlocks the entire in‑depth, editable version. You’re viewing a live preview of the real file, and the complete document becomes available immediately after checkout.

Your Strategic Toolkit Starts Here
Clearway Energy combines a diversified renewable fleet and long-term contracted cash flows—strengths that support stable returns—yet faces high leverage and regulatory exposure that dampen flexibility. Opportunities in battery storage and clean energy demand contrast with threats from interest rates and policy shifts. Want full strategic clarity? Purchase the complete SWOT for a research-backed, editable Word + Excel package to plan, pitch, or invest with confidence.
Strengths
Diversified asset base
Clearway's diversified asset base spans roughly 6.6 GW of utility-scale wind, solar, conventional generation and thermal infrastructure, reducing revenue volatility. Multiple technologies and varied offtake structures (majority long-term PPAs) balance seasonal and resource risks. Thermal and conventional units supply grid support and stable cash flow alongside intermittent renewables. Diversification smooths performance, aiding capital access and financing terms.
Long-term contracted cash flows
Clearway's ~6.7 GW portfolio is largely backed by long-dated PPAs and service contracts with investment-grade counterparties, with over 90% of expected 2024 revenue contracted. This contracted revenue boosts cash flow visibility and lowers volatility, underpinning dividend stability. Predictable cash flows expand debt capacity and have supported roughly $2.5 billion of financing at sub-250 bps spreads. Predictability is central to the yieldco model.
Scale and operating expertise
One of the largest U.S. renewable owners with ~6.5 GW of operational capacity (2024), enabling procurement leverage and O&M scale. Centralized asset management and data-driven optimization have lifted fleet availability to roughly 97%, boosting annual yield. Scale supports competitive contract bids and accretive acquisitions, accelerating growth. Deep multi-technology experience shortens repower and hybridization learning curves.
Sponsor and capital market access
Backed by Global Infrastructure Partners as sponsor, Clearway leverages a visible project pipeline and proven structuring know-how to lower development execution risk.
Dropdown transactions create a repeatable growth engine while established lender and tax-equity relationships enhance financing flexibility and recycling of capital via asset sales and refinancings.
- Sponsor: Global Infrastructure Partners
- Repeatable dropdown growth
- Strong lender and tax-equity access
- Capital recycling via sales/refis
Strong ESG positioning
Clearways exposure to clean energy aligns with investor mandates and US decarbonization rules, supported by a broadly contracted portfolio of roughly 5.3 GW of owned and managed renewable capacity (2024 disclosure), attracting ESG-focused capital and policy-aligned investors.
Strong ESG credentials expand the investor base and can lower cost of capital via ESG-linked debt, while positive stakeholder perception eases permitting and community engagement; transparent sustainability metrics enable benchmarking and improved disclosure.
- ESG-aligned portfolio: ~5.3 GW (2024)
- ESG-linked financing: reduced spreads
- Stronger permitting outcomes
- Robust sustainability disclosure
Diversified 6.6 GW fleet, 90% contracted revenue and $2.5B financing at sub-250 bps
Clearway's diversified ~6.6 GW portfolio (2024) and multi‑technology mix reduce revenue volatility; ~90% of 2024 revenue contracted under long‑dated PPAs boosts cash‑flow visibility. Scale drives ~97% fleet availability and procurement/O&M leverage; sponsor backing enables repeatable dropdowns and ~$2.5bn financing at <250 bps.
| Metric | Value (2024) |
|---|---|
| Portfolio capacity | ~6.6 GW |
| Renewable owned/managed | ~5.3 GW |
| Contracted revenue | ~90% |
| Fleet availability | ~97% |
| Financing | ~$2.5B @ <250 bps |
What is included in the product
Detailed Word Document
Delivers a strategic overview of Clearway Energy’s strengths, weaknesses, opportunities, and threats, mapping internal capabilities, market drivers, regulatory risks, and competitive positioning to inform growth strategies and risk management decisions.
Customizable Excel Spreadsheet
Provides a concise SWOT matrix tailored to Clearway Energy for fast, visual alignment of renewable asset strategy and regulatory risk mitigation.
Weaknesses
Resource and curtailment exposure
Wind and solar output varies daily and seasonally—U.S. EIA reported 2023 average capacity factors ~34% for wind and ~23% for utility‑scale solar—so contracted volumes can still miss forecasts. Grid constraints and localized curtailment in high‑penetration regions have trimmed delivered energy and revenue, with some ISO curtailments reaching multi‑percent levels during oversupply events. Physical resource risk is hard to hedge financially, complicating forecasts, covenant compliance, and liquidity planning.
Interest rate sensitivity
As a yield-oriented vehicle, Clearway’s valuation and dividend coverage are sensitive to interest rates; with the Fed funds target at 5.25–5.50% (July 2025) and 10-year Treasuries near 4.2% in H1 2025, rising yields lift financing costs and compress equity multiples. Refinancing waves can cut CAFD if spreads or base rates widen, and higher rates push required hurdle returns above Clearway’s ~6% dividend yield, challenging new investment economics.
Merchant tail risk
Clearway flagged merchant tail risk in its 2024 disclosures: cash flows decline as PPAs expire and assets become exposed to wholesale market prices. Recontracting may occur at less favorable prices if supply exceeds demand, eroding merchant-value. Older units face steeper discounts absent repowering or storage, requiring planning and capex to mitigate tail erosion.
Leverage and structural complexity
Project-level non-recourse debt combined with holdco borrowings creates layered obligations for Clearway, where covenants, DSCR thresholds and cash traps can sharply limit liquidity and strategic flexibility under stress. Complex capital structures increase administrative costs and execution risk, and elevated leverage amplifies sensitivity to operational deviations such as lower production or merchant price drops.
- Layered obligations: project + holdco debt
- Covenants: DSCR thresholds, cash traps restrict flexibility
- Operational sensitivity: high leverage amplifies downside
- Higher administrative and execution risk from complexity
Counterparty concentration
Revenues depend on a limited number of utilities and corporate offtakers, making cash flow vulnerable to a few counterparties; credit downgrades or contractual disputes can directly pressure distributions. In distressed markets, renegotiations and contract amendments can force lower pricing or revenue deferrals. Geographic project clustering further concentrates regulatory and permitting risk in specific states or regions.
- Counterparty concentration: limited pool of utilities/corporates
- Credit risk: downgrades can hit distributions
- Renegotiation risk: distressed pricing pressure
- Geographic/regulatory clustering: localized exposure
Wind/solar 34%/23%, merchant risk & rates hit ~6% div
Clearway faces variable wind/solar output (2023 capacity factors: wind ~34%, solar ~23%), merchant tail risk as PPAs expire, and sensitivity to rates (Fed funds 5.25–5.50% Jul 2025; 10‑yr ~4.2% H1 2025) that pressures its ~6% dividend coverage. Layered project/holdco debt and counterparty concentration heighten liquidity and execution risk.
| Weakness | Key metric | Impact |
|---|---|---|
| Resource variability | Wind 34%, Solar 23% (2023) | Forecast/revenue risk |
| Rate sensitivity | Fed 5.25–5.50%, 10yr ~4.2% | Dividend/financing pressure |
| Capital structure | Project+holdco debt | Liquidity/covenant risk |
What You See Is What You Get
Clearway Energy SWOT Analysis
This is the actual SWOT analysis document you’ll receive upon purchase—no surprises, just professional quality. The preview below is taken directly from the full SWOT report you'll get; purchase unlocks the entire in‑depth, editable version. You’re viewing a live preview of the real file, and the complete document becomes available immediately after checkout.
Original: $10.00
-65%$10.00
$3.50Description
Your Strategic Toolkit Starts Here
Clearway Energy combines a diversified renewable fleet and long-term contracted cash flows—strengths that support stable returns—yet faces high leverage and regulatory exposure that dampen flexibility. Opportunities in battery storage and clean energy demand contrast with threats from interest rates and policy shifts. Want full strategic clarity? Purchase the complete SWOT for a research-backed, editable Word + Excel package to plan, pitch, or invest with confidence.
Strengths
Diversified asset base
Clearway's diversified asset base spans roughly 6.6 GW of utility-scale wind, solar, conventional generation and thermal infrastructure, reducing revenue volatility. Multiple technologies and varied offtake structures (majority long-term PPAs) balance seasonal and resource risks. Thermal and conventional units supply grid support and stable cash flow alongside intermittent renewables. Diversification smooths performance, aiding capital access and financing terms.
Long-term contracted cash flows
Clearway's ~6.7 GW portfolio is largely backed by long-dated PPAs and service contracts with investment-grade counterparties, with over 90% of expected 2024 revenue contracted. This contracted revenue boosts cash flow visibility and lowers volatility, underpinning dividend stability. Predictable cash flows expand debt capacity and have supported roughly $2.5 billion of financing at sub-250 bps spreads. Predictability is central to the yieldco model.
Scale and operating expertise
One of the largest U.S. renewable owners with ~6.5 GW of operational capacity (2024), enabling procurement leverage and O&M scale. Centralized asset management and data-driven optimization have lifted fleet availability to roughly 97%, boosting annual yield. Scale supports competitive contract bids and accretive acquisitions, accelerating growth. Deep multi-technology experience shortens repower and hybridization learning curves.
Sponsor and capital market access
Backed by Global Infrastructure Partners as sponsor, Clearway leverages a visible project pipeline and proven structuring know-how to lower development execution risk.
Dropdown transactions create a repeatable growth engine while established lender and tax-equity relationships enhance financing flexibility and recycling of capital via asset sales and refinancings.
- Sponsor: Global Infrastructure Partners
- Repeatable dropdown growth
- Strong lender and tax-equity access
- Capital recycling via sales/refis
Strong ESG positioning
Clearways exposure to clean energy aligns with investor mandates and US decarbonization rules, supported by a broadly contracted portfolio of roughly 5.3 GW of owned and managed renewable capacity (2024 disclosure), attracting ESG-focused capital and policy-aligned investors.
Strong ESG credentials expand the investor base and can lower cost of capital via ESG-linked debt, while positive stakeholder perception eases permitting and community engagement; transparent sustainability metrics enable benchmarking and improved disclosure.
- ESG-aligned portfolio: ~5.3 GW (2024)
- ESG-linked financing: reduced spreads
- Stronger permitting outcomes
- Robust sustainability disclosure
Diversified 6.6 GW fleet, 90% contracted revenue and $2.5B financing at sub-250 bps
Clearway's diversified ~6.6 GW portfolio (2024) and multi‑technology mix reduce revenue volatility; ~90% of 2024 revenue contracted under long‑dated PPAs boosts cash‑flow visibility. Scale drives ~97% fleet availability and procurement/O&M leverage; sponsor backing enables repeatable dropdowns and ~$2.5bn financing at <250 bps.
| Metric | Value (2024) |
|---|---|
| Portfolio capacity | ~6.6 GW |
| Renewable owned/managed | ~5.3 GW |
| Contracted revenue | ~90% |
| Fleet availability | ~97% |
| Financing | ~$2.5B @ <250 bps |
What is included in the product
Detailed Word Document
Delivers a strategic overview of Clearway Energy’s strengths, weaknesses, opportunities, and threats, mapping internal capabilities, market drivers, regulatory risks, and competitive positioning to inform growth strategies and risk management decisions.
Customizable Excel Spreadsheet
Provides a concise SWOT matrix tailored to Clearway Energy for fast, visual alignment of renewable asset strategy and regulatory risk mitigation.
Weaknesses
Resource and curtailment exposure
Wind and solar output varies daily and seasonally—U.S. EIA reported 2023 average capacity factors ~34% for wind and ~23% for utility‑scale solar—so contracted volumes can still miss forecasts. Grid constraints and localized curtailment in high‑penetration regions have trimmed delivered energy and revenue, with some ISO curtailments reaching multi‑percent levels during oversupply events. Physical resource risk is hard to hedge financially, complicating forecasts, covenant compliance, and liquidity planning.
Interest rate sensitivity
As a yield-oriented vehicle, Clearway’s valuation and dividend coverage are sensitive to interest rates; with the Fed funds target at 5.25–5.50% (July 2025) and 10-year Treasuries near 4.2% in H1 2025, rising yields lift financing costs and compress equity multiples. Refinancing waves can cut CAFD if spreads or base rates widen, and higher rates push required hurdle returns above Clearway’s ~6% dividend yield, challenging new investment economics.
Merchant tail risk
Clearway flagged merchant tail risk in its 2024 disclosures: cash flows decline as PPAs expire and assets become exposed to wholesale market prices. Recontracting may occur at less favorable prices if supply exceeds demand, eroding merchant-value. Older units face steeper discounts absent repowering or storage, requiring planning and capex to mitigate tail erosion.
Leverage and structural complexity
Project-level non-recourse debt combined with holdco borrowings creates layered obligations for Clearway, where covenants, DSCR thresholds and cash traps can sharply limit liquidity and strategic flexibility under stress. Complex capital structures increase administrative costs and execution risk, and elevated leverage amplifies sensitivity to operational deviations such as lower production or merchant price drops.
- Layered obligations: project + holdco debt
- Covenants: DSCR thresholds, cash traps restrict flexibility
- Operational sensitivity: high leverage amplifies downside
- Higher administrative and execution risk from complexity
Counterparty concentration
Revenues depend on a limited number of utilities and corporate offtakers, making cash flow vulnerable to a few counterparties; credit downgrades or contractual disputes can directly pressure distributions. In distressed markets, renegotiations and contract amendments can force lower pricing or revenue deferrals. Geographic project clustering further concentrates regulatory and permitting risk in specific states or regions.
- Counterparty concentration: limited pool of utilities/corporates
- Credit risk: downgrades can hit distributions
- Renegotiation risk: distressed pricing pressure
- Geographic/regulatory clustering: localized exposure
Wind/solar 34%/23%, merchant risk & rates hit ~6% div
Clearway faces variable wind/solar output (2023 capacity factors: wind ~34%, solar ~23%), merchant tail risk as PPAs expire, and sensitivity to rates (Fed funds 5.25–5.50% Jul 2025; 10‑yr ~4.2% H1 2025) that pressures its ~6% dividend coverage. Layered project/holdco debt and counterparty concentration heighten liquidity and execution risk.
| Weakness | Key metric | Impact |
|---|---|---|
| Resource variability | Wind 34%, Solar 23% (2023) | Forecast/revenue risk |
| Rate sensitivity | Fed 5.25–5.50%, 10yr ~4.2% | Dividend/financing pressure |
| Capital structure | Project+holdco debt | Liquidity/covenant risk |
What You See Is What You Get
Clearway Energy SWOT Analysis
This is the actual SWOT analysis document you’ll receive upon purchase—no surprises, just professional quality. The preview below is taken directly from the full SWOT report you'll get; purchase unlocks the entire in‑depth, editable version. You’re viewing a live preview of the real file, and the complete document becomes available immediately after checkout.











