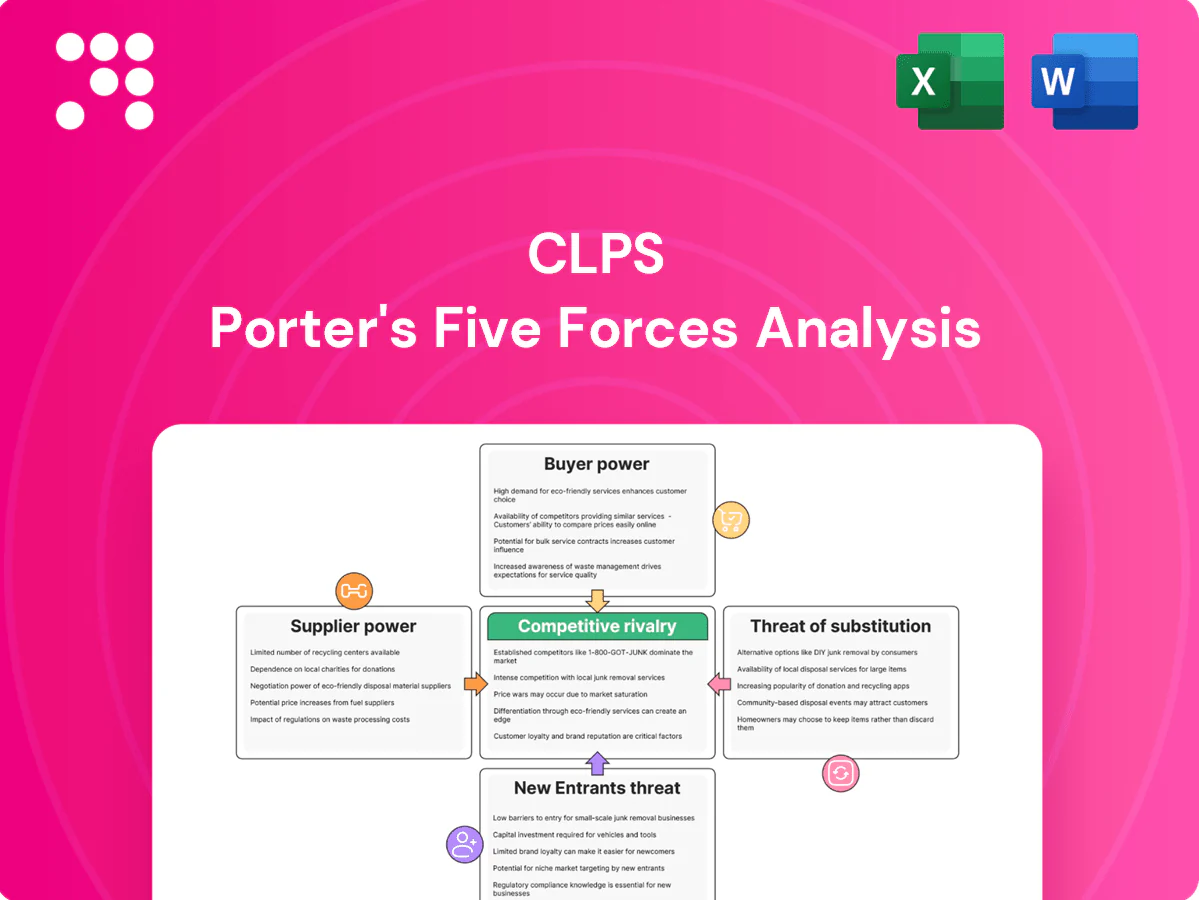
CLPS Porter's Five Forces Analysis

Go Beyond the Preview—Access the Full Strategic Report
CLPS faces moderate buyer power and rising competitive intensity as niche tech providers and scale challengers press margins. Supplier leverage and substitution risk hinge on rapid platform shifts, while barriers to entry remain mixed across segments. This brief snapshot only scratches the surface—unlock the full Porter's Five Forces Analysis to see force-by-force ratings, visuals, and strategic implications tailored to CLPS.
Suppliers Bargaining Power

Scarce fintech-skilled talent
CLPS depends on fintech engineers with deep banking, regulatory and testing expertise who remain in limited supply, giving senior talent and niche contractors leverage over rates and contract terms. In 2024 the market saw continued wage inflation and elevated retention bonuses that pressured margins for services firms. Robust training pipelines plus nearshore/offshore mixes mitigate but do not eliminate supplier power.
Dependence on cloud and tooling vendors
CLPS depends heavily on hyperscalers and test/dev tooling where licenses and consumption are essential inputs; AWS, Azure and GCP held roughly 32%, 23% and 11% market share respectively in 2024, concentrating supplier power. Price increases or bundling by these vendors can raise delivery costs or limit flexibility. Enterprise agreements and multi-vendor strategies reduce lock-in but require scale to be effective. Under fixed-bid contracts passing on higher cloud/tool costs is often infeasible.

Data and compliance content providers
Regulatory taxonomy, KYC/AML datasets and compliance utilities underpin CLPS offerings and are anchored in a RegTech market that reached about $16.8 billion in 2024; specialized providers (top vendors ~40% share) command premium pricing and strict usage terms. Changes in data access routinely force delivery delays of 4–12 weeks, while multi-year supplier partnerships stabilize pricing and availability.

Subcontractors and staffing partners
To flex capacity CLPS taps subcontractors and staffing partners for peaks and niche skills; in 2024 tight labor markets pushed contractor premiums as high as 25% on specialized roles, squeezing project margins and raising cost volatility.
Quality variability from third parties increases delivery risk and oversight cost, so CLPS leverages preferred‑vendor programs and volume commitments to secure rates, improve SLAs and temper suppliers' bargaining power.
- Peak sourcing: subcontractors for overflow
- Rate pressure: up to 25% premiums in 2024
- Risk: quality variability → higher oversight
- Mitigation: preferred vendors + volume deals
Knowledge concentration in key SMEs
Supplier squeeze: SME turnover 18–22%, contractor premiums 25%
CLPS faces high supplier leverage from scarce fintech SMEs, hyperscalers and RegTech vendors, driving wage inflation, contractor premiums and license concentration that squeeze margins. 2024 data: SME turnover 18–22%, contractor premiums up to 25%, RegTech market $16.8B, hyperscaler shares AWS 32% Azure 23% GCP 11%. Preferred‑vendor, multi‑vendor and nearshore mixes mitigate but do not remove risk.
| Metric | 2024 Value |
|---|---|
| SME turnover | 18–22% |
| Contractor premium | up to 25% |
| Ramp-up cost | +30–50% salary |
| Retention bonus | 10–25% |
| RegTech market | $16.8B |
| AWS/Azure/GCP share | 32% / 23% / 11% |
What is included in the product
 Detailed Word Document
Comprehensive Porter's Five Forces analysis tailored for CLPS, uncovering competitive rivalry, buyer and supplier power, threat of substitutes and new entrants, and highlighting disruptive trends and strategic levers to protect market share and improve profitability.

 Customizable Excel Spreadsheet
A concise one-sheet CLPS Porter's Five Forces tool visualizes competitive pressure with a radar chart and customizable inputs—no macros—so teams can quickly adapt scenarios, swap in their data, and drop-ready slides into pitch decks or reports.
Customers Bargaining Power

Concentrated global banks
Large global banks drive demand for CLPS services and run competitive RFPs, leveraging scale to push down pricing and demand strict service-level and compliance terms. Top 25 banks held roughly 50% of global banking assets in 2024, concentrating bargaining power and fueling vendor consolidation that pressures rates and rebates. Securing multi-year programs, however, offers CLPS multi-year revenue visibility and higher client stickiness.
High switching costs, but not prohibitive
Embedded knowledge and years of integration make immediate switching costly, often requiring phased migrations over 6–18 months. Banks keep vendor panels (2024 surveys show most large banks maintain multi-vendor panels) so scope can be reallocated gradually. Rigorous SLAs and annual security audits enforce accountability; renewals in 2024 depended more on delivery quality and domain depth than on price alone.

Price sensitivity in commoditized work
Application maintenance and testing are routinely benchmarked and rate-carded, and buyers routinely leverage nearshore/offshore comparisons to drive down unit rates. Outcome-based pricing and automation-linked discounts are commonly expected, compressing margins in commoditized layers. Providers must pursue measurable differentiation—vertical expertise, IP, or outcome guarantees—to defend margins beyond commodity pricing.

Insourcing and captive centers
- Insourcing increases buyer leverage
- Specialized skills and accelerators required
- Faster time-to-value is differentiator
- Co-sourcing aligns incentives, lowers churn
Stringent compliance and security demands
Buyers demand rigorous controls, certifications and auditability; failure risks rapid scope reduction or contract termination. Meeting these requirements raises delivery costs, making compliance a qualifier rather than a differentiator, though strong postures can still win tie-breaks. IBM 2024 reports average breach cost $4.45M, reinforcing buyer risk sensitivity.
- Buyers require certifications: SOC 2, ISO 27001
- Non-compliance => rapid scope cuts/termination
- Higher delivery cost; compliance = qualifier
- Strong compliance can decide close bids
Scale gives top banks pricing power; switching is costly, compliance often decides renewals
Large global banks (Top 25 held ~50% of assets in 2024) leverage scale to compress pricing and demand strict SLAs; switching is costly (phased migrations 6–18 months). Outcome-based pricing and nearshore comparisons squeeze margins; specialization, IP or co-sourcing preserve roles. Compliance is non-negotiable (IBM 2024 breach cost $4.45M), often deciding renewals.
| Metric | 2024 |
|---|---|
| Top 25 banks share | ~50% |
| Avg breach cost | $4.45M |
| Typical switch time | 6–18 months |
What You See Is What You Get
CLPS Porter's Five Forces Analysis
This preview shows the exact CLPS Porter's Five Forces Analysis you'll receive immediately after purchase—no placeholders or mockups. The document displayed here is the full, professionally formatted analysis ready for download and use the moment you buy. You're getting the final deliverable as shown, available instantly with no setup required.

Go Beyond the Preview—Access the Full Strategic Report
CLPS faces moderate buyer power and rising competitive intensity as niche tech providers and scale challengers press margins. Supplier leverage and substitution risk hinge on rapid platform shifts, while barriers to entry remain mixed across segments. This brief snapshot only scratches the surface—unlock the full Porter's Five Forces Analysis to see force-by-force ratings, visuals, and strategic implications tailored to CLPS.
Suppliers Bargaining Power
Scarce fintech-skilled talent
CLPS depends on fintech engineers with deep banking, regulatory and testing expertise who remain in limited supply, giving senior talent and niche contractors leverage over rates and contract terms. In 2024 the market saw continued wage inflation and elevated retention bonuses that pressured margins for services firms. Robust training pipelines plus nearshore/offshore mixes mitigate but do not eliminate supplier power.
Dependence on cloud and tooling vendors
CLPS depends heavily on hyperscalers and test/dev tooling where licenses and consumption are essential inputs; AWS, Azure and GCP held roughly 32%, 23% and 11% market share respectively in 2024, concentrating supplier power. Price increases or bundling by these vendors can raise delivery costs or limit flexibility. Enterprise agreements and multi-vendor strategies reduce lock-in but require scale to be effective. Under fixed-bid contracts passing on higher cloud/tool costs is often infeasible.
Data and compliance content providers
Regulatory taxonomy, KYC/AML datasets and compliance utilities underpin CLPS offerings and are anchored in a RegTech market that reached about $16.8 billion in 2024; specialized providers (top vendors ~40% share) command premium pricing and strict usage terms. Changes in data access routinely force delivery delays of 4–12 weeks, while multi-year supplier partnerships stabilize pricing and availability.
Subcontractors and staffing partners
To flex capacity CLPS taps subcontractors and staffing partners for peaks and niche skills; in 2024 tight labor markets pushed contractor premiums as high as 25% on specialized roles, squeezing project margins and raising cost volatility.
Quality variability from third parties increases delivery risk and oversight cost, so CLPS leverages preferred‑vendor programs and volume commitments to secure rates, improve SLAs and temper suppliers' bargaining power.
- Peak sourcing: subcontractors for overflow
- Rate pressure: up to 25% premiums in 2024
- Risk: quality variability → higher oversight
- Mitigation: preferred vendors + volume deals
Knowledge concentration in key SMEs
Supplier squeeze: SME turnover 18–22%, contractor premiums 25%
CLPS faces high supplier leverage from scarce fintech SMEs, hyperscalers and RegTech vendors, driving wage inflation, contractor premiums and license concentration that squeeze margins. 2024 data: SME turnover 18–22%, contractor premiums up to 25%, RegTech market $16.8B, hyperscaler shares AWS 32% Azure 23% GCP 11%. Preferred‑vendor, multi‑vendor and nearshore mixes mitigate but do not remove risk.
| Metric | 2024 Value |
|---|---|
| SME turnover | 18–22% |
| Contractor premium | up to 25% |
| Ramp-up cost | +30–50% salary |
| Retention bonus | 10–25% |
| RegTech market | $16.8B |
| AWS/Azure/GCP share | 32% / 23% / 11% |
What is included in the product
Detailed Word Document
Comprehensive Porter's Five Forces analysis tailored for CLPS, uncovering competitive rivalry, buyer and supplier power, threat of substitutes and new entrants, and highlighting disruptive trends and strategic levers to protect market share and improve profitability.
Customizable Excel Spreadsheet
A concise one-sheet CLPS Porter's Five Forces tool visualizes competitive pressure with a radar chart and customizable inputs—no macros—so teams can quickly adapt scenarios, swap in their data, and drop-ready slides into pitch decks or reports.
Customers Bargaining Power
Concentrated global banks
Large global banks drive demand for CLPS services and run competitive RFPs, leveraging scale to push down pricing and demand strict service-level and compliance terms. Top 25 banks held roughly 50% of global banking assets in 2024, concentrating bargaining power and fueling vendor consolidation that pressures rates and rebates. Securing multi-year programs, however, offers CLPS multi-year revenue visibility and higher client stickiness.
High switching costs, but not prohibitive
Embedded knowledge and years of integration make immediate switching costly, often requiring phased migrations over 6–18 months. Banks keep vendor panels (2024 surveys show most large banks maintain multi-vendor panels) so scope can be reallocated gradually. Rigorous SLAs and annual security audits enforce accountability; renewals in 2024 depended more on delivery quality and domain depth than on price alone.
Price sensitivity in commoditized work
Application maintenance and testing are routinely benchmarked and rate-carded, and buyers routinely leverage nearshore/offshore comparisons to drive down unit rates. Outcome-based pricing and automation-linked discounts are commonly expected, compressing margins in commoditized layers. Providers must pursue measurable differentiation—vertical expertise, IP, or outcome guarantees—to defend margins beyond commodity pricing.
Insourcing and captive centers
- Insourcing increases buyer leverage
- Specialized skills and accelerators required
- Faster time-to-value is differentiator
- Co-sourcing aligns incentives, lowers churn
Stringent compliance and security demands
Buyers demand rigorous controls, certifications and auditability; failure risks rapid scope reduction or contract termination. Meeting these requirements raises delivery costs, making compliance a qualifier rather than a differentiator, though strong postures can still win tie-breaks. IBM 2024 reports average breach cost $4.45M, reinforcing buyer risk sensitivity.
- Buyers require certifications: SOC 2, ISO 27001
- Non-compliance => rapid scope cuts/termination
- Higher delivery cost; compliance = qualifier
- Strong compliance can decide close bids
Scale gives top banks pricing power; switching is costly, compliance often decides renewals
Large global banks (Top 25 held ~50% of assets in 2024) leverage scale to compress pricing and demand strict SLAs; switching is costly (phased migrations 6–18 months). Outcome-based pricing and nearshore comparisons squeeze margins; specialization, IP or co-sourcing preserve roles. Compliance is non-negotiable (IBM 2024 breach cost $4.45M), often deciding renewals.
| Metric | 2024 |
|---|---|
| Top 25 banks share | ~50% |
| Avg breach cost | $4.45M |
| Typical switch time | 6–18 months |
What You See Is What You Get
CLPS Porter's Five Forces Analysis
This preview shows the exact CLPS Porter's Five Forces Analysis you'll receive immediately after purchase—no placeholders or mockups. The document displayed here is the full, professionally formatted analysis ready for download and use the moment you buy. You're getting the final deliverable as shown, available instantly with no setup required.
Description
Go Beyond the Preview—Access the Full Strategic Report
CLPS faces moderate buyer power and rising competitive intensity as niche tech providers and scale challengers press margins. Supplier leverage and substitution risk hinge on rapid platform shifts, while barriers to entry remain mixed across segments. This brief snapshot only scratches the surface—unlock the full Porter's Five Forces Analysis to see force-by-force ratings, visuals, and strategic implications tailored to CLPS.
Suppliers Bargaining Power
Scarce fintech-skilled talent
CLPS depends on fintech engineers with deep banking, regulatory and testing expertise who remain in limited supply, giving senior talent and niche contractors leverage over rates and contract terms. In 2024 the market saw continued wage inflation and elevated retention bonuses that pressured margins for services firms. Robust training pipelines plus nearshore/offshore mixes mitigate but do not eliminate supplier power.
Dependence on cloud and tooling vendors
CLPS depends heavily on hyperscalers and test/dev tooling where licenses and consumption are essential inputs; AWS, Azure and GCP held roughly 32%, 23% and 11% market share respectively in 2024, concentrating supplier power. Price increases or bundling by these vendors can raise delivery costs or limit flexibility. Enterprise agreements and multi-vendor strategies reduce lock-in but require scale to be effective. Under fixed-bid contracts passing on higher cloud/tool costs is often infeasible.
Data and compliance content providers
Regulatory taxonomy, KYC/AML datasets and compliance utilities underpin CLPS offerings and are anchored in a RegTech market that reached about $16.8 billion in 2024; specialized providers (top vendors ~40% share) command premium pricing and strict usage terms. Changes in data access routinely force delivery delays of 4–12 weeks, while multi-year supplier partnerships stabilize pricing and availability.
Subcontractors and staffing partners
To flex capacity CLPS taps subcontractors and staffing partners for peaks and niche skills; in 2024 tight labor markets pushed contractor premiums as high as 25% on specialized roles, squeezing project margins and raising cost volatility.
Quality variability from third parties increases delivery risk and oversight cost, so CLPS leverages preferred‑vendor programs and volume commitments to secure rates, improve SLAs and temper suppliers' bargaining power.
- Peak sourcing: subcontractors for overflow
- Rate pressure: up to 25% premiums in 2024
- Risk: quality variability → higher oversight
- Mitigation: preferred vendors + volume deals
Knowledge concentration in key SMEs
Supplier squeeze: SME turnover 18–22%, contractor premiums 25%
CLPS faces high supplier leverage from scarce fintech SMEs, hyperscalers and RegTech vendors, driving wage inflation, contractor premiums and license concentration that squeeze margins. 2024 data: SME turnover 18–22%, contractor premiums up to 25%, RegTech market $16.8B, hyperscaler shares AWS 32% Azure 23% GCP 11%. Preferred‑vendor, multi‑vendor and nearshore mixes mitigate but do not remove risk.
| Metric | 2024 Value |
|---|---|
| SME turnover | 18–22% |
| Contractor premium | up to 25% |
| Ramp-up cost | +30–50% salary |
| Retention bonus | 10–25% |
| RegTech market | $16.8B |
| AWS/Azure/GCP share | 32% / 23% / 11% |
What is included in the product
Detailed Word Document
Comprehensive Porter's Five Forces analysis tailored for CLPS, uncovering competitive rivalry, buyer and supplier power, threat of substitutes and new entrants, and highlighting disruptive trends and strategic levers to protect market share and improve profitability.
Customizable Excel Spreadsheet
A concise one-sheet CLPS Porter's Five Forces tool visualizes competitive pressure with a radar chart and customizable inputs—no macros—so teams can quickly adapt scenarios, swap in their data, and drop-ready slides into pitch decks or reports.
Customers Bargaining Power
Concentrated global banks
Large global banks drive demand for CLPS services and run competitive RFPs, leveraging scale to push down pricing and demand strict service-level and compliance terms. Top 25 banks held roughly 50% of global banking assets in 2024, concentrating bargaining power and fueling vendor consolidation that pressures rates and rebates. Securing multi-year programs, however, offers CLPS multi-year revenue visibility and higher client stickiness.
High switching costs, but not prohibitive
Embedded knowledge and years of integration make immediate switching costly, often requiring phased migrations over 6–18 months. Banks keep vendor panels (2024 surveys show most large banks maintain multi-vendor panels) so scope can be reallocated gradually. Rigorous SLAs and annual security audits enforce accountability; renewals in 2024 depended more on delivery quality and domain depth than on price alone.
Price sensitivity in commoditized work
Application maintenance and testing are routinely benchmarked and rate-carded, and buyers routinely leverage nearshore/offshore comparisons to drive down unit rates. Outcome-based pricing and automation-linked discounts are commonly expected, compressing margins in commoditized layers. Providers must pursue measurable differentiation—vertical expertise, IP, or outcome guarantees—to defend margins beyond commodity pricing.
Insourcing and captive centers
- Insourcing increases buyer leverage
- Specialized skills and accelerators required
- Faster time-to-value is differentiator
- Co-sourcing aligns incentives, lowers churn
Stringent compliance and security demands
Buyers demand rigorous controls, certifications and auditability; failure risks rapid scope reduction or contract termination. Meeting these requirements raises delivery costs, making compliance a qualifier rather than a differentiator, though strong postures can still win tie-breaks. IBM 2024 reports average breach cost $4.45M, reinforcing buyer risk sensitivity.
- Buyers require certifications: SOC 2, ISO 27001
- Non-compliance => rapid scope cuts/termination
- Higher delivery cost; compliance = qualifier
- Strong compliance can decide close bids
Scale gives top banks pricing power; switching is costly, compliance often decides renewals
Large global banks (Top 25 held ~50% of assets in 2024) leverage scale to compress pricing and demand strict SLAs; switching is costly (phased migrations 6–18 months). Outcome-based pricing and nearshore comparisons squeeze margins; specialization, IP or co-sourcing preserve roles. Compliance is non-negotiable (IBM 2024 breach cost $4.45M), often deciding renewals.
| Metric | 2024 |
|---|---|
| Top 25 banks share | ~50% |
| Avg breach cost | $4.45M |
| Typical switch time | 6–18 months |
What You See Is What You Get
CLPS Porter's Five Forces Analysis
This preview shows the exact CLPS Porter's Five Forces Analysis you'll receive immediately after purchase—no placeholders or mockups. The document displayed here is the full, professionally formatted analysis ready for download and use the moment you buy. You're getting the final deliverable as shown, available instantly with no setup required.











