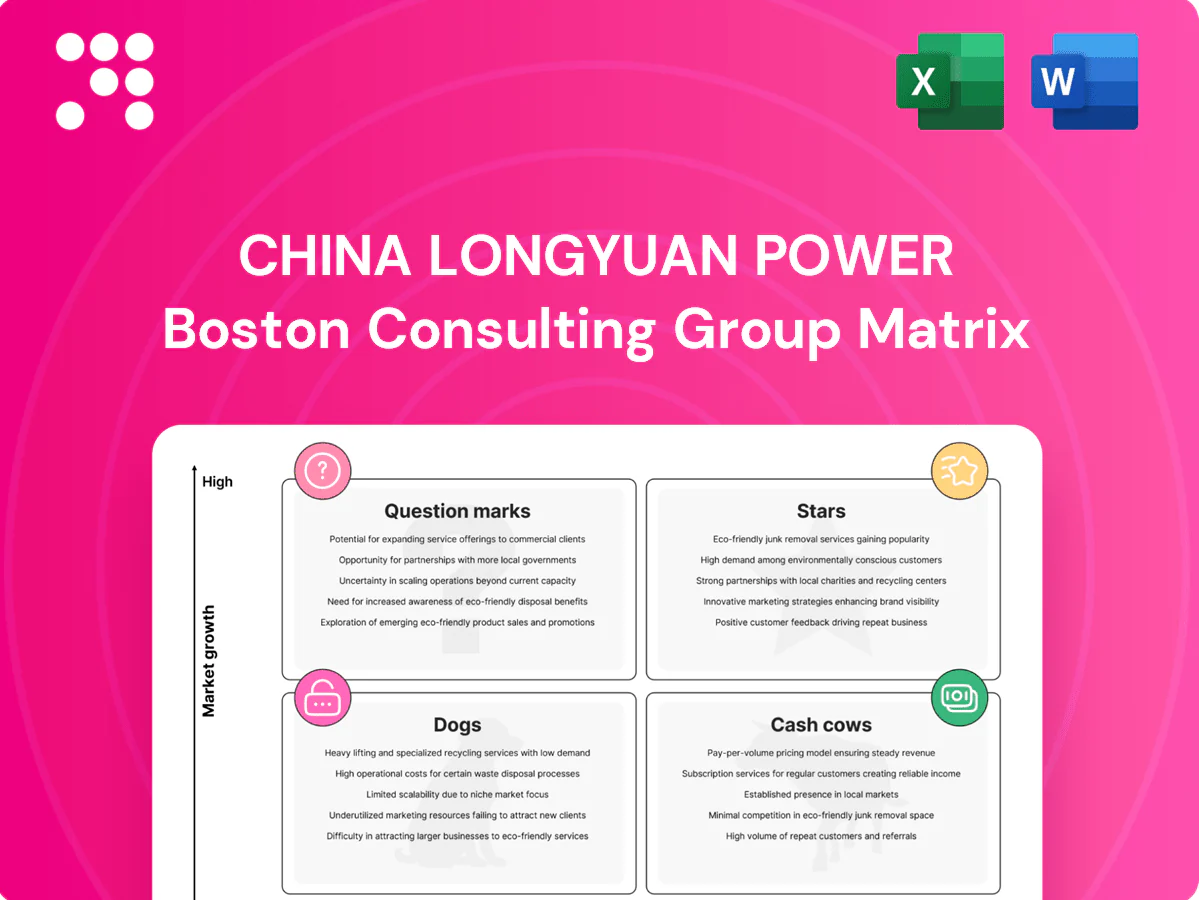
China Longyuan Power Boston Consulting Group Matrix

Unlock Strategic Clarity
China Longyuan Power’s BCG Matrix preview shows where key units sit amid shifting demand and policy — but it’s just a snapshot. Buy the full BCG Matrix for a quadrant-by-quadrant breakdown, clear recommendations, and editable Word + Excel deliverables that let you act fast. Skip the guesswork: get the data-driven roadmap to optimize investments, trim underperformers, and scale the winners.
Stars

China onshore wind fleet leadership
China Longyuan commands a onshore fleet of over 24 GW (2024) with a development pipeline exceeding 15 GW and benefits from strong policy tailwinds under China’s 2030/2060 targets; leading market shares in Inner Mongolia, Xinjiang and Hebei compound siting and procurement advantages. The business is capital intensive—significant cash burn for new builds and repowering—but returns have tracked growth, making continued reinvestment the company’s engine.
Offshore wind build‑out in coastal hubs
China’s offshore wind is a fast-growing arena where Longyuan already holds meaningful positions, participating in multiple coastal hubs as China pushed offshore capacity toward roughly 30 GW by end‑2023 and targets accelerating in 2024–25. Barriers to entry are high—marine engineering, grid access and complex supply‑chain coordination—driving scale advantages for incumbents. It is capital hungry now, but winning sites today become annuities tomorrow. Invest to cement leadership before the window narrows.

Wind O&M and lifecycle services
China Longyuan’s proprietary ops platform and predictive‑maintenance stack scale with each new turbine, leveraging fleet‑wide analytics across ≈30 GW installed wind capacity (2024) to strengthen a growing data moat. High market share in core onshore wind plus these analytics create a durable competitive edge. Growth is brisk as aging turbines and tighter availability targets (~97%) drive aftermarket demand. Digital and spares investment typically returns via 1–3 p.p. uptime gains and payback in 18–24 months.

Blade manufacturing tied to captive demand
Vertical integration in blade manufacturing gives China Longyuan Power cost, schedule and design control across a still‑expanding wind market; Longyuan, the largest Chinese wind operator with over 20 GW installed capacity, soaks much of its blade capacity while selling surplus to boost margins. Cash out for factory ramps equals cash in from project builds over cycles, effectively locking in project IRRs; continue innovating longer, lighter blades to preserve competitive edge.
- Integrated supply reduces per‑MW blade cost
- Internal demand absorbs majority of output
- External sales improve gross margins
- Factory CAPEX matched by project cashflows
- R&D on lighter/longer blades critical
Grid‑parity wind projects with guaranteed offtake
Newer sites are reaching grid parity aided by policy support and rising corporate PPA demand; Longyuan >20 GW installed capacity (2024) gives it scale to capture auctions and strong market growth. Projects need higher upfront capex and grid coordination but yields stabilize within 2–3 years after COD. Prioritize interconnection‑ready zones to compound market share.
- Star: grid‑parity with guaranteed offtake
- Fact: Longyuan >20 GW (2024)
- Action: focus on interconnection‑ready zones
Wind leader: >24 GW onshore, >15 GW pipeline, ≈30 GW fleet, ≈97% uptime
China Longyuan is a Star: >24 GW onshore (2024) with >15 GW pipeline, backed by 2030/2060 policy support. Offshore scale and high entry barriers create durable annuity potential. Fleet analytics across ≈30 GW (2024) plus blade integration raise margins and uptime (~97%), validating continued reinvestment.
| Metric | 2024 value | Note |
|---|---|---|
| Onshore capacity | >24 GW | Core market share |
| Pipeline | >15 GW | Near‑term builds |
| Total fleet | ≈30 GW | Analytics scale |
| Uptime | ≈97% | Aftermarket gains |
What is included in the product
 Detailed Word Document
Comprehensive BCG Matrix for China Longyuan Power — identifies Stars, Cash Cows, Question Marks, Dogs with investment, hold, divest guidance.

 Customizable Excel Spreadsheet
One-page BCG matrix for China Longyuan Power — clear quadrant view to resolve portfolio confusion and speed exec decisions
Cash Cows

Legacy onshore wind farms in mature regions
Legacy onshore wind farms in mature provinces deliver steady cash as older, largely depreciated assets underpin predictability; China Longyuan, the largest Chinese wind operator (0916.HK), reported installed capacity above 30 GW by 2024. O&M costs and curtailment have fallen, financing spreads near historic lows, so minimal marketing is needed—focus on high availability. Milk operations while selectively repowering units to eke out 5–15% output gains.
Coal‑adjacent grid services and balancing
Conventional coal-adjacent units deliver stable dispatch and balancing fees in China’s mature market, with coal supplying about 60% of electricity generation in 2023, underpinning entrenched plant-level market share. Modest ongoing capex and predictable operating cash flow support renewables investment and debt service for Longyuan. Operate lean and avoid growth capex to preserve cash cow margins.

Corporate PPAs with blue‑chip customers
Corporate PPAs with blue-chip customers deliver multi-year contracted offtake that preserves predictable margins with limited incremental capex or growth demand. Longyuan, with ~28 GW of installed wind capacity (end-2023), leverages scale to negotiate favourable terms and maintains low delivery risk. These deals are admin-light, cash-heavy and serve as stable cash flow to backstop new builds and smooth earnings volatility.

Transmission and interconnection rights banked
Transmission and interconnection rights banked secure near-permanent grid access in mature nodes, creating hard-to-replicate value for China Longyuan; with ~22.9 GW installed wind capacity (end‑2023) and node utilization typically 30–35% in resource-rich sites (2024), growth is low but utilization and cash generation remain high.
- Low growth, high yield
- Sunk capex, ongoing returns
- Utilization ~30–35% (2024)
- Optimize dispatch/congestion to lift cash-per-MW
Spare parts and refurbishment for in‑fleet models
Spare parts and refurbishment for in‑fleet models supply a captive legacy base, delivering steady revenue as China’s wind fleet aged in 2024; aftermarket gross margins benchmark around 25% while top-line growth is constrained by slow fleet replacement. Inventory tuning drives working‑capital efficiency and predictable cash conversion; strict SKU discipline and tight service SLAs protect margins and uptime.
- Captive demand: stable revenue stream
- Margins: ~25% aftermarket gross margin (2024 benchmark)
- Growth: limited by fleet replacement rates
- Ops focus: SKU discipline, service SLA adherence
Legacy onshore wind: predictable high-margin cash, low capex, selective 5–15% repower uplift
Legacy onshore wind (≈30.5 GW installed 2024) and banked grid rights generate steady, high-margin cash with utilization ~30–35% and low incremental capex; O&M and curtailment improved, supporting predictable FCF. Corporate PPAs and captive aftermarket (~25% gross margin 2024) further stabilize cashflow. Avoid growth capex; prioritize availability and selective repowering (5–15% yield uplift).
| Metric | 2024 |
|---|---|
| Installed capacity | 30.5 GW |
| Utilization | 30–35% |
| Aftermarket GM | ~25% |
| Repower uplift | 5–15% |
What You’re Viewing Is Included
China Longyuan Power BCG Matrix
The file you're previewing is the final China Longyuan Power BCG Matrix you'll receive after purchase. No watermarks or demo notes—just a polished, fully formatted strategic report ready for immediate use. It reflects market-backed analysis and clear visuals so you can present, edit, or print without changes. Buy once, download instantly, and plug it straight into your planning or investor decks.

Unlock Strategic Clarity
China Longyuan Power’s BCG Matrix preview shows where key units sit amid shifting demand and policy — but it’s just a snapshot. Buy the full BCG Matrix for a quadrant-by-quadrant breakdown, clear recommendations, and editable Word + Excel deliverables that let you act fast. Skip the guesswork: get the data-driven roadmap to optimize investments, trim underperformers, and scale the winners.
Stars
China onshore wind fleet leadership
China Longyuan commands a onshore fleet of over 24 GW (2024) with a development pipeline exceeding 15 GW and benefits from strong policy tailwinds under China’s 2030/2060 targets; leading market shares in Inner Mongolia, Xinjiang and Hebei compound siting and procurement advantages. The business is capital intensive—significant cash burn for new builds and repowering—but returns have tracked growth, making continued reinvestment the company’s engine.
Offshore wind build‑out in coastal hubs
China’s offshore wind is a fast-growing arena where Longyuan already holds meaningful positions, participating in multiple coastal hubs as China pushed offshore capacity toward roughly 30 GW by end‑2023 and targets accelerating in 2024–25. Barriers to entry are high—marine engineering, grid access and complex supply‑chain coordination—driving scale advantages for incumbents. It is capital hungry now, but winning sites today become annuities tomorrow. Invest to cement leadership before the window narrows.
Wind O&M and lifecycle services
China Longyuan’s proprietary ops platform and predictive‑maintenance stack scale with each new turbine, leveraging fleet‑wide analytics across ≈30 GW installed wind capacity (2024) to strengthen a growing data moat. High market share in core onshore wind plus these analytics create a durable competitive edge. Growth is brisk as aging turbines and tighter availability targets (~97%) drive aftermarket demand. Digital and spares investment typically returns via 1–3 p.p. uptime gains and payback in 18–24 months.
Blade manufacturing tied to captive demand
Vertical integration in blade manufacturing gives China Longyuan Power cost, schedule and design control across a still‑expanding wind market; Longyuan, the largest Chinese wind operator with over 20 GW installed capacity, soaks much of its blade capacity while selling surplus to boost margins. Cash out for factory ramps equals cash in from project builds over cycles, effectively locking in project IRRs; continue innovating longer, lighter blades to preserve competitive edge.
- Integrated supply reduces per‑MW blade cost
- Internal demand absorbs majority of output
- External sales improve gross margins
- Factory CAPEX matched by project cashflows
- R&D on lighter/longer blades critical
Grid‑parity wind projects with guaranteed offtake
Newer sites are reaching grid parity aided by policy support and rising corporate PPA demand; Longyuan >20 GW installed capacity (2024) gives it scale to capture auctions and strong market growth. Projects need higher upfront capex and grid coordination but yields stabilize within 2–3 years after COD. Prioritize interconnection‑ready zones to compound market share.
- Star: grid‑parity with guaranteed offtake
- Fact: Longyuan >20 GW (2024)
- Action: focus on interconnection‑ready zones
Wind leader: >24 GW onshore, >15 GW pipeline, ≈30 GW fleet, ≈97% uptime
China Longyuan is a Star: >24 GW onshore (2024) with >15 GW pipeline, backed by 2030/2060 policy support. Offshore scale and high entry barriers create durable annuity potential. Fleet analytics across ≈30 GW (2024) plus blade integration raise margins and uptime (~97%), validating continued reinvestment.
| Metric | 2024 value | Note |
|---|---|---|
| Onshore capacity | >24 GW | Core market share |
| Pipeline | >15 GW | Near‑term builds |
| Total fleet | ≈30 GW | Analytics scale |
| Uptime | ≈97% | Aftermarket gains |
What is included in the product
Detailed Word Document
Comprehensive BCG Matrix for China Longyuan Power — identifies Stars, Cash Cows, Question Marks, Dogs with investment, hold, divest guidance.
Customizable Excel Spreadsheet
One-page BCG matrix for China Longyuan Power — clear quadrant view to resolve portfolio confusion and speed exec decisions
Cash Cows
Legacy onshore wind farms in mature regions
Legacy onshore wind farms in mature provinces deliver steady cash as older, largely depreciated assets underpin predictability; China Longyuan, the largest Chinese wind operator (0916.HK), reported installed capacity above 30 GW by 2024. O&M costs and curtailment have fallen, financing spreads near historic lows, so minimal marketing is needed—focus on high availability. Milk operations while selectively repowering units to eke out 5–15% output gains.
Coal‑adjacent grid services and balancing
Conventional coal-adjacent units deliver stable dispatch and balancing fees in China’s mature market, with coal supplying about 60% of electricity generation in 2023, underpinning entrenched plant-level market share. Modest ongoing capex and predictable operating cash flow support renewables investment and debt service for Longyuan. Operate lean and avoid growth capex to preserve cash cow margins.
Corporate PPAs with blue‑chip customers
Corporate PPAs with blue-chip customers deliver multi-year contracted offtake that preserves predictable margins with limited incremental capex or growth demand. Longyuan, with ~28 GW of installed wind capacity (end-2023), leverages scale to negotiate favourable terms and maintains low delivery risk. These deals are admin-light, cash-heavy and serve as stable cash flow to backstop new builds and smooth earnings volatility.
Transmission and interconnection rights banked
Transmission and interconnection rights banked secure near-permanent grid access in mature nodes, creating hard-to-replicate value for China Longyuan; with ~22.9 GW installed wind capacity (end‑2023) and node utilization typically 30–35% in resource-rich sites (2024), growth is low but utilization and cash generation remain high.
- Low growth, high yield
- Sunk capex, ongoing returns
- Utilization ~30–35% (2024)
- Optimize dispatch/congestion to lift cash-per-MW
Spare parts and refurbishment for in‑fleet models
Spare parts and refurbishment for in‑fleet models supply a captive legacy base, delivering steady revenue as China’s wind fleet aged in 2024; aftermarket gross margins benchmark around 25% while top-line growth is constrained by slow fleet replacement. Inventory tuning drives working‑capital efficiency and predictable cash conversion; strict SKU discipline and tight service SLAs protect margins and uptime.
- Captive demand: stable revenue stream
- Margins: ~25% aftermarket gross margin (2024 benchmark)
- Growth: limited by fleet replacement rates
- Ops focus: SKU discipline, service SLA adherence
Legacy onshore wind: predictable high-margin cash, low capex, selective 5–15% repower uplift
Legacy onshore wind (≈30.5 GW installed 2024) and banked grid rights generate steady, high-margin cash with utilization ~30–35% and low incremental capex; O&M and curtailment improved, supporting predictable FCF. Corporate PPAs and captive aftermarket (~25% gross margin 2024) further stabilize cashflow. Avoid growth capex; prioritize availability and selective repowering (5–15% yield uplift).
| Metric | 2024 |
|---|---|
| Installed capacity | 30.5 GW |
| Utilization | 30–35% |
| Aftermarket GM | ~25% |
| Repower uplift | 5–15% |
What You’re Viewing Is Included
China Longyuan Power BCG Matrix
The file you're previewing is the final China Longyuan Power BCG Matrix you'll receive after purchase. No watermarks or demo notes—just a polished, fully formatted strategic report ready for immediate use. It reflects market-backed analysis and clear visuals so you can present, edit, or print without changes. Buy once, download instantly, and plug it straight into your planning or investor decks.
Original: $10.00
-65%$10.00
$3.50Description
Unlock Strategic Clarity
China Longyuan Power’s BCG Matrix preview shows where key units sit amid shifting demand and policy — but it’s just a snapshot. Buy the full BCG Matrix for a quadrant-by-quadrant breakdown, clear recommendations, and editable Word + Excel deliverables that let you act fast. Skip the guesswork: get the data-driven roadmap to optimize investments, trim underperformers, and scale the winners.
Stars
China onshore wind fleet leadership
China Longyuan commands a onshore fleet of over 24 GW (2024) with a development pipeline exceeding 15 GW and benefits from strong policy tailwinds under China’s 2030/2060 targets; leading market shares in Inner Mongolia, Xinjiang and Hebei compound siting and procurement advantages. The business is capital intensive—significant cash burn for new builds and repowering—but returns have tracked growth, making continued reinvestment the company’s engine.
Offshore wind build‑out in coastal hubs
China’s offshore wind is a fast-growing arena where Longyuan already holds meaningful positions, participating in multiple coastal hubs as China pushed offshore capacity toward roughly 30 GW by end‑2023 and targets accelerating in 2024–25. Barriers to entry are high—marine engineering, grid access and complex supply‑chain coordination—driving scale advantages for incumbents. It is capital hungry now, but winning sites today become annuities tomorrow. Invest to cement leadership before the window narrows.
Wind O&M and lifecycle services
China Longyuan’s proprietary ops platform and predictive‑maintenance stack scale with each new turbine, leveraging fleet‑wide analytics across ≈30 GW installed wind capacity (2024) to strengthen a growing data moat. High market share in core onshore wind plus these analytics create a durable competitive edge. Growth is brisk as aging turbines and tighter availability targets (~97%) drive aftermarket demand. Digital and spares investment typically returns via 1–3 p.p. uptime gains and payback in 18–24 months.
Blade manufacturing tied to captive demand
Vertical integration in blade manufacturing gives China Longyuan Power cost, schedule and design control across a still‑expanding wind market; Longyuan, the largest Chinese wind operator with over 20 GW installed capacity, soaks much of its blade capacity while selling surplus to boost margins. Cash out for factory ramps equals cash in from project builds over cycles, effectively locking in project IRRs; continue innovating longer, lighter blades to preserve competitive edge.
- Integrated supply reduces per‑MW blade cost
- Internal demand absorbs majority of output
- External sales improve gross margins
- Factory CAPEX matched by project cashflows
- R&D on lighter/longer blades critical
Grid‑parity wind projects with guaranteed offtake
Newer sites are reaching grid parity aided by policy support and rising corporate PPA demand; Longyuan >20 GW installed capacity (2024) gives it scale to capture auctions and strong market growth. Projects need higher upfront capex and grid coordination but yields stabilize within 2–3 years after COD. Prioritize interconnection‑ready zones to compound market share.
- Star: grid‑parity with guaranteed offtake
- Fact: Longyuan >20 GW (2024)
- Action: focus on interconnection‑ready zones
Wind leader: >24 GW onshore, >15 GW pipeline, ≈30 GW fleet, ≈97% uptime
China Longyuan is a Star: >24 GW onshore (2024) with >15 GW pipeline, backed by 2030/2060 policy support. Offshore scale and high entry barriers create durable annuity potential. Fleet analytics across ≈30 GW (2024) plus blade integration raise margins and uptime (~97%), validating continued reinvestment.
| Metric | 2024 value | Note |
|---|---|---|
| Onshore capacity | >24 GW | Core market share |
| Pipeline | >15 GW | Near‑term builds |
| Total fleet | ≈30 GW | Analytics scale |
| Uptime | ≈97% | Aftermarket gains |
What is included in the product
Detailed Word Document
Comprehensive BCG Matrix for China Longyuan Power — identifies Stars, Cash Cows, Question Marks, Dogs with investment, hold, divest guidance.
Customizable Excel Spreadsheet
One-page BCG matrix for China Longyuan Power — clear quadrant view to resolve portfolio confusion and speed exec decisions
Cash Cows
Legacy onshore wind farms in mature regions
Legacy onshore wind farms in mature provinces deliver steady cash as older, largely depreciated assets underpin predictability; China Longyuan, the largest Chinese wind operator (0916.HK), reported installed capacity above 30 GW by 2024. O&M costs and curtailment have fallen, financing spreads near historic lows, so minimal marketing is needed—focus on high availability. Milk operations while selectively repowering units to eke out 5–15% output gains.
Coal‑adjacent grid services and balancing
Conventional coal-adjacent units deliver stable dispatch and balancing fees in China’s mature market, with coal supplying about 60% of electricity generation in 2023, underpinning entrenched plant-level market share. Modest ongoing capex and predictable operating cash flow support renewables investment and debt service for Longyuan. Operate lean and avoid growth capex to preserve cash cow margins.
Corporate PPAs with blue‑chip customers
Corporate PPAs with blue-chip customers deliver multi-year contracted offtake that preserves predictable margins with limited incremental capex or growth demand. Longyuan, with ~28 GW of installed wind capacity (end-2023), leverages scale to negotiate favourable terms and maintains low delivery risk. These deals are admin-light, cash-heavy and serve as stable cash flow to backstop new builds and smooth earnings volatility.
Transmission and interconnection rights banked
Transmission and interconnection rights banked secure near-permanent grid access in mature nodes, creating hard-to-replicate value for China Longyuan; with ~22.9 GW installed wind capacity (end‑2023) and node utilization typically 30–35% in resource-rich sites (2024), growth is low but utilization and cash generation remain high.
- Low growth, high yield
- Sunk capex, ongoing returns
- Utilization ~30–35% (2024)
- Optimize dispatch/congestion to lift cash-per-MW
Spare parts and refurbishment for in‑fleet models
Spare parts and refurbishment for in‑fleet models supply a captive legacy base, delivering steady revenue as China’s wind fleet aged in 2024; aftermarket gross margins benchmark around 25% while top-line growth is constrained by slow fleet replacement. Inventory tuning drives working‑capital efficiency and predictable cash conversion; strict SKU discipline and tight service SLAs protect margins and uptime.
- Captive demand: stable revenue stream
- Margins: ~25% aftermarket gross margin (2024 benchmark)
- Growth: limited by fleet replacement rates
- Ops focus: SKU discipline, service SLA adherence
Legacy onshore wind: predictable high-margin cash, low capex, selective 5–15% repower uplift
Legacy onshore wind (≈30.5 GW installed 2024) and banked grid rights generate steady, high-margin cash with utilization ~30–35% and low incremental capex; O&M and curtailment improved, supporting predictable FCF. Corporate PPAs and captive aftermarket (~25% gross margin 2024) further stabilize cashflow. Avoid growth capex; prioritize availability and selective repowering (5–15% yield uplift).
| Metric | 2024 |
|---|---|
| Installed capacity | 30.5 GW |
| Utilization | 30–35% |
| Aftermarket GM | ~25% |
| Repower uplift | 5–15% |
What You’re Viewing Is Included
China Longyuan Power BCG Matrix
The file you're previewing is the final China Longyuan Power BCG Matrix you'll receive after purchase. No watermarks or demo notes—just a polished, fully formatted strategic report ready for immediate use. It reflects market-backed analysis and clear visuals so you can present, edit, or print without changes. Buy once, download instantly, and plug it straight into your planning or investor decks.











