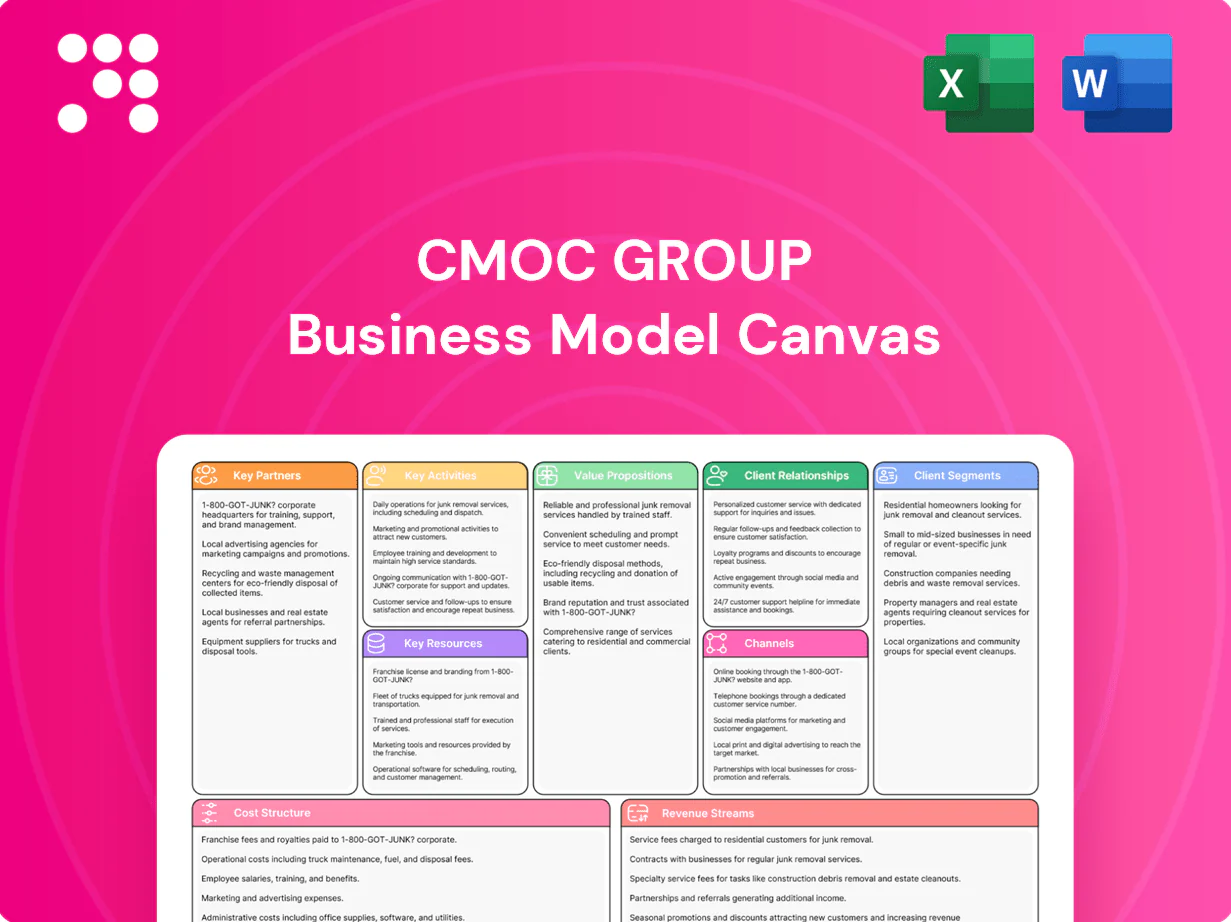
CMOC Group Business Model Canvas

Business Model Canvas for Major Copper-Cobalt Miner: Key Partners, Revenues, Cost Drivers
Explore CMOC Group’s Business Model Canvas to uncover how the miner captures value across supply chains, customer segments, and commodity cycles; this concise snapshot highlights key partners, revenue streams, and cost drivers. Purchase the full Canvas for a section-by-section, editable Word/Excel analysis—ideal for investors, strategists, and analysts seeking actionable insights.
Partnerships

Strategic mining JVs
Strategic mining JVs de-risk capital-intensive projects by sharing cost and local operational know-how, with partners often contributing geology, infrastructure or financing to accelerate ramp-up.
CMOC uses JVs to access tier-one ore bodies and optimize lifecycle economics through shared reserves and blended operational efficiencies.
These alliances strengthen permitting credibility and social license by aligning local stakeholders and leveraging partner relationships.
Offtake and refining partners
Downstream smelters, refiners and cathode makers provide processing optionality and steady demand, with China supplying over 60% of global cathode production in 2023–24. Structured offtakes secure volumes, specs and benchmark-linked pricing formulas, reducing spot exposure. Partner refineries upgrade intermediates into higher-value products, aligning production and stabilizing cash flows across cycles.

Government and community stakeholders
Host governments grant licenses, fiscal terms and infrastructure support crucial for CMOC’s Tenke Fungurume and other assets, underpinning project timelines and capex decisions. Community groups determine site access and social license, affecting operational continuity and long-term stability. Collaborative programs on jobs, education and environmental management build trust and improve retention of local workforce. Transparent engagement and grievance mechanisms reduce disruption risk and safeguard production.

Logistics and EPC providers
Logistics and EPC partners secure inland-to-port export corridors for CMOC, with rail, port and freight alliances ensuring consistent flows and reduced demurrage in 2024.
EPC and OEM suppliers design, build and maintain processing plants to improve uptime and throughput under performance-based contracts.
Coordinated logistics lower unit costs and optimize turnarounds, supporting stable export volumes.
- Rail-port-freight alliances: reliable inland export links
- Performance contracts: higher uptime, increased throughput
- EPC/OEM: efficient plant construction and maintenance
- Coordinated logistics: lower unit costs and demurrage
Technology and ESG advisors
Technology partners in automation, ore-sorting and metallurgical trials can boost recoveries and safety—ore-sorting typically raises feed grades 20–40% and cuts waste up to 30%—while ESG advisors deliver baseline studies, continuous monitoring and reporting aligned with ISSB standards finalised in 2023 and EU Battery Regulation traceability requirements coming into force by 2027 to satisfy customer audits and global standards.
- Automation: lower LTIs, ~10–20% OPEX reduction
- Ore-sorting: +20–40% grade, −30% waste
- ESG/data: ISSB 2023; EU Battery Reg traceability by 2027
Strategic JVs, offtake and tech partners cut capex, lift grades and stabilise cash flow
Strategic JVs share capex, access tier‑one ore and improve lifecycle economics through shared reserves and blended efficiencies.
Offtake and downstream partners (China >60% cathode share in 2023–24) provide processing optionality and benchmark‑linked pricing, stabilising cash flow.
Logistics, EPC/OEM and performance contracts reduce unit costs and increase uptime; automation cuts OPEX ~10–20%.
Ore‑sorting boosts feed grades +20–40% and cuts waste ~30%; ESG partners align reporting to ISSB 2023 and EU traceability by 2027.
| Partner | Role | 2023–24 metric |
|---|---|---|
| JVs | De‑risk capex, share reserves | Access tier‑one ore |
| Downstream/Offtake | Processing, offtake | China >60% cathode share |
| Tech/ESG | Automation, ore‑sorting, reporting | OPEX −10–20%; grade +20–40% |
What is included in the product
 Detailed Word Document
A ready-to-use Business Model Canvas for CMOC Group detailing customer segments, channels, value propositions and revenue streams across the 9 BMC blocks, with operational links to mining, processing and trading, competitive advantages, SWOT insights and investor-ready narratives for strategy and funding discussions.

 Customizable Excel Spreadsheet
High-level, editable Business Model Canvas that condenses CMOC Group’s strategy into a one-page snapshot, relieving the pain of lengthy formatting by saving hours and enabling fast team collaboration, comparison, and decision-making.
Activities

Exploration and resource modeling
Systematic drilling, geophysics and sampling extended CMOC’s identified resource base, with over 500,000 m drilled in 2024 to enhance target definition and lower unit discovery costs. Block models and geometallurgical datasets now directly inform mine plans and cut-off grade optimization, improving ore recovery and cash-margin visibility. Continuous resource conversion sustains multi-year production profiles, while data-driven methods have reduced discovery risk and exploration costs materially.
Mine development and operations
Stripping, drilling, blasting, loading and hauling focus on efficient ore extraction aligned with 2024 operational plans to maximize throughput and grade recovery. Fleet management and preventive maintenance protect availability and reduce unscheduled downtime across open-pit and underground assets. Robust safety systems and training programs in 2024 emphasized incident reduction and compliance with regulatory standards. Continuous cost discipline targets competitive C1 cash costs to sustain margins.

Processing and product upgrading
Crushing, milling, flotation, leaching and SX-EW drive recoveries—2024 industry benchmarks show flotation 70–90% and SX-EW 90–98% on oxide ores, which CMOC targets through circuit tuning.
Blending and impurity control ensure tight customer specs by managing grade and deleterious elements to meet contractual limits and maximize concentrate penalties/credits.
Debottlenecking and continuous improvement programs typically lift throughput 5–20%, while by-product capture (gold, molybdenum) materially improves unit economics.

Marketing, trading, and risk management
CMOC balances spot and long-term exposure through structured contracts and tenders, leveraging Tenke Fungurume and AM/PGM supply to stabilize offtake; hedging strategies, pricing indices and premia targeted volatility reduction across metals, with market intelligence shifting production allocations in line with 2024 demand signals. Customer qualification protocols prioritize counterparty credit and offtake reliability.
- Structured contracts: mix spot/long-term
- Hedging & pricing indices: manage volatility
- Market intelligence: align production to 2024 demand shifts
- Customer qualification: ensure reliable offtake
ESG stewardship and compliance
CMOC's ESG stewardship implements continuous environmental monitoring and engineered water and tailings management to safeguard ecosystems, with disclosures aligned to GRI and ICMM as of 2024. Community programs and local hiring create measurable shared value and reinforce social license. Audit-ready reporting and supply-chain traceability meet OECD and global responsible-sourcing expectations.
- Environmental monitoring
- Water & tailings safeguards
- Community programs & local hiring
- Audit-ready reporting (GRI/ICMM)
- Traceability for ethical sourcing
500,000 m drilled; flotation 70–90%, SX-EW 90–98%
Systematic exploration: 500,000 m drilled in 2024, improving target definition and resource conversion.
Mine ops: stripping-to-mill, fleet maintenance and safety programs driving availability and cost control.
Processing & sales: flotation 70–90% recovery, SX-EW 90–98% on oxides; blend control and structured contracts manage market risk.
| Metric | 2024 value |
|---|---|
| Meterage drilled | 500,000 m |
| Flotation recovery | 70–90% |
| SX‑EW recovery | 90–98% |
| Debottleneck uplift | 5–20% |
Full Version Awaits
Business Model Canvas
The CMOC Group Business Model Canvas you’re previewing is the actual deliverable, not a mockup. When you purchase, you’ll receive this same complete document—fully formatted and editable. Files are provided exactly as shown, ready for download in Word and Excel formats.

Business Model Canvas for Major Copper-Cobalt Miner: Key Partners, Revenues, Cost Drivers
Explore CMOC Group’s Business Model Canvas to uncover how the miner captures value across supply chains, customer segments, and commodity cycles; this concise snapshot highlights key partners, revenue streams, and cost drivers. Purchase the full Canvas for a section-by-section, editable Word/Excel analysis—ideal for investors, strategists, and analysts seeking actionable insights.
Partnerships
Strategic mining JVs
Strategic mining JVs de-risk capital-intensive projects by sharing cost and local operational know-how, with partners often contributing geology, infrastructure or financing to accelerate ramp-up.
CMOC uses JVs to access tier-one ore bodies and optimize lifecycle economics through shared reserves and blended operational efficiencies.
These alliances strengthen permitting credibility and social license by aligning local stakeholders and leveraging partner relationships.
Offtake and refining partners
Downstream smelters, refiners and cathode makers provide processing optionality and steady demand, with China supplying over 60% of global cathode production in 2023–24. Structured offtakes secure volumes, specs and benchmark-linked pricing formulas, reducing spot exposure. Partner refineries upgrade intermediates into higher-value products, aligning production and stabilizing cash flows across cycles.
Government and community stakeholders
Host governments grant licenses, fiscal terms and infrastructure support crucial for CMOC’s Tenke Fungurume and other assets, underpinning project timelines and capex decisions. Community groups determine site access and social license, affecting operational continuity and long-term stability. Collaborative programs on jobs, education and environmental management build trust and improve retention of local workforce. Transparent engagement and grievance mechanisms reduce disruption risk and safeguard production.
Logistics and EPC providers
Logistics and EPC partners secure inland-to-port export corridors for CMOC, with rail, port and freight alliances ensuring consistent flows and reduced demurrage in 2024.
EPC and OEM suppliers design, build and maintain processing plants to improve uptime and throughput under performance-based contracts.
Coordinated logistics lower unit costs and optimize turnarounds, supporting stable export volumes.
- Rail-port-freight alliances: reliable inland export links
- Performance contracts: higher uptime, increased throughput
- EPC/OEM: efficient plant construction and maintenance
- Coordinated logistics: lower unit costs and demurrage
Technology and ESG advisors
Technology partners in automation, ore-sorting and metallurgical trials can boost recoveries and safety—ore-sorting typically raises feed grades 20–40% and cuts waste up to 30%—while ESG advisors deliver baseline studies, continuous monitoring and reporting aligned with ISSB standards finalised in 2023 and EU Battery Regulation traceability requirements coming into force by 2027 to satisfy customer audits and global standards.
- Automation: lower LTIs, ~10–20% OPEX reduction
- Ore-sorting: +20–40% grade, −30% waste
- ESG/data: ISSB 2023; EU Battery Reg traceability by 2027
Strategic JVs, offtake and tech partners cut capex, lift grades and stabilise cash flow
Strategic JVs share capex, access tier‑one ore and improve lifecycle economics through shared reserves and blended efficiencies.
Offtake and downstream partners (China >60% cathode share in 2023–24) provide processing optionality and benchmark‑linked pricing, stabilising cash flow.
Logistics, EPC/OEM and performance contracts reduce unit costs and increase uptime; automation cuts OPEX ~10–20%.
Ore‑sorting boosts feed grades +20–40% and cuts waste ~30%; ESG partners align reporting to ISSB 2023 and EU traceability by 2027.
| Partner | Role | 2023–24 metric |
|---|---|---|
| JVs | De‑risk capex, share reserves | Access tier‑one ore |
| Downstream/Offtake | Processing, offtake | China >60% cathode share |
| Tech/ESG | Automation, ore‑sorting, reporting | OPEX −10–20%; grade +20–40% |
What is included in the product
Detailed Word Document
A ready-to-use Business Model Canvas for CMOC Group detailing customer segments, channels, value propositions and revenue streams across the 9 BMC blocks, with operational links to mining, processing and trading, competitive advantages, SWOT insights and investor-ready narratives for strategy and funding discussions.
Customizable Excel Spreadsheet
High-level, editable Business Model Canvas that condenses CMOC Group’s strategy into a one-page snapshot, relieving the pain of lengthy formatting by saving hours and enabling fast team collaboration, comparison, and decision-making.
Activities
Exploration and resource modeling
Systematic drilling, geophysics and sampling extended CMOC’s identified resource base, with over 500,000 m drilled in 2024 to enhance target definition and lower unit discovery costs. Block models and geometallurgical datasets now directly inform mine plans and cut-off grade optimization, improving ore recovery and cash-margin visibility. Continuous resource conversion sustains multi-year production profiles, while data-driven methods have reduced discovery risk and exploration costs materially.
Mine development and operations
Stripping, drilling, blasting, loading and hauling focus on efficient ore extraction aligned with 2024 operational plans to maximize throughput and grade recovery. Fleet management and preventive maintenance protect availability and reduce unscheduled downtime across open-pit and underground assets. Robust safety systems and training programs in 2024 emphasized incident reduction and compliance with regulatory standards. Continuous cost discipline targets competitive C1 cash costs to sustain margins.
Processing and product upgrading
Crushing, milling, flotation, leaching and SX-EW drive recoveries—2024 industry benchmarks show flotation 70–90% and SX-EW 90–98% on oxide ores, which CMOC targets through circuit tuning.
Blending and impurity control ensure tight customer specs by managing grade and deleterious elements to meet contractual limits and maximize concentrate penalties/credits.
Debottlenecking and continuous improvement programs typically lift throughput 5–20%, while by-product capture (gold, molybdenum) materially improves unit economics.
Marketing, trading, and risk management
CMOC balances spot and long-term exposure through structured contracts and tenders, leveraging Tenke Fungurume and AM/PGM supply to stabilize offtake; hedging strategies, pricing indices and premia targeted volatility reduction across metals, with market intelligence shifting production allocations in line with 2024 demand signals. Customer qualification protocols prioritize counterparty credit and offtake reliability.
- Structured contracts: mix spot/long-term
- Hedging & pricing indices: manage volatility
- Market intelligence: align production to 2024 demand shifts
- Customer qualification: ensure reliable offtake
ESG stewardship and compliance
CMOC's ESG stewardship implements continuous environmental monitoring and engineered water and tailings management to safeguard ecosystems, with disclosures aligned to GRI and ICMM as of 2024. Community programs and local hiring create measurable shared value and reinforce social license. Audit-ready reporting and supply-chain traceability meet OECD and global responsible-sourcing expectations.
- Environmental monitoring
- Water & tailings safeguards
- Community programs & local hiring
- Audit-ready reporting (GRI/ICMM)
- Traceability for ethical sourcing
500,000 m drilled; flotation 70–90%, SX-EW 90–98%
Systematic exploration: 500,000 m drilled in 2024, improving target definition and resource conversion.
Mine ops: stripping-to-mill, fleet maintenance and safety programs driving availability and cost control.
Processing & sales: flotation 70–90% recovery, SX-EW 90–98% on oxides; blend control and structured contracts manage market risk.
| Metric | 2024 value |
|---|---|
| Meterage drilled | 500,000 m |
| Flotation recovery | 70–90% |
| SX‑EW recovery | 90–98% |
| Debottleneck uplift | 5–20% |
Full Version Awaits
Business Model Canvas
The CMOC Group Business Model Canvas you’re previewing is the actual deliverable, not a mockup. When you purchase, you’ll receive this same complete document—fully formatted and editable. Files are provided exactly as shown, ready for download in Word and Excel formats.
Original: $10.00
-65%$10.00
$3.50Description
Business Model Canvas for Major Copper-Cobalt Miner: Key Partners, Revenues, Cost Drivers
Explore CMOC Group’s Business Model Canvas to uncover how the miner captures value across supply chains, customer segments, and commodity cycles; this concise snapshot highlights key partners, revenue streams, and cost drivers. Purchase the full Canvas for a section-by-section, editable Word/Excel analysis—ideal for investors, strategists, and analysts seeking actionable insights.
Partnerships
Strategic mining JVs
Strategic mining JVs de-risk capital-intensive projects by sharing cost and local operational know-how, with partners often contributing geology, infrastructure or financing to accelerate ramp-up.
CMOC uses JVs to access tier-one ore bodies and optimize lifecycle economics through shared reserves and blended operational efficiencies.
These alliances strengthen permitting credibility and social license by aligning local stakeholders and leveraging partner relationships.
Offtake and refining partners
Downstream smelters, refiners and cathode makers provide processing optionality and steady demand, with China supplying over 60% of global cathode production in 2023–24. Structured offtakes secure volumes, specs and benchmark-linked pricing formulas, reducing spot exposure. Partner refineries upgrade intermediates into higher-value products, aligning production and stabilizing cash flows across cycles.
Government and community stakeholders
Host governments grant licenses, fiscal terms and infrastructure support crucial for CMOC’s Tenke Fungurume and other assets, underpinning project timelines and capex decisions. Community groups determine site access and social license, affecting operational continuity and long-term stability. Collaborative programs on jobs, education and environmental management build trust and improve retention of local workforce. Transparent engagement and grievance mechanisms reduce disruption risk and safeguard production.
Logistics and EPC providers
Logistics and EPC partners secure inland-to-port export corridors for CMOC, with rail, port and freight alliances ensuring consistent flows and reduced demurrage in 2024.
EPC and OEM suppliers design, build and maintain processing plants to improve uptime and throughput under performance-based contracts.
Coordinated logistics lower unit costs and optimize turnarounds, supporting stable export volumes.
- Rail-port-freight alliances: reliable inland export links
- Performance contracts: higher uptime, increased throughput
- EPC/OEM: efficient plant construction and maintenance
- Coordinated logistics: lower unit costs and demurrage
Technology and ESG advisors
Technology partners in automation, ore-sorting and metallurgical trials can boost recoveries and safety—ore-sorting typically raises feed grades 20–40% and cuts waste up to 30%—while ESG advisors deliver baseline studies, continuous monitoring and reporting aligned with ISSB standards finalised in 2023 and EU Battery Regulation traceability requirements coming into force by 2027 to satisfy customer audits and global standards.
- Automation: lower LTIs, ~10–20% OPEX reduction
- Ore-sorting: +20–40% grade, −30% waste
- ESG/data: ISSB 2023; EU Battery Reg traceability by 2027
Strategic JVs, offtake and tech partners cut capex, lift grades and stabilise cash flow
Strategic JVs share capex, access tier‑one ore and improve lifecycle economics through shared reserves and blended efficiencies.
Offtake and downstream partners (China >60% cathode share in 2023–24) provide processing optionality and benchmark‑linked pricing, stabilising cash flow.
Logistics, EPC/OEM and performance contracts reduce unit costs and increase uptime; automation cuts OPEX ~10–20%.
Ore‑sorting boosts feed grades +20–40% and cuts waste ~30%; ESG partners align reporting to ISSB 2023 and EU traceability by 2027.
| Partner | Role | 2023–24 metric |
|---|---|---|
| JVs | De‑risk capex, share reserves | Access tier‑one ore |
| Downstream/Offtake | Processing, offtake | China >60% cathode share |
| Tech/ESG | Automation, ore‑sorting, reporting | OPEX −10–20%; grade +20–40% |
What is included in the product
Detailed Word Document
A ready-to-use Business Model Canvas for CMOC Group detailing customer segments, channels, value propositions and revenue streams across the 9 BMC blocks, with operational links to mining, processing and trading, competitive advantages, SWOT insights and investor-ready narratives for strategy and funding discussions.
Customizable Excel Spreadsheet
High-level, editable Business Model Canvas that condenses CMOC Group’s strategy into a one-page snapshot, relieving the pain of lengthy formatting by saving hours and enabling fast team collaboration, comparison, and decision-making.
Activities
Exploration and resource modeling
Systematic drilling, geophysics and sampling extended CMOC’s identified resource base, with over 500,000 m drilled in 2024 to enhance target definition and lower unit discovery costs. Block models and geometallurgical datasets now directly inform mine plans and cut-off grade optimization, improving ore recovery and cash-margin visibility. Continuous resource conversion sustains multi-year production profiles, while data-driven methods have reduced discovery risk and exploration costs materially.
Mine development and operations
Stripping, drilling, blasting, loading and hauling focus on efficient ore extraction aligned with 2024 operational plans to maximize throughput and grade recovery. Fleet management and preventive maintenance protect availability and reduce unscheduled downtime across open-pit and underground assets. Robust safety systems and training programs in 2024 emphasized incident reduction and compliance with regulatory standards. Continuous cost discipline targets competitive C1 cash costs to sustain margins.
Processing and product upgrading
Crushing, milling, flotation, leaching and SX-EW drive recoveries—2024 industry benchmarks show flotation 70–90% and SX-EW 90–98% on oxide ores, which CMOC targets through circuit tuning.
Blending and impurity control ensure tight customer specs by managing grade and deleterious elements to meet contractual limits and maximize concentrate penalties/credits.
Debottlenecking and continuous improvement programs typically lift throughput 5–20%, while by-product capture (gold, molybdenum) materially improves unit economics.
Marketing, trading, and risk management
CMOC balances spot and long-term exposure through structured contracts and tenders, leveraging Tenke Fungurume and AM/PGM supply to stabilize offtake; hedging strategies, pricing indices and premia targeted volatility reduction across metals, with market intelligence shifting production allocations in line with 2024 demand signals. Customer qualification protocols prioritize counterparty credit and offtake reliability.
- Structured contracts: mix spot/long-term
- Hedging & pricing indices: manage volatility
- Market intelligence: align production to 2024 demand shifts
- Customer qualification: ensure reliable offtake
ESG stewardship and compliance
CMOC's ESG stewardship implements continuous environmental monitoring and engineered water and tailings management to safeguard ecosystems, with disclosures aligned to GRI and ICMM as of 2024. Community programs and local hiring create measurable shared value and reinforce social license. Audit-ready reporting and supply-chain traceability meet OECD and global responsible-sourcing expectations.
- Environmental monitoring
- Water & tailings safeguards
- Community programs & local hiring
- Audit-ready reporting (GRI/ICMM)
- Traceability for ethical sourcing
500,000 m drilled; flotation 70–90%, SX-EW 90–98%
Systematic exploration: 500,000 m drilled in 2024, improving target definition and resource conversion.
Mine ops: stripping-to-mill, fleet maintenance and safety programs driving availability and cost control.
Processing & sales: flotation 70–90% recovery, SX-EW 90–98% on oxides; blend control and structured contracts manage market risk.
| Metric | 2024 value |
|---|---|
| Meterage drilled | 500,000 m |
| Flotation recovery | 70–90% |
| SX‑EW recovery | 90–98% |
| Debottleneck uplift | 5–20% |
Full Version Awaits
Business Model Canvas
The CMOC Group Business Model Canvas you’re previewing is the actual deliverable, not a mockup. When you purchase, you’ll receive this same complete document—fully formatted and editable. Files are provided exactly as shown, ready for download in Word and Excel formats.











