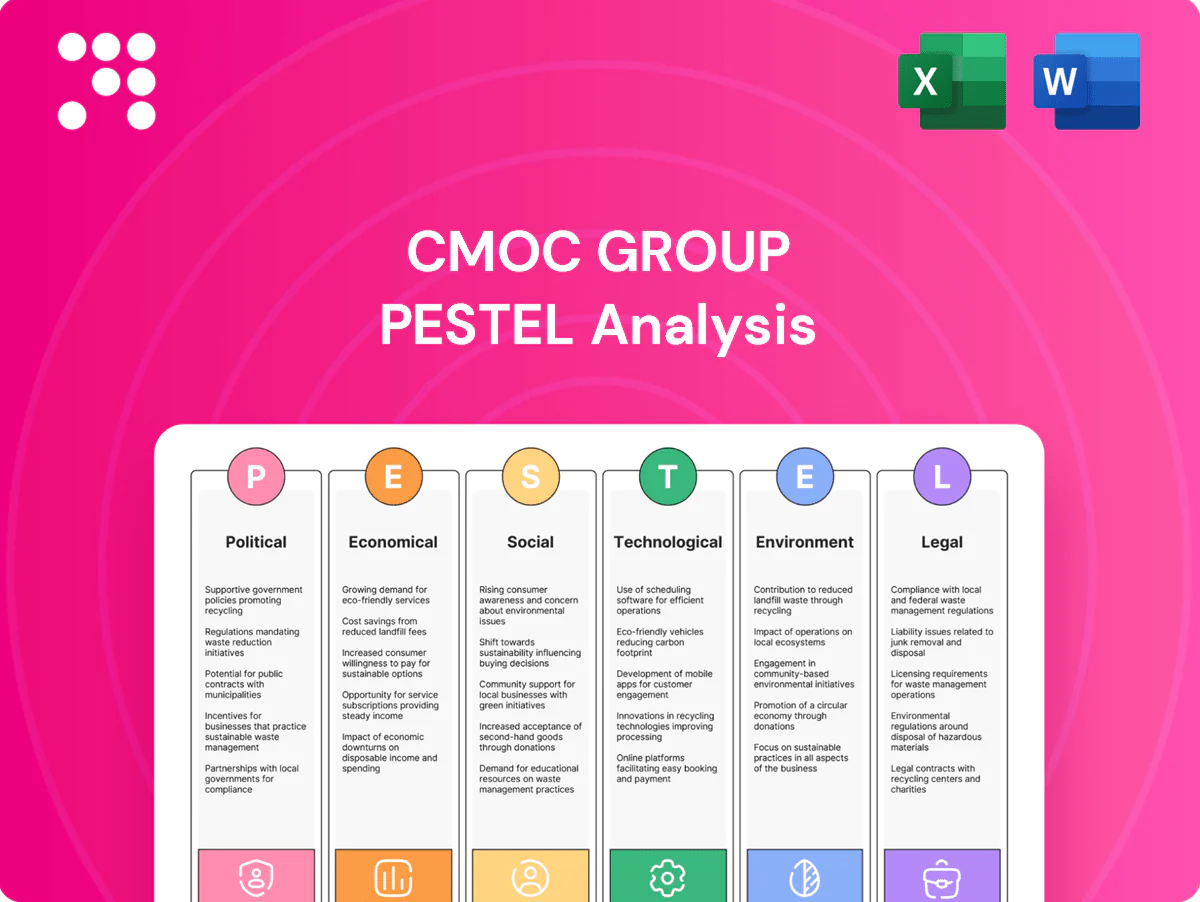
CMOC Group PESTLE Analysis

Your Shortcut to Market Insight Starts Here
Discover how political, economic, social, technological, legal and environmental forces shape CMOC Group's strategic outlook. Our PESTLE distills key risks and growth opportunities into actionable insights for investors and strategists. Purchase the full, editable report to access the complete analysis and make confident, data-driven decisions.
Political factors

Resource nationalism in host countries
Governments in Africa and Latin America can raise royalties, tighten codes or seek greater ownership in strategic minerals, threatening project economics for CMOC’s copper, cobalt, niobium and phosphate assets; the DRC supplies roughly 70% of global cobalt (2023–24), amplifying sovereign leverage. Proactive engagement and stability agreements reduce volatility and preserve capital allocation. Scenario planning must include sudden tax or export policy changes.
Geopolitical tensions and trade controls
Export controls and sanctions on critical minerals and related tech can disrupt CMOC sales and procurement, highlighted by 2023–24 tightening of export rules. East–West tensions may complicate financing, OEM contracts and equipment sourcing given DRC supplies ~70% of global cobalt and China controls ~80% of refining capacity. Diversifying end markets and suppliers reduces exposure. Strong compliance and traceability bolster customer confidence.

Security and governance in high-risk jurisdictions
Operations in conflict-affected jurisdictions face elevated disruption risk; the DRC, which accounted for roughly 70% of global cobalt production in 2023, illustrates how local instability can impact supply. Permitting delays, protests or security incidents can curtail output and logistics. Robust stakeholder mapping and community programs reduce social conflict, while political risk insurance and contingency planning safeguard continuity.

Infrastructure and logistics policy
Public investment or bottlenecks in rail, ports and power grids materially reduce mining throughput; China rail freight was ~4.6 billion tonnes in 2023 and Shanghai port handled ~43.5 million TEU in 2023, highlighting congestion risks. Priority access agreements can secure capacity during shortages and lower disruption risk. Policy shifts on fuel or power tariffs directly compress margins.
- Rail/port bottlenecks = throughput risk
- Priority access secures capacity
- Corridor coordination lowers unit costs
- Fuel/power tariff changes hit margins
Critical minerals industrial policy
Major economies' industrial policies, notably the US Inflation Reduction Act (2022) and the EU Critical Raw Materials Act (2023), are reshaping EV and renewables supply chains and demand standards, pushing miners to meet domestic content and ESG requirements. Incentives for low-carbon metals and alignment with these policies can unlock concessional financing and offtake contracts; participation in strategic stockpile programs in markets like the US and China can stabilise volumes.
- Policy drivers: IRA 2022, EU CRMA 2023
- Benefit: access to green financing and offtakes
- Risk mitigation: strategic stockpile participation
Sovereign grabs, DRC 70% cobalt and China 80% refining risk; IRA/EU CRMA access offsets
Sovereign actions in Africa/LatAm can raise royalties or seek stakes, threatening project NPV; DRC supplied ~70% of global cobalt in 2023–24. Export controls and China’s ~80% refining share concentrate risk after 2023–24 tightening. Infrastructure bottlenecks and policy shifts (fuel/power) compress margins and disrupt volumes. Aligning with IRA 2022 and EU CRMA 2023 unlocks finance/offtake options.
| Risk | Impact | 2023–24 metric | Mitigation |
|---|---|---|---|
| Sovereign leverage | NPV hit | DRC ~70% cobalt | Stability pacts |
| Refining concentration | Supply risk | China ~80% capacity | Diversify/refiners |
| Logistics | Throughput loss | Port/rail congestion | Priority access |
What is included in the product
 Detailed Word Document
Explores how macro-environmental forces uniquely affect CMOC Group across Political, Economic, Social, Technological, Environmental and Legal dimensions, with data-backed trends, industry-specific examples and forward-looking insights to inform strategic planning, risk mitigation and investor-facing materials.

 Customizable Excel Spreadsheet
A concise CMOC Group PESTLE summary that organizes political, economic, social, technological, legal and environmental insights for quick reference during meetings or presentations. Visually segmented and easily shareable, it supports risk discussions, regional notes, and slide-ready copy for fast alignment across teams.
Economic factors

Commodity price volatility
Copper and cobalt prices move with global growth and EV penetration—EVs reached about 14% of global new-car sales by 2023–24—directly impacting CMOC cash flow and capex timing; refined cobalt sees over 50% of demand from batteries. Molybdenum, tungsten, niobium and phosphate follow separate cycles tied to steel, aerospace and agriculture end markets. Active hedging and staged capex plus a low cost-curve position boost resilience.
Currency fluctuations and inflation
CMOC faces FX exposure as operating costs are local while revenues are largely USD-denominated, a dynamic amplified by 2024 USD strength versus many EM currencies; mid-single-digit FX moves can materially swing margins. Inflation in energy, reagents and labor—notably higher in 2023–24—erodes unit margins unless offset. Index-linked offtake/contract escalation and procurement scale have reduced cost creep in recent years. Treasury should balance natural hedges (pricing, currency mix) with selective derivatives to manage volatility.

Global demand from energy transition
Electrification and grid investment underpin structural copper demand as global refined copper consumption reached about 25.6 Mt in 2023, supporting CMOC exposure to copper. EV batteries sustain cobalt demand while chemistry shifts to low‑cobalt NMC 811 and LFP; DRC supplies roughly 70% of mined cobalt. Infrastructure and aerospace continue to drive niobium (Brazil >90% share) and molybdenum alloy needs. Fertilizer cycles keep phosphate volumes cyclical; aligning production to these trends improves portfolio durability.

Capital access and cost of funding
Rising benchmark yields (US 10y ~4.2% in Jun 2025) and wider risk premia materially affect mine project IRRs and refinancing windows; ESG-linked loans/bonds commonly cut margins by ~5–25 bps when targets are verifiable. Secured long-term offtakes with tier-1 customers stabilise cash flows, while preserving investment-grade metrics expands bank, bond and export-credit capacity.
- Benchmark yield: US 10y ~4.2% (Jun 2025)
- ESG margin uplift: ~5–25 bps
- Offtake: reduces cash-flow volatility
- Investment-grade: widens financing sources
Supply chain resilience and trading
Supply chain disruptions in shipping, sulfates, sulfuric acid and spare parts can directly constrain CMOC Group output and margins; volatility remained elevated through 2024–2025. A strong marketing arm and diversified logistics networks reduce bottlenecks and improve off-take flexibility. Inventory and blending strategies optimize realized prices while digital market intelligence enhances arbitrage and allocation.
- Logistics diversification: reduces stoppage risk
- Inventory blending: smooths realized metal prices
- Digital intelligence: improves allocation/arbitrage
- Critical inputs: sulfates/sulfuric acid/spare parts vulnerability
Sovereign grabs, DRC 70% cobalt and China 80% refining risk; IRA/EU CRMA access offsets
Copper and cobalt price cycles tied to 14% EV share (2023–24) and 25.6 Mt refined copper (2023) drive CMOC cash flow and capex timing; >50% of refined cobalt used in batteries and DRC supplies ~70% of mined cobalt. USD strength and mid-single-digit FX moves materially swing margins vs local costs; US 10y ~4.2% (Jun 2025) raises project IRRs and refinancing costs.
| Metric | Value |
|---|---|
| Refined copper (2023) | 25.6 Mt |
| EV share (2023–24) | ~14% |
| Cobalt battery demand | >50% |
| DRC cobalt supply | ~70% |
| US 10y (Jun 2025) | ~4.2% |
Preview Before You Purchase
CMOC Group PESTLE Analysis
The CMOC Group PESTLE Analysis preview shown here is the exact document you’ll receive after purchase—fully formatted and ready to use. The content and structure visible are identical to the downloadable file. No placeholders or teasers—this is the final, professional report you’ll own immediately after checkout.

Your Shortcut to Market Insight Starts Here
Discover how political, economic, social, technological, legal and environmental forces shape CMOC Group's strategic outlook. Our PESTLE distills key risks and growth opportunities into actionable insights for investors and strategists. Purchase the full, editable report to access the complete analysis and make confident, data-driven decisions.
Political factors
Resource nationalism in host countries
Governments in Africa and Latin America can raise royalties, tighten codes or seek greater ownership in strategic minerals, threatening project economics for CMOC’s copper, cobalt, niobium and phosphate assets; the DRC supplies roughly 70% of global cobalt (2023–24), amplifying sovereign leverage. Proactive engagement and stability agreements reduce volatility and preserve capital allocation. Scenario planning must include sudden tax or export policy changes.
Geopolitical tensions and trade controls
Export controls and sanctions on critical minerals and related tech can disrupt CMOC sales and procurement, highlighted by 2023–24 tightening of export rules. East–West tensions may complicate financing, OEM contracts and equipment sourcing given DRC supplies ~70% of global cobalt and China controls ~80% of refining capacity. Diversifying end markets and suppliers reduces exposure. Strong compliance and traceability bolster customer confidence.
Security and governance in high-risk jurisdictions
Operations in conflict-affected jurisdictions face elevated disruption risk; the DRC, which accounted for roughly 70% of global cobalt production in 2023, illustrates how local instability can impact supply. Permitting delays, protests or security incidents can curtail output and logistics. Robust stakeholder mapping and community programs reduce social conflict, while political risk insurance and contingency planning safeguard continuity.
Infrastructure and logistics policy
Public investment or bottlenecks in rail, ports and power grids materially reduce mining throughput; China rail freight was ~4.6 billion tonnes in 2023 and Shanghai port handled ~43.5 million TEU in 2023, highlighting congestion risks. Priority access agreements can secure capacity during shortages and lower disruption risk. Policy shifts on fuel or power tariffs directly compress margins.
- Rail/port bottlenecks = throughput risk
- Priority access secures capacity
- Corridor coordination lowers unit costs
- Fuel/power tariff changes hit margins
Critical minerals industrial policy
Major economies' industrial policies, notably the US Inflation Reduction Act (2022) and the EU Critical Raw Materials Act (2023), are reshaping EV and renewables supply chains and demand standards, pushing miners to meet domestic content and ESG requirements. Incentives for low-carbon metals and alignment with these policies can unlock concessional financing and offtake contracts; participation in strategic stockpile programs in markets like the US and China can stabilise volumes.
- Policy drivers: IRA 2022, EU CRMA 2023
- Benefit: access to green financing and offtakes
- Risk mitigation: strategic stockpile participation
Sovereign grabs, DRC 70% cobalt and China 80% refining risk; IRA/EU CRMA access offsets
Sovereign actions in Africa/LatAm can raise royalties or seek stakes, threatening project NPV; DRC supplied ~70% of global cobalt in 2023–24. Export controls and China’s ~80% refining share concentrate risk after 2023–24 tightening. Infrastructure bottlenecks and policy shifts (fuel/power) compress margins and disrupt volumes. Aligning with IRA 2022 and EU CRMA 2023 unlocks finance/offtake options.
| Risk | Impact | 2023–24 metric | Mitigation |
|---|---|---|---|
| Sovereign leverage | NPV hit | DRC ~70% cobalt | Stability pacts |
| Refining concentration | Supply risk | China ~80% capacity | Diversify/refiners |
| Logistics | Throughput loss | Port/rail congestion | Priority access |
What is included in the product
Detailed Word Document
Explores how macro-environmental forces uniquely affect CMOC Group across Political, Economic, Social, Technological, Environmental and Legal dimensions, with data-backed trends, industry-specific examples and forward-looking insights to inform strategic planning, risk mitigation and investor-facing materials.
Customizable Excel Spreadsheet
A concise CMOC Group PESTLE summary that organizes political, economic, social, technological, legal and environmental insights for quick reference during meetings or presentations. Visually segmented and easily shareable, it supports risk discussions, regional notes, and slide-ready copy for fast alignment across teams.
Economic factors
Commodity price volatility
Copper and cobalt prices move with global growth and EV penetration—EVs reached about 14% of global new-car sales by 2023–24—directly impacting CMOC cash flow and capex timing; refined cobalt sees over 50% of demand from batteries. Molybdenum, tungsten, niobium and phosphate follow separate cycles tied to steel, aerospace and agriculture end markets. Active hedging and staged capex plus a low cost-curve position boost resilience.
Currency fluctuations and inflation
CMOC faces FX exposure as operating costs are local while revenues are largely USD-denominated, a dynamic amplified by 2024 USD strength versus many EM currencies; mid-single-digit FX moves can materially swing margins. Inflation in energy, reagents and labor—notably higher in 2023–24—erodes unit margins unless offset. Index-linked offtake/contract escalation and procurement scale have reduced cost creep in recent years. Treasury should balance natural hedges (pricing, currency mix) with selective derivatives to manage volatility.
Global demand from energy transition
Electrification and grid investment underpin structural copper demand as global refined copper consumption reached about 25.6 Mt in 2023, supporting CMOC exposure to copper. EV batteries sustain cobalt demand while chemistry shifts to low‑cobalt NMC 811 and LFP; DRC supplies roughly 70% of mined cobalt. Infrastructure and aerospace continue to drive niobium (Brazil >90% share) and molybdenum alloy needs. Fertilizer cycles keep phosphate volumes cyclical; aligning production to these trends improves portfolio durability.
Capital access and cost of funding
Rising benchmark yields (US 10y ~4.2% in Jun 2025) and wider risk premia materially affect mine project IRRs and refinancing windows; ESG-linked loans/bonds commonly cut margins by ~5–25 bps when targets are verifiable. Secured long-term offtakes with tier-1 customers stabilise cash flows, while preserving investment-grade metrics expands bank, bond and export-credit capacity.
- Benchmark yield: US 10y ~4.2% (Jun 2025)
- ESG margin uplift: ~5–25 bps
- Offtake: reduces cash-flow volatility
- Investment-grade: widens financing sources
Supply chain resilience and trading
Supply chain disruptions in shipping, sulfates, sulfuric acid and spare parts can directly constrain CMOC Group output and margins; volatility remained elevated through 2024–2025. A strong marketing arm and diversified logistics networks reduce bottlenecks and improve off-take flexibility. Inventory and blending strategies optimize realized prices while digital market intelligence enhances arbitrage and allocation.
- Logistics diversification: reduces stoppage risk
- Inventory blending: smooths realized metal prices
- Digital intelligence: improves allocation/arbitrage
- Critical inputs: sulfates/sulfuric acid/spare parts vulnerability
Sovereign grabs, DRC 70% cobalt and China 80% refining risk; IRA/EU CRMA access offsets
Copper and cobalt price cycles tied to 14% EV share (2023–24) and 25.6 Mt refined copper (2023) drive CMOC cash flow and capex timing; >50% of refined cobalt used in batteries and DRC supplies ~70% of mined cobalt. USD strength and mid-single-digit FX moves materially swing margins vs local costs; US 10y ~4.2% (Jun 2025) raises project IRRs and refinancing costs.
| Metric | Value |
|---|---|
| Refined copper (2023) | 25.6 Mt |
| EV share (2023–24) | ~14% |
| Cobalt battery demand | >50% |
| DRC cobalt supply | ~70% |
| US 10y (Jun 2025) | ~4.2% |
Preview Before You Purchase
CMOC Group PESTLE Analysis
The CMOC Group PESTLE Analysis preview shown here is the exact document you’ll receive after purchase—fully formatted and ready to use. The content and structure visible are identical to the downloadable file. No placeholders or teasers—this is the final, professional report you’ll own immediately after checkout.
Description
Your Shortcut to Market Insight Starts Here
Discover how political, economic, social, technological, legal and environmental forces shape CMOC Group's strategic outlook. Our PESTLE distills key risks and growth opportunities into actionable insights for investors and strategists. Purchase the full, editable report to access the complete analysis and make confident, data-driven decisions.
Political factors
Resource nationalism in host countries
Governments in Africa and Latin America can raise royalties, tighten codes or seek greater ownership in strategic minerals, threatening project economics for CMOC’s copper, cobalt, niobium and phosphate assets; the DRC supplies roughly 70% of global cobalt (2023–24), amplifying sovereign leverage. Proactive engagement and stability agreements reduce volatility and preserve capital allocation. Scenario planning must include sudden tax or export policy changes.
Geopolitical tensions and trade controls
Export controls and sanctions on critical minerals and related tech can disrupt CMOC sales and procurement, highlighted by 2023–24 tightening of export rules. East–West tensions may complicate financing, OEM contracts and equipment sourcing given DRC supplies ~70% of global cobalt and China controls ~80% of refining capacity. Diversifying end markets and suppliers reduces exposure. Strong compliance and traceability bolster customer confidence.
Security and governance in high-risk jurisdictions
Operations in conflict-affected jurisdictions face elevated disruption risk; the DRC, which accounted for roughly 70% of global cobalt production in 2023, illustrates how local instability can impact supply. Permitting delays, protests or security incidents can curtail output and logistics. Robust stakeholder mapping and community programs reduce social conflict, while political risk insurance and contingency planning safeguard continuity.
Infrastructure and logistics policy
Public investment or bottlenecks in rail, ports and power grids materially reduce mining throughput; China rail freight was ~4.6 billion tonnes in 2023 and Shanghai port handled ~43.5 million TEU in 2023, highlighting congestion risks. Priority access agreements can secure capacity during shortages and lower disruption risk. Policy shifts on fuel or power tariffs directly compress margins.
- Rail/port bottlenecks = throughput risk
- Priority access secures capacity
- Corridor coordination lowers unit costs
- Fuel/power tariff changes hit margins
Critical minerals industrial policy
Major economies' industrial policies, notably the US Inflation Reduction Act (2022) and the EU Critical Raw Materials Act (2023), are reshaping EV and renewables supply chains and demand standards, pushing miners to meet domestic content and ESG requirements. Incentives for low-carbon metals and alignment with these policies can unlock concessional financing and offtake contracts; participation in strategic stockpile programs in markets like the US and China can stabilise volumes.
- Policy drivers: IRA 2022, EU CRMA 2023
- Benefit: access to green financing and offtakes
- Risk mitigation: strategic stockpile participation
Sovereign grabs, DRC 70% cobalt and China 80% refining risk; IRA/EU CRMA access offsets
Sovereign actions in Africa/LatAm can raise royalties or seek stakes, threatening project NPV; DRC supplied ~70% of global cobalt in 2023–24. Export controls and China’s ~80% refining share concentrate risk after 2023–24 tightening. Infrastructure bottlenecks and policy shifts (fuel/power) compress margins and disrupt volumes. Aligning with IRA 2022 and EU CRMA 2023 unlocks finance/offtake options.
| Risk | Impact | 2023–24 metric | Mitigation |
|---|---|---|---|
| Sovereign leverage | NPV hit | DRC ~70% cobalt | Stability pacts |
| Refining concentration | Supply risk | China ~80% capacity | Diversify/refiners |
| Logistics | Throughput loss | Port/rail congestion | Priority access |
What is included in the product
Detailed Word Document
Explores how macro-environmental forces uniquely affect CMOC Group across Political, Economic, Social, Technological, Environmental and Legal dimensions, with data-backed trends, industry-specific examples and forward-looking insights to inform strategic planning, risk mitigation and investor-facing materials.
Customizable Excel Spreadsheet
A concise CMOC Group PESTLE summary that organizes political, economic, social, technological, legal and environmental insights for quick reference during meetings or presentations. Visually segmented and easily shareable, it supports risk discussions, regional notes, and slide-ready copy for fast alignment across teams.
Economic factors
Commodity price volatility
Copper and cobalt prices move with global growth and EV penetration—EVs reached about 14% of global new-car sales by 2023–24—directly impacting CMOC cash flow and capex timing; refined cobalt sees over 50% of demand from batteries. Molybdenum, tungsten, niobium and phosphate follow separate cycles tied to steel, aerospace and agriculture end markets. Active hedging and staged capex plus a low cost-curve position boost resilience.
Currency fluctuations and inflation
CMOC faces FX exposure as operating costs are local while revenues are largely USD-denominated, a dynamic amplified by 2024 USD strength versus many EM currencies; mid-single-digit FX moves can materially swing margins. Inflation in energy, reagents and labor—notably higher in 2023–24—erodes unit margins unless offset. Index-linked offtake/contract escalation and procurement scale have reduced cost creep in recent years. Treasury should balance natural hedges (pricing, currency mix) with selective derivatives to manage volatility.
Global demand from energy transition
Electrification and grid investment underpin structural copper demand as global refined copper consumption reached about 25.6 Mt in 2023, supporting CMOC exposure to copper. EV batteries sustain cobalt demand while chemistry shifts to low‑cobalt NMC 811 and LFP; DRC supplies roughly 70% of mined cobalt. Infrastructure and aerospace continue to drive niobium (Brazil >90% share) and molybdenum alloy needs. Fertilizer cycles keep phosphate volumes cyclical; aligning production to these trends improves portfolio durability.
Capital access and cost of funding
Rising benchmark yields (US 10y ~4.2% in Jun 2025) and wider risk premia materially affect mine project IRRs and refinancing windows; ESG-linked loans/bonds commonly cut margins by ~5–25 bps when targets are verifiable. Secured long-term offtakes with tier-1 customers stabilise cash flows, while preserving investment-grade metrics expands bank, bond and export-credit capacity.
- Benchmark yield: US 10y ~4.2% (Jun 2025)
- ESG margin uplift: ~5–25 bps
- Offtake: reduces cash-flow volatility
- Investment-grade: widens financing sources
Supply chain resilience and trading
Supply chain disruptions in shipping, sulfates, sulfuric acid and spare parts can directly constrain CMOC Group output and margins; volatility remained elevated through 2024–2025. A strong marketing arm and diversified logistics networks reduce bottlenecks and improve off-take flexibility. Inventory and blending strategies optimize realized prices while digital market intelligence enhances arbitrage and allocation.
- Logistics diversification: reduces stoppage risk
- Inventory blending: smooths realized metal prices
- Digital intelligence: improves allocation/arbitrage
- Critical inputs: sulfates/sulfuric acid/spare parts vulnerability
Sovereign grabs, DRC 70% cobalt and China 80% refining risk; IRA/EU CRMA access offsets
Copper and cobalt price cycles tied to 14% EV share (2023–24) and 25.6 Mt refined copper (2023) drive CMOC cash flow and capex timing; >50% of refined cobalt used in batteries and DRC supplies ~70% of mined cobalt. USD strength and mid-single-digit FX moves materially swing margins vs local costs; US 10y ~4.2% (Jun 2025) raises project IRRs and refinancing costs.
| Metric | Value |
|---|---|
| Refined copper (2023) | 25.6 Mt |
| EV share (2023–24) | ~14% |
| Cobalt battery demand | >50% |
| DRC cobalt supply | ~70% |
| US 10y (Jun 2025) | ~4.2% |
Preview Before You Purchase
CMOC Group PESTLE Analysis
The CMOC Group PESTLE Analysis preview shown here is the exact document you’ll receive after purchase—fully formatted and ready to use. The content and structure visible are identical to the downloadable file. No placeholders or teasers—this is the final, professional report you’ll own immediately after checkout.











