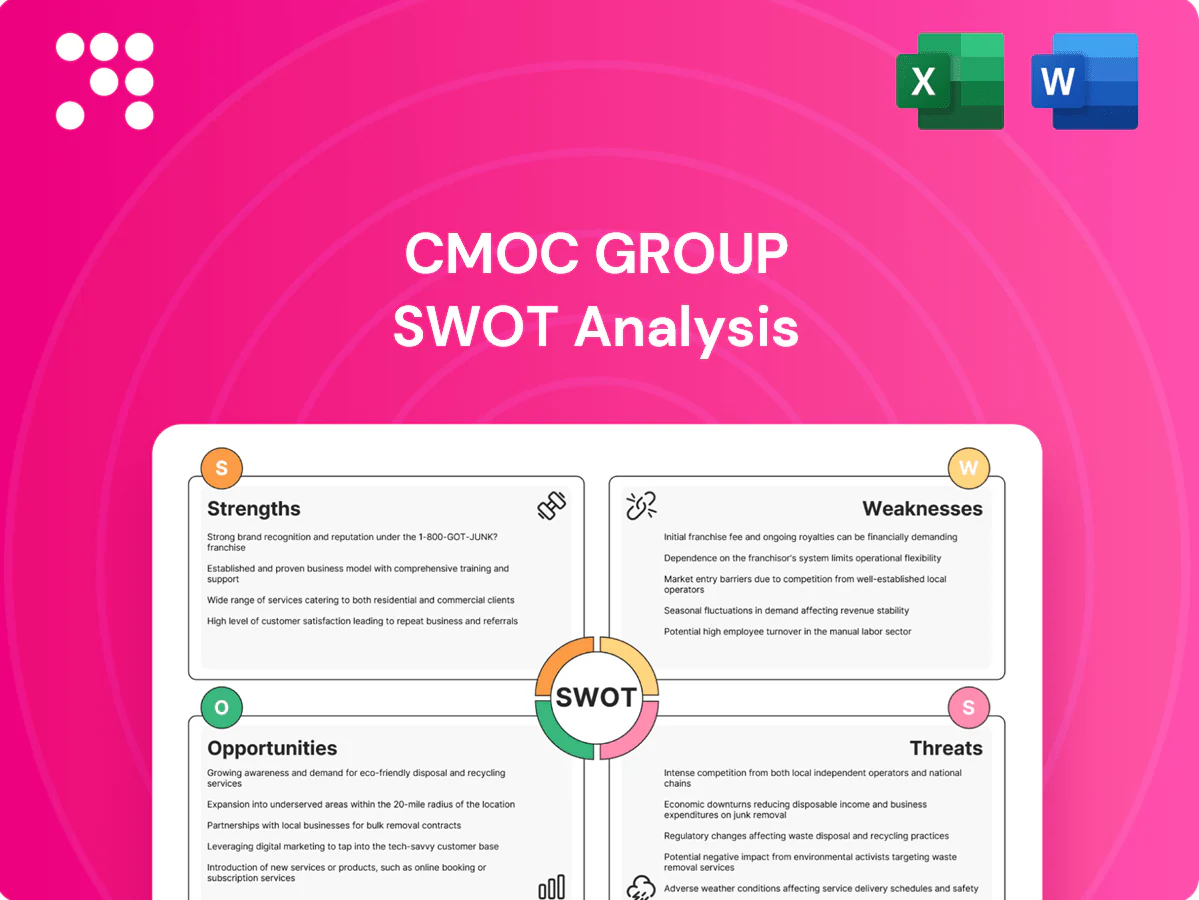
CMOC Group SWOT Analysis

Dive Deeper Into the Company’s Strategic Blueprint
CMOC Group’s SWOT analysis highlights strong lithium and cobalt positions, operational scale, and geopolitical exposure affecting raw-material supply and pricing. Understand competitive strengths, regulatory risks, and growth levers in concise, actionable terms. Purchase the full SWOT analysis for a professionally formatted Word report and editable Excel tools to plan, pitch, or invest with confidence.
Strengths

Diversified multi-commodity portfolio
CMOC’s exposure across copper, cobalt, molybdenum, tungsten, niobium and phosphates spreads revenue risk by linking cash flows to multiple commodity cycles. Different cycle timings can offset one another, stabilizing group cash generation through downturns. This commodity diversity underpins operational resilience and broadens capital-allocation optionality across growth, sustaining and hedge opportunities.
Tier-1 copper-cobalt scale in DRC
Flagship DRC assets Tenke Fungurume (TFM) and KFM position CMOC among top global EV/energy-transition suppliers; TFM reported ~175,000 t Cu and ~8,000 t Co attributable production in 2024 (CMOC 2024 report), high-grade resources support >20-year mine lives, scale drives lower unit costs and has attracted strategic offtake interest from battery and converter partners.

Vertical integration and marketing reach
Ownership of processing capacity plus strong marketing enabled CMOC to capture higher margins, supporting RMB 64.7 billion revenue in 2023. Integrated logistics and sales lift realizations versus benchmark prices by reducing time-to-market and treatment loss. Trading intelligence allows dynamic allocation across products and regions, cutting reliance on third-party processors and traders.

Cost competitiveness and process know-how
CMOC Group leverages deep operational experience in molybdenum-tungsten and niobium to ensure reliable technical execution across mines and processing plants.
Economies of scale and continuous improvement programs have driven lower unit costs, while blending and recovery optimization consistently lift metal yields and payable output.
Disciplined cost control and flexible mine plans provide downside protection during weak commodity cycles.
- Operational expertise: moly–W–Nb processing
- Scale-driven unit-cost edge
- Blending/recovery uplift yields
- Cost discipline cushions downturns
Global footprint and customer access
CMOC operates across China, the Democratic Republic of Congo and Brazil, giving it a three‑continent footprint that diversifies jurisdictional and customer exposure and supports resilient offtake to >80 industrial and battery customers.
- Three continents: China, DRC, Brazil
- Serves >80 industrial/battery customers
- Multiregional offtake reduces single‑market risk
- Closer to end‑markets improves logistics flexibility
Diversified base metals, integrated processing; RMB 64.7bn, DRC ~175k t Cu/~8k t Co
CMOC’s diversified portfolio (Cu, Co, Mo, W, Nb, P) and integrated processing/trading drive stable cash flow and margin capture; 2023 revenue RMB 64.7 billion. DRC flagship TFM/KFM underpin scale — ~175,000 t Cu and ~8,000 t Co attributable in 2024, >20-year lives. Three‑continent footprint serves >80 customers, supporting cost leadership and downside resilience.
| Metric | Value |
|---|---|
| 2023 Revenue | RMB 64.7bn |
| TFM 2024 Cu | ~175,000 t |
| TFM 2024 Co | ~8,000 t |
| Customers | >80 |
| Mine life | >20 years |
What is included in the product
 Detailed Word Document
Provides a concise SWOT analysis of CMOC Group, highlighting internal strengths and weaknesses and mapping external opportunities and threats to assess its competitive position, growth drivers, and strategic risks.

 Customizable Excel Spreadsheet
Provides a clear, editable SWOT matrix for CMOC Group to quickly align strategy and communicate priorities across stakeholders, enabling fast adaptation to shifting commodity markets and operational risks.
Weaknesses

Concentration in a few core assets
Revenue and cash flow remain heavily tied to DRC copper‑cobalt hubs, with the DRC producing roughly 70% of global cobalt supply, concentrating CMOC's commercial exposure. Outages or delays at Tenke and other DRC sites can materially dent results, as asset-level stoppages propagate across cash flow given scale. This amplifies asset-level risk and raises sensitivity to local disruptions, political instability, or infrastructure interruptions.
Exposure to high-risk jurisdictions
CMOC's heavy exposure to the Democratic Republic of Congo via the Tenke Fungurume and other emerging‑market assets concentrates political, regulatory and security risk in jurisdictions where mining disruptions are frequent. The DRC supplies roughly 70% of global cobalt, amplifying the impact of any changes to mining codes, taxes or export rules on CMOC's economics. Community disputes and permitting delays have historically postponed projects, while insurance and compliance costs in high‑risk jurisdictions remain materially elevated.

Commodity price volatility
Copper and cobalt prices are cyclical and can swing more than 20% year-on-year, causing CMOC earnings and cash flows to whipsaw and complicate multi-year capital planning. Hedging options are limited for some cobalt products and concentrate sales, leaving exposure to spot moves. In downcycles mining valuation multiples can compress by around 20–30%, tightening access to capital.

Infrastructure and logistics constraints
Inland transport, border bottlenecks and intermittent power reliability—DRC national electrification ~19% (World Bank 2020)—frequently disrupt CMOC flows in Central Africa, raising freight and demurrage that erode margins and inflate working capital needs.
- Logistics delays
- Higher freight/demurrage
- Increased working capital
- Delivery risk to customers
ESG scrutiny and compliance burden
Mining tailings, water use and community impacts place CMOC under intense oversight after high-profile failures like the 2019 Brumadinho disaster elevated tailings scrutiny; cobalt supply chains—with the DRC supplying about 70% of global cobalt—face heightened human-rights diligence. Meeting evolving ESG standards requires sustained capex and management attention, and any lapse risks material reputational and legal consequences.
- Tailings & water oversight increased post-2019
- DRC ≈70% of global cobalt
- Sustained capex/management focus required
- Any lapse → reputational/legal risk
DRC-heavy copper-cobalt exposure raises operational, price and ESG risk
Revenue and cash flow concentrated in DRC copper‑cobalt hubs (DRC ≈70% of global cobalt) heighten country and asset‑level risk; Tenke outages can materially dent results. Cyclical copper/cobalt pricing frequently swings >20% y/y, compressing earnings and capital access in downcycles. Elevated ESG, tailings and community oversight post‑2019 Brumadinho increases capex, compliance and reputational exposure.
| Metric | Value |
|---|---|
| DRC share of cobalt | ≈70% |
| Price volatility | >20% y/y |
| DRC electrification | ≈19% (World Bank 2020) |
| Tailings oversight | Increased since 2019 |
Same Document Delivered
CMOC Group SWOT Analysis
This is a real excerpt from the complete CMOC Group SWOT analysis you’ll receive upon purchase—no surprises, just professional quality. The preview below is taken directly from the full report. Buy now to unlock the editable, full-version file instantly.

Dive Deeper Into the Company’s Strategic Blueprint
CMOC Group’s SWOT analysis highlights strong lithium and cobalt positions, operational scale, and geopolitical exposure affecting raw-material supply and pricing. Understand competitive strengths, regulatory risks, and growth levers in concise, actionable terms. Purchase the full SWOT analysis for a professionally formatted Word report and editable Excel tools to plan, pitch, or invest with confidence.
Strengths
Diversified multi-commodity portfolio
CMOC’s exposure across copper, cobalt, molybdenum, tungsten, niobium and phosphates spreads revenue risk by linking cash flows to multiple commodity cycles. Different cycle timings can offset one another, stabilizing group cash generation through downturns. This commodity diversity underpins operational resilience and broadens capital-allocation optionality across growth, sustaining and hedge opportunities.
Tier-1 copper-cobalt scale in DRC
Flagship DRC assets Tenke Fungurume (TFM) and KFM position CMOC among top global EV/energy-transition suppliers; TFM reported ~175,000 t Cu and ~8,000 t Co attributable production in 2024 (CMOC 2024 report), high-grade resources support >20-year mine lives, scale drives lower unit costs and has attracted strategic offtake interest from battery and converter partners.
Vertical integration and marketing reach
Ownership of processing capacity plus strong marketing enabled CMOC to capture higher margins, supporting RMB 64.7 billion revenue in 2023. Integrated logistics and sales lift realizations versus benchmark prices by reducing time-to-market and treatment loss. Trading intelligence allows dynamic allocation across products and regions, cutting reliance on third-party processors and traders.
Cost competitiveness and process know-how
CMOC Group leverages deep operational experience in molybdenum-tungsten and niobium to ensure reliable technical execution across mines and processing plants.
Economies of scale and continuous improvement programs have driven lower unit costs, while blending and recovery optimization consistently lift metal yields and payable output.
Disciplined cost control and flexible mine plans provide downside protection during weak commodity cycles.
- Operational expertise: moly–W–Nb processing
- Scale-driven unit-cost edge
- Blending/recovery uplift yields
- Cost discipline cushions downturns
Global footprint and customer access
CMOC operates across China, the Democratic Republic of Congo and Brazil, giving it a three‑continent footprint that diversifies jurisdictional and customer exposure and supports resilient offtake to >80 industrial and battery customers.
- Three continents: China, DRC, Brazil
- Serves >80 industrial/battery customers
- Multiregional offtake reduces single‑market risk
- Closer to end‑markets improves logistics flexibility
Diversified base metals, integrated processing; RMB 64.7bn, DRC ~175k t Cu/~8k t Co
CMOC’s diversified portfolio (Cu, Co, Mo, W, Nb, P) and integrated processing/trading drive stable cash flow and margin capture; 2023 revenue RMB 64.7 billion. DRC flagship TFM/KFM underpin scale — ~175,000 t Cu and ~8,000 t Co attributable in 2024, >20-year lives. Three‑continent footprint serves >80 customers, supporting cost leadership and downside resilience.
| Metric | Value |
|---|---|
| 2023 Revenue | RMB 64.7bn |
| TFM 2024 Cu | ~175,000 t |
| TFM 2024 Co | ~8,000 t |
| Customers | >80 |
| Mine life | >20 years |
What is included in the product
Detailed Word Document
Provides a concise SWOT analysis of CMOC Group, highlighting internal strengths and weaknesses and mapping external opportunities and threats to assess its competitive position, growth drivers, and strategic risks.
Customizable Excel Spreadsheet
Provides a clear, editable SWOT matrix for CMOC Group to quickly align strategy and communicate priorities across stakeholders, enabling fast adaptation to shifting commodity markets and operational risks.
Weaknesses
Concentration in a few core assets
Revenue and cash flow remain heavily tied to DRC copper‑cobalt hubs, with the DRC producing roughly 70% of global cobalt supply, concentrating CMOC's commercial exposure. Outages or delays at Tenke and other DRC sites can materially dent results, as asset-level stoppages propagate across cash flow given scale. This amplifies asset-level risk and raises sensitivity to local disruptions, political instability, or infrastructure interruptions.
Exposure to high-risk jurisdictions
CMOC's heavy exposure to the Democratic Republic of Congo via the Tenke Fungurume and other emerging‑market assets concentrates political, regulatory and security risk in jurisdictions where mining disruptions are frequent. The DRC supplies roughly 70% of global cobalt, amplifying the impact of any changes to mining codes, taxes or export rules on CMOC's economics. Community disputes and permitting delays have historically postponed projects, while insurance and compliance costs in high‑risk jurisdictions remain materially elevated.
Commodity price volatility
Copper and cobalt prices are cyclical and can swing more than 20% year-on-year, causing CMOC earnings and cash flows to whipsaw and complicate multi-year capital planning. Hedging options are limited for some cobalt products and concentrate sales, leaving exposure to spot moves. In downcycles mining valuation multiples can compress by around 20–30%, tightening access to capital.
Infrastructure and logistics constraints
Inland transport, border bottlenecks and intermittent power reliability—DRC national electrification ~19% (World Bank 2020)—frequently disrupt CMOC flows in Central Africa, raising freight and demurrage that erode margins and inflate working capital needs.
- Logistics delays
- Higher freight/demurrage
- Increased working capital
- Delivery risk to customers
ESG scrutiny and compliance burden
Mining tailings, water use and community impacts place CMOC under intense oversight after high-profile failures like the 2019 Brumadinho disaster elevated tailings scrutiny; cobalt supply chains—with the DRC supplying about 70% of global cobalt—face heightened human-rights diligence. Meeting evolving ESG standards requires sustained capex and management attention, and any lapse risks material reputational and legal consequences.
- Tailings & water oversight increased post-2019
- DRC ≈70% of global cobalt
- Sustained capex/management focus required
- Any lapse → reputational/legal risk
DRC-heavy copper-cobalt exposure raises operational, price and ESG risk
Revenue and cash flow concentrated in DRC copper‑cobalt hubs (DRC ≈70% of global cobalt) heighten country and asset‑level risk; Tenke outages can materially dent results. Cyclical copper/cobalt pricing frequently swings >20% y/y, compressing earnings and capital access in downcycles. Elevated ESG, tailings and community oversight post‑2019 Brumadinho increases capex, compliance and reputational exposure.
| Metric | Value |
|---|---|
| DRC share of cobalt | ≈70% |
| Price volatility | >20% y/y |
| DRC electrification | ≈19% (World Bank 2020) |
| Tailings oversight | Increased since 2019 |
Same Document Delivered
CMOC Group SWOT Analysis
This is a real excerpt from the complete CMOC Group SWOT analysis you’ll receive upon purchase—no surprises, just professional quality. The preview below is taken directly from the full report. Buy now to unlock the editable, full-version file instantly.
Original: $10.00
-65%$10.00
$3.50Description
Dive Deeper Into the Company’s Strategic Blueprint
CMOC Group’s SWOT analysis highlights strong lithium and cobalt positions, operational scale, and geopolitical exposure affecting raw-material supply and pricing. Understand competitive strengths, regulatory risks, and growth levers in concise, actionable terms. Purchase the full SWOT analysis for a professionally formatted Word report and editable Excel tools to plan, pitch, or invest with confidence.
Strengths
Diversified multi-commodity portfolio
CMOC’s exposure across copper, cobalt, molybdenum, tungsten, niobium and phosphates spreads revenue risk by linking cash flows to multiple commodity cycles. Different cycle timings can offset one another, stabilizing group cash generation through downturns. This commodity diversity underpins operational resilience and broadens capital-allocation optionality across growth, sustaining and hedge opportunities.
Tier-1 copper-cobalt scale in DRC
Flagship DRC assets Tenke Fungurume (TFM) and KFM position CMOC among top global EV/energy-transition suppliers; TFM reported ~175,000 t Cu and ~8,000 t Co attributable production in 2024 (CMOC 2024 report), high-grade resources support >20-year mine lives, scale drives lower unit costs and has attracted strategic offtake interest from battery and converter partners.
Vertical integration and marketing reach
Ownership of processing capacity plus strong marketing enabled CMOC to capture higher margins, supporting RMB 64.7 billion revenue in 2023. Integrated logistics and sales lift realizations versus benchmark prices by reducing time-to-market and treatment loss. Trading intelligence allows dynamic allocation across products and regions, cutting reliance on third-party processors and traders.
Cost competitiveness and process know-how
CMOC Group leverages deep operational experience in molybdenum-tungsten and niobium to ensure reliable technical execution across mines and processing plants.
Economies of scale and continuous improvement programs have driven lower unit costs, while blending and recovery optimization consistently lift metal yields and payable output.
Disciplined cost control and flexible mine plans provide downside protection during weak commodity cycles.
- Operational expertise: moly–W–Nb processing
- Scale-driven unit-cost edge
- Blending/recovery uplift yields
- Cost discipline cushions downturns
Global footprint and customer access
CMOC operates across China, the Democratic Republic of Congo and Brazil, giving it a three‑continent footprint that diversifies jurisdictional and customer exposure and supports resilient offtake to >80 industrial and battery customers.
- Three continents: China, DRC, Brazil
- Serves >80 industrial/battery customers
- Multiregional offtake reduces single‑market risk
- Closer to end‑markets improves logistics flexibility
Diversified base metals, integrated processing; RMB 64.7bn, DRC ~175k t Cu/~8k t Co
CMOC’s diversified portfolio (Cu, Co, Mo, W, Nb, P) and integrated processing/trading drive stable cash flow and margin capture; 2023 revenue RMB 64.7 billion. DRC flagship TFM/KFM underpin scale — ~175,000 t Cu and ~8,000 t Co attributable in 2024, >20-year lives. Three‑continent footprint serves >80 customers, supporting cost leadership and downside resilience.
| Metric | Value |
|---|---|
| 2023 Revenue | RMB 64.7bn |
| TFM 2024 Cu | ~175,000 t |
| TFM 2024 Co | ~8,000 t |
| Customers | >80 |
| Mine life | >20 years |
What is included in the product
Detailed Word Document
Provides a concise SWOT analysis of CMOC Group, highlighting internal strengths and weaknesses and mapping external opportunities and threats to assess its competitive position, growth drivers, and strategic risks.
Customizable Excel Spreadsheet
Provides a clear, editable SWOT matrix for CMOC Group to quickly align strategy and communicate priorities across stakeholders, enabling fast adaptation to shifting commodity markets and operational risks.
Weaknesses
Concentration in a few core assets
Revenue and cash flow remain heavily tied to DRC copper‑cobalt hubs, with the DRC producing roughly 70% of global cobalt supply, concentrating CMOC's commercial exposure. Outages or delays at Tenke and other DRC sites can materially dent results, as asset-level stoppages propagate across cash flow given scale. This amplifies asset-level risk and raises sensitivity to local disruptions, political instability, or infrastructure interruptions.
Exposure to high-risk jurisdictions
CMOC's heavy exposure to the Democratic Republic of Congo via the Tenke Fungurume and other emerging‑market assets concentrates political, regulatory and security risk in jurisdictions where mining disruptions are frequent. The DRC supplies roughly 70% of global cobalt, amplifying the impact of any changes to mining codes, taxes or export rules on CMOC's economics. Community disputes and permitting delays have historically postponed projects, while insurance and compliance costs in high‑risk jurisdictions remain materially elevated.
Commodity price volatility
Copper and cobalt prices are cyclical and can swing more than 20% year-on-year, causing CMOC earnings and cash flows to whipsaw and complicate multi-year capital planning. Hedging options are limited for some cobalt products and concentrate sales, leaving exposure to spot moves. In downcycles mining valuation multiples can compress by around 20–30%, tightening access to capital.
Infrastructure and logistics constraints
Inland transport, border bottlenecks and intermittent power reliability—DRC national electrification ~19% (World Bank 2020)—frequently disrupt CMOC flows in Central Africa, raising freight and demurrage that erode margins and inflate working capital needs.
- Logistics delays
- Higher freight/demurrage
- Increased working capital
- Delivery risk to customers
ESG scrutiny and compliance burden
Mining tailings, water use and community impacts place CMOC under intense oversight after high-profile failures like the 2019 Brumadinho disaster elevated tailings scrutiny; cobalt supply chains—with the DRC supplying about 70% of global cobalt—face heightened human-rights diligence. Meeting evolving ESG standards requires sustained capex and management attention, and any lapse risks material reputational and legal consequences.
- Tailings & water oversight increased post-2019
- DRC ≈70% of global cobalt
- Sustained capex/management focus required
- Any lapse → reputational/legal risk
DRC-heavy copper-cobalt exposure raises operational, price and ESG risk
Revenue and cash flow concentrated in DRC copper‑cobalt hubs (DRC ≈70% of global cobalt) heighten country and asset‑level risk; Tenke outages can materially dent results. Cyclical copper/cobalt pricing frequently swings >20% y/y, compressing earnings and capital access in downcycles. Elevated ESG, tailings and community oversight post‑2019 Brumadinho increases capex, compliance and reputational exposure.
| Metric | Value |
|---|---|
| DRC share of cobalt | ≈70% |
| Price volatility | >20% y/y |
| DRC electrification | ≈19% (World Bank 2020) |
| Tailings oversight | Increased since 2019 |
Same Document Delivered
CMOC Group SWOT Analysis
This is a real excerpt from the complete CMOC Group SWOT analysis you’ll receive upon purchase—no surprises, just professional quality. The preview below is taken directly from the full report. Buy now to unlock the editable, full-version file instantly.











