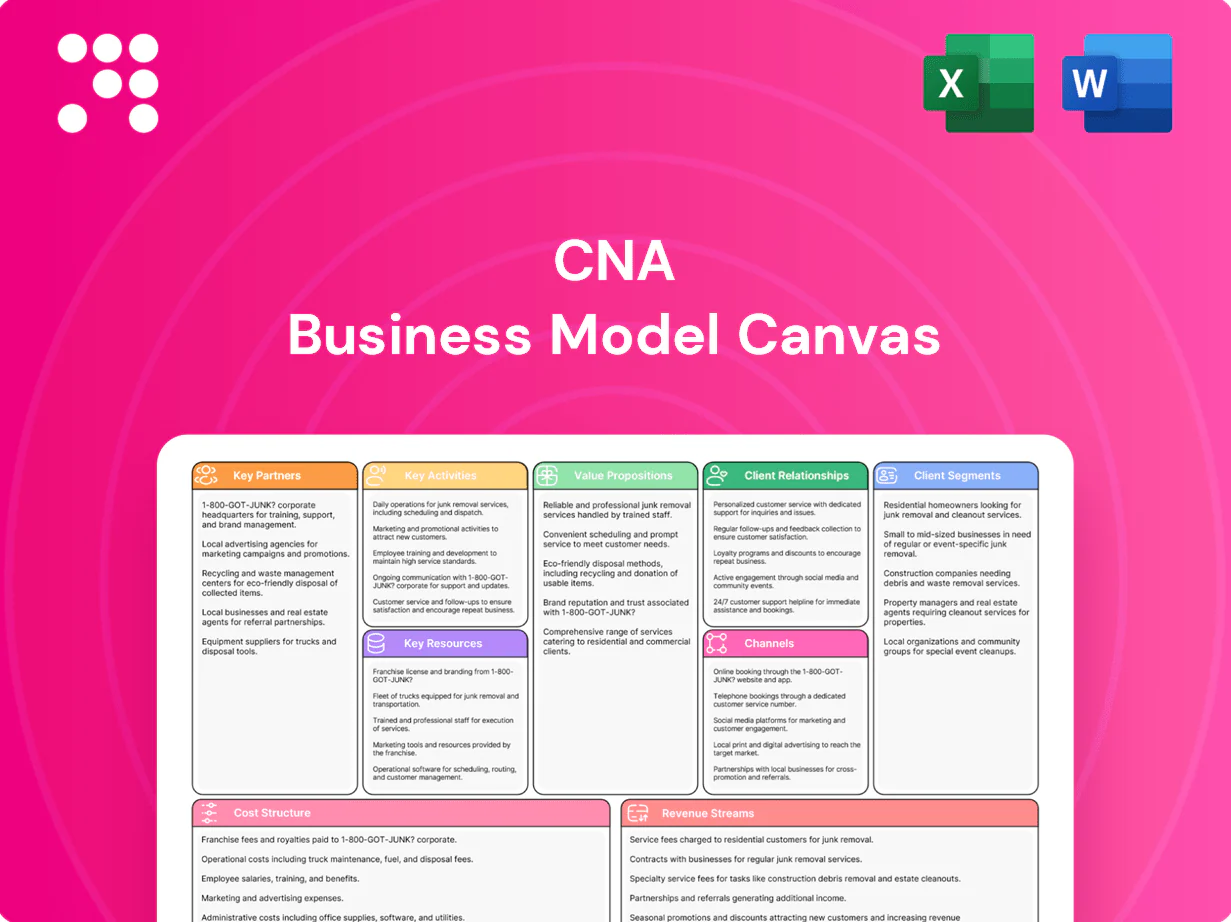
CNA Business Model Canvas

Unlock the strategic Business Model Canvas: value props, revenue, partners, cost drivers
Unlock CNA's strategic blueprint with our Business Model Canvas. This concise, company-specific canvas reveals value propositions, revenue streams, partnerships and cost drivers to show how CNA competes and scales. Ideal for investors, advisors and founders seeking actionable insights—download the full Word/Excel pack to apply these lessons to your strategy.
Partnerships

Brokers and Agents
Independent brokers and agents extend CNA's market reach and place risks efficiently, supplying client insight that enables tailored coverage and pricing. Strong broker partnerships in 2024 drove submission flow and retention, while co-marketing and aligned service standards improved placement speed and hit ratios. These relationships remain central to CNA's distribution strategy.
Reinsurers
Global reinsurers provide capacity, volatility smoothing and capital efficiency for CNA; as of 2024 global reinsurance capacity is roughly USD 650bn, enabling larger risk transfer and lower economic capital needs. Treaty and facultative arrangements support CNA’s large or complex risks while reinsurance analytics improve portfolio steering and catastrophe management. Long-term panels promote pricing stability across cycles.

TPAs and Adjusters
Third-party administrators and adjusting networks scale CNA’s claims handling, supporting volume peaks and specialty lines; industry analyses in 2024 found outsourced claims operations can cut cycle times by up to 30% and lower operating costs ~20%. They provide specialized expertise for complex, multi-jurisdictional losses and large commercial accounts. Service-level agreements enforce timeliness and quality outcomes, while secure data sharing tightens reserving accuracy and boosts customer satisfaction.

Insurtech & Data Vendors
Insurtech and data vendors supply external data, advanced modeling, and AI tools that sharpen underwriting and fraud detection, enabling faster, more accurate risk scoring and claims triage.
Telematics, geospatial feeds, and third-party enrichment improve risk selection and loss forecasting, while API integrations accelerate quoting and servicing workflows and lower cycle times.
Continuous model updates and real-time scoring sustain pricing adequacy and competitiveness in rapidly shifting risk environments.
- data: external AI models for underwriting
- telematics: improved selection
- api: faster quotes/servicing
- continuous: dynamic pricing
Risk Engineering Alliances
Safety consultants and engineering partners expand CNA loss-control capabilities, delivering onsite hazard assessments and preventive programs; industry studies report loss-frequency reductions of 15–30% and severity declines of 10–25% from targeted interventions. Joint programs with clients in 2024 focused on high-hazard sectors and helped lower claim incidence while enabling ROI tracking through shared analytics. Certifications like ISO 45001 and sector-specific credentials boost credibility in manufacturing and construction and feed continuous preventive recommendations.
- Partners: safety consultants, engineering firms, cert bodies
- Impact: 15–30% frequency, 10–25% severity reductions
- 2024 focus: high-hazard sectors, analytics-driven ROI tracking
- Credibility: ISO 45001 and industry-specific certifications
Partner network drives distribution, capacity (USD 650bn) & faster claims
Independent brokers, reinsurers (2024 capacity ~USD 650bn), insurtech/data vendors, TPAs (cycle time -30%, ops cost -20%), telematics/API providers, and safety consultants (freq -15–30%, sev -10–25%) collectively expand distribution, capacity, analytics, speed and loss control for CNA.
| Partner | Role | 2024 Impact |
|---|---|---|
| Brokers | Distribution | Higher retention/placement |
| Reinsurers | Capacity | ~USD 650bn capacity |
| TPAs | Claims scale | -30% cycle, -20% cost |
| Insurtech | Analytics | Faster scoring/triage |
| Safety consultants | Loss control | -15–30% freq, -10–25% sev |
What is included in the product
 Detailed Word Document
A comprehensive, pre-written Business Model Canvas for CNA that maps the company’s nine BMC blocks—customer segments, value propositions, channels, relationships, revenue streams, key resources, activities, partners, and cost structure—into a cohesive strategy. Includes competitive-advantage analysis, SWOT linkage, polished narrative, and investor-ready presentation support.

 Customizable Excel Spreadsheet
Editable one-page CNA Business Model Canvas that condenses strategy into a digestible snapshot, saving hours of formatting and making it easy to compare models, collaborate with teams, or prepare board-ready summaries.
Activities

Underwriting & Pricing
Underwriting & Pricing drive CNA profitability through rigorous risk assessment, coverage design, and rate adequacy, with the company managing roughly $60 billion in invested assets to support underwriting capacity. Segment and exposure analytics direct selection and limits, improving loss pick accuracy by portfolio. Governance enforces underwriting guidelines and referral discipline, while continuous calibration aligns pricing with observed loss trends and inflation.
Claims Management
Triage, investigation and timely settlement anchor customer trust and improve loss ratios by reducing claim escalation; litigation management and aggressive subrogation preserve margins and recoverables; fraud detection—industry estimates 2024 fraud losses near $80 billion—cuts leakage and volatility; digital FNOL accelerates cycle times and transparency, with many carriers reporting up to 40% faster processing.

Risk Control Services
Onsite and virtual assessments identify hazards and mitigations across operations, feeding targeted training, protocols, and sensor rollouts that aim to reduce claim frequency; OSHA notes safety programs can cut injury and illness costs roughly 20–40%. Benchmarking quantifies impact for clients and underwriters, linking interventions to measurable loss-rate changes. Continuous feedback loops refine underwriting and renewal strategy based on performance data.

Portfolio & Reinsurance
Catastrophe modeling and aggregation monitoring manage tail risk by quantifying exposures across portfolios and informing capital buffers; reinsurance placement optimizes capital and earnings stability through layered treaties and quota-share structures. Mix-shift and rate monitoring support target returns by adjusting book composition and pricing, while scenario testing informs steering and appetite resets based on stress outcomes.
- Cat modeling: exposure aggregation
- Reinsurance: capital/earnings stability
- Mix-shift: return optimization
- Scenario tests: appetite reset
Distribution & Relationships
Broker engagement, co-selling and disciplined pipeline management drive CNA growth by widening reach and improving conversion through partner-led referrals and joint account strategies.
Firm service standards and fast responsiveness increase win rates, while marketing and thought leadership create buyer pull; portal tools reduce quotes-to-bind time and ease doing business.
- Broker-led distribution
- Co-selling collaboration
- Pipeline discipline
- Service SLAs & responsiveness
- Marketing-driven demand
- Digital portals for speed
Underwriting with $60B capacity; claims 40% faster
Underwriting & pricing: rigorous risk selection, $60 billion invested assets supporting capacity and dynamic rate calibration.
Claims & SIU: rapid FNOL and settlement (up to 40% faster) with fraud mitigation addressing industry ~80 billion 2024 leakage.
Loss control & cat: safety programs cut claim costs 20–40%; cat modeling, aggregation and reinsurance preserve capital and earnings stability.
| Activity | KPI | 2024 Metric |
|---|---|---|
| Underwriting | Invested assets | $60B |
| Claims | FNOL speed | up to 40% faster |
| Fraud | Industry loss | $80B |
| Loss control | Cost reduction | 20–40% |
Full Version Awaits
Business Model Canvas
The CNA Business Model Canvas you’re previewing is the actual deliverable, not a mockup or summary—it's a direct snapshot of the file you'll receive after purchase. When you complete your order, you'll get this same document in full, ready-to-edit Word and Excel formats. No placeholders, no surprises—what you see here is what you'll own.

Unlock the strategic Business Model Canvas: value props, revenue, partners, cost drivers
Unlock CNA's strategic blueprint with our Business Model Canvas. This concise, company-specific canvas reveals value propositions, revenue streams, partnerships and cost drivers to show how CNA competes and scales. Ideal for investors, advisors and founders seeking actionable insights—download the full Word/Excel pack to apply these lessons to your strategy.
Partnerships
Brokers and Agents
Independent brokers and agents extend CNA's market reach and place risks efficiently, supplying client insight that enables tailored coverage and pricing. Strong broker partnerships in 2024 drove submission flow and retention, while co-marketing and aligned service standards improved placement speed and hit ratios. These relationships remain central to CNA's distribution strategy.
Reinsurers
Global reinsurers provide capacity, volatility smoothing and capital efficiency for CNA; as of 2024 global reinsurance capacity is roughly USD 650bn, enabling larger risk transfer and lower economic capital needs. Treaty and facultative arrangements support CNA’s large or complex risks while reinsurance analytics improve portfolio steering and catastrophe management. Long-term panels promote pricing stability across cycles.
TPAs and Adjusters
Third-party administrators and adjusting networks scale CNA’s claims handling, supporting volume peaks and specialty lines; industry analyses in 2024 found outsourced claims operations can cut cycle times by up to 30% and lower operating costs ~20%. They provide specialized expertise for complex, multi-jurisdictional losses and large commercial accounts. Service-level agreements enforce timeliness and quality outcomes, while secure data sharing tightens reserving accuracy and boosts customer satisfaction.
Insurtech & Data Vendors
Insurtech and data vendors supply external data, advanced modeling, and AI tools that sharpen underwriting and fraud detection, enabling faster, more accurate risk scoring and claims triage.
Telematics, geospatial feeds, and third-party enrichment improve risk selection and loss forecasting, while API integrations accelerate quoting and servicing workflows and lower cycle times.
Continuous model updates and real-time scoring sustain pricing adequacy and competitiveness in rapidly shifting risk environments.
- data: external AI models for underwriting
- telematics: improved selection
- api: faster quotes/servicing
- continuous: dynamic pricing
Risk Engineering Alliances
Safety consultants and engineering partners expand CNA loss-control capabilities, delivering onsite hazard assessments and preventive programs; industry studies report loss-frequency reductions of 15–30% and severity declines of 10–25% from targeted interventions. Joint programs with clients in 2024 focused on high-hazard sectors and helped lower claim incidence while enabling ROI tracking through shared analytics. Certifications like ISO 45001 and sector-specific credentials boost credibility in manufacturing and construction and feed continuous preventive recommendations.
- Partners: safety consultants, engineering firms, cert bodies
- Impact: 15–30% frequency, 10–25% severity reductions
- 2024 focus: high-hazard sectors, analytics-driven ROI tracking
- Credibility: ISO 45001 and industry-specific certifications
Partner network drives distribution, capacity (USD 650bn) & faster claims
Independent brokers, reinsurers (2024 capacity ~USD 650bn), insurtech/data vendors, TPAs (cycle time -30%, ops cost -20%), telematics/API providers, and safety consultants (freq -15–30%, sev -10–25%) collectively expand distribution, capacity, analytics, speed and loss control for CNA.
| Partner | Role | 2024 Impact |
|---|---|---|
| Brokers | Distribution | Higher retention/placement |
| Reinsurers | Capacity | ~USD 650bn capacity |
| TPAs | Claims scale | -30% cycle, -20% cost |
| Insurtech | Analytics | Faster scoring/triage |
| Safety consultants | Loss control | -15–30% freq, -10–25% sev |
What is included in the product
Detailed Word Document
A comprehensive, pre-written Business Model Canvas for CNA that maps the company’s nine BMC blocks—customer segments, value propositions, channels, relationships, revenue streams, key resources, activities, partners, and cost structure—into a cohesive strategy. Includes competitive-advantage analysis, SWOT linkage, polished narrative, and investor-ready presentation support.
Customizable Excel Spreadsheet
Editable one-page CNA Business Model Canvas that condenses strategy into a digestible snapshot, saving hours of formatting and making it easy to compare models, collaborate with teams, or prepare board-ready summaries.
Activities
Underwriting & Pricing
Underwriting & Pricing drive CNA profitability through rigorous risk assessment, coverage design, and rate adequacy, with the company managing roughly $60 billion in invested assets to support underwriting capacity. Segment and exposure analytics direct selection and limits, improving loss pick accuracy by portfolio. Governance enforces underwriting guidelines and referral discipline, while continuous calibration aligns pricing with observed loss trends and inflation.
Claims Management
Triage, investigation and timely settlement anchor customer trust and improve loss ratios by reducing claim escalation; litigation management and aggressive subrogation preserve margins and recoverables; fraud detection—industry estimates 2024 fraud losses near $80 billion—cuts leakage and volatility; digital FNOL accelerates cycle times and transparency, with many carriers reporting up to 40% faster processing.
Risk Control Services
Onsite and virtual assessments identify hazards and mitigations across operations, feeding targeted training, protocols, and sensor rollouts that aim to reduce claim frequency; OSHA notes safety programs can cut injury and illness costs roughly 20–40%. Benchmarking quantifies impact for clients and underwriters, linking interventions to measurable loss-rate changes. Continuous feedback loops refine underwriting and renewal strategy based on performance data.
Portfolio & Reinsurance
Catastrophe modeling and aggregation monitoring manage tail risk by quantifying exposures across portfolios and informing capital buffers; reinsurance placement optimizes capital and earnings stability through layered treaties and quota-share structures. Mix-shift and rate monitoring support target returns by adjusting book composition and pricing, while scenario testing informs steering and appetite resets based on stress outcomes.
- Cat modeling: exposure aggregation
- Reinsurance: capital/earnings stability
- Mix-shift: return optimization
- Scenario tests: appetite reset
Distribution & Relationships
Broker engagement, co-selling and disciplined pipeline management drive CNA growth by widening reach and improving conversion through partner-led referrals and joint account strategies.
Firm service standards and fast responsiveness increase win rates, while marketing and thought leadership create buyer pull; portal tools reduce quotes-to-bind time and ease doing business.
- Broker-led distribution
- Co-selling collaboration
- Pipeline discipline
- Service SLAs & responsiveness
- Marketing-driven demand
- Digital portals for speed
Underwriting with $60B capacity; claims 40% faster
Underwriting & pricing: rigorous risk selection, $60 billion invested assets supporting capacity and dynamic rate calibration.
Claims & SIU: rapid FNOL and settlement (up to 40% faster) with fraud mitigation addressing industry ~80 billion 2024 leakage.
Loss control & cat: safety programs cut claim costs 20–40%; cat modeling, aggregation and reinsurance preserve capital and earnings stability.
| Activity | KPI | 2024 Metric |
|---|---|---|
| Underwriting | Invested assets | $60B |
| Claims | FNOL speed | up to 40% faster |
| Fraud | Industry loss | $80B |
| Loss control | Cost reduction | 20–40% |
Full Version Awaits
Business Model Canvas
The CNA Business Model Canvas you’re previewing is the actual deliverable, not a mockup or summary—it's a direct snapshot of the file you'll receive after purchase. When you complete your order, you'll get this same document in full, ready-to-edit Word and Excel formats. No placeholders, no surprises—what you see here is what you'll own.
Description
Unlock the strategic Business Model Canvas: value props, revenue, partners, cost drivers
Unlock CNA's strategic blueprint with our Business Model Canvas. This concise, company-specific canvas reveals value propositions, revenue streams, partnerships and cost drivers to show how CNA competes and scales. Ideal for investors, advisors and founders seeking actionable insights—download the full Word/Excel pack to apply these lessons to your strategy.
Partnerships
Brokers and Agents
Independent brokers and agents extend CNA's market reach and place risks efficiently, supplying client insight that enables tailored coverage and pricing. Strong broker partnerships in 2024 drove submission flow and retention, while co-marketing and aligned service standards improved placement speed and hit ratios. These relationships remain central to CNA's distribution strategy.
Reinsurers
Global reinsurers provide capacity, volatility smoothing and capital efficiency for CNA; as of 2024 global reinsurance capacity is roughly USD 650bn, enabling larger risk transfer and lower economic capital needs. Treaty and facultative arrangements support CNA’s large or complex risks while reinsurance analytics improve portfolio steering and catastrophe management. Long-term panels promote pricing stability across cycles.
TPAs and Adjusters
Third-party administrators and adjusting networks scale CNA’s claims handling, supporting volume peaks and specialty lines; industry analyses in 2024 found outsourced claims operations can cut cycle times by up to 30% and lower operating costs ~20%. They provide specialized expertise for complex, multi-jurisdictional losses and large commercial accounts. Service-level agreements enforce timeliness and quality outcomes, while secure data sharing tightens reserving accuracy and boosts customer satisfaction.
Insurtech & Data Vendors
Insurtech and data vendors supply external data, advanced modeling, and AI tools that sharpen underwriting and fraud detection, enabling faster, more accurate risk scoring and claims triage.
Telematics, geospatial feeds, and third-party enrichment improve risk selection and loss forecasting, while API integrations accelerate quoting and servicing workflows and lower cycle times.
Continuous model updates and real-time scoring sustain pricing adequacy and competitiveness in rapidly shifting risk environments.
- data: external AI models for underwriting
- telematics: improved selection
- api: faster quotes/servicing
- continuous: dynamic pricing
Risk Engineering Alliances
Safety consultants and engineering partners expand CNA loss-control capabilities, delivering onsite hazard assessments and preventive programs; industry studies report loss-frequency reductions of 15–30% and severity declines of 10–25% from targeted interventions. Joint programs with clients in 2024 focused on high-hazard sectors and helped lower claim incidence while enabling ROI tracking through shared analytics. Certifications like ISO 45001 and sector-specific credentials boost credibility in manufacturing and construction and feed continuous preventive recommendations.
- Partners: safety consultants, engineering firms, cert bodies
- Impact: 15–30% frequency, 10–25% severity reductions
- 2024 focus: high-hazard sectors, analytics-driven ROI tracking
- Credibility: ISO 45001 and industry-specific certifications
Partner network drives distribution, capacity (USD 650bn) & faster claims
Independent brokers, reinsurers (2024 capacity ~USD 650bn), insurtech/data vendors, TPAs (cycle time -30%, ops cost -20%), telematics/API providers, and safety consultants (freq -15–30%, sev -10–25%) collectively expand distribution, capacity, analytics, speed and loss control for CNA.
| Partner | Role | 2024 Impact |
|---|---|---|
| Brokers | Distribution | Higher retention/placement |
| Reinsurers | Capacity | ~USD 650bn capacity |
| TPAs | Claims scale | -30% cycle, -20% cost |
| Insurtech | Analytics | Faster scoring/triage |
| Safety consultants | Loss control | -15–30% freq, -10–25% sev |
What is included in the product
Detailed Word Document
A comprehensive, pre-written Business Model Canvas for CNA that maps the company’s nine BMC blocks—customer segments, value propositions, channels, relationships, revenue streams, key resources, activities, partners, and cost structure—into a cohesive strategy. Includes competitive-advantage analysis, SWOT linkage, polished narrative, and investor-ready presentation support.
Customizable Excel Spreadsheet
Editable one-page CNA Business Model Canvas that condenses strategy into a digestible snapshot, saving hours of formatting and making it easy to compare models, collaborate with teams, or prepare board-ready summaries.
Activities
Underwriting & Pricing
Underwriting & Pricing drive CNA profitability through rigorous risk assessment, coverage design, and rate adequacy, with the company managing roughly $60 billion in invested assets to support underwriting capacity. Segment and exposure analytics direct selection and limits, improving loss pick accuracy by portfolio. Governance enforces underwriting guidelines and referral discipline, while continuous calibration aligns pricing with observed loss trends and inflation.
Claims Management
Triage, investigation and timely settlement anchor customer trust and improve loss ratios by reducing claim escalation; litigation management and aggressive subrogation preserve margins and recoverables; fraud detection—industry estimates 2024 fraud losses near $80 billion—cuts leakage and volatility; digital FNOL accelerates cycle times and transparency, with many carriers reporting up to 40% faster processing.
Risk Control Services
Onsite and virtual assessments identify hazards and mitigations across operations, feeding targeted training, protocols, and sensor rollouts that aim to reduce claim frequency; OSHA notes safety programs can cut injury and illness costs roughly 20–40%. Benchmarking quantifies impact for clients and underwriters, linking interventions to measurable loss-rate changes. Continuous feedback loops refine underwriting and renewal strategy based on performance data.
Portfolio & Reinsurance
Catastrophe modeling and aggregation monitoring manage tail risk by quantifying exposures across portfolios and informing capital buffers; reinsurance placement optimizes capital and earnings stability through layered treaties and quota-share structures. Mix-shift and rate monitoring support target returns by adjusting book composition and pricing, while scenario testing informs steering and appetite resets based on stress outcomes.
- Cat modeling: exposure aggregation
- Reinsurance: capital/earnings stability
- Mix-shift: return optimization
- Scenario tests: appetite reset
Distribution & Relationships
Broker engagement, co-selling and disciplined pipeline management drive CNA growth by widening reach and improving conversion through partner-led referrals and joint account strategies.
Firm service standards and fast responsiveness increase win rates, while marketing and thought leadership create buyer pull; portal tools reduce quotes-to-bind time and ease doing business.
- Broker-led distribution
- Co-selling collaboration
- Pipeline discipline
- Service SLAs & responsiveness
- Marketing-driven demand
- Digital portals for speed
Underwriting with $60B capacity; claims 40% faster
Underwriting & pricing: rigorous risk selection, $60 billion invested assets supporting capacity and dynamic rate calibration.
Claims & SIU: rapid FNOL and settlement (up to 40% faster) with fraud mitigation addressing industry ~80 billion 2024 leakage.
Loss control & cat: safety programs cut claim costs 20–40%; cat modeling, aggregation and reinsurance preserve capital and earnings stability.
| Activity | KPI | 2024 Metric |
|---|---|---|
| Underwriting | Invested assets | $60B |
| Claims | FNOL speed | up to 40% faster |
| Fraud | Industry loss | $80B |
| Loss control | Cost reduction | 20–40% |
Full Version Awaits
Business Model Canvas
The CNA Business Model Canvas you’re previewing is the actual deliverable, not a mockup or summary—it's a direct snapshot of the file you'll receive after purchase. When you complete your order, you'll get this same document in full, ready-to-edit Word and Excel formats. No placeholders, no surprises—what you see here is what you'll own.











