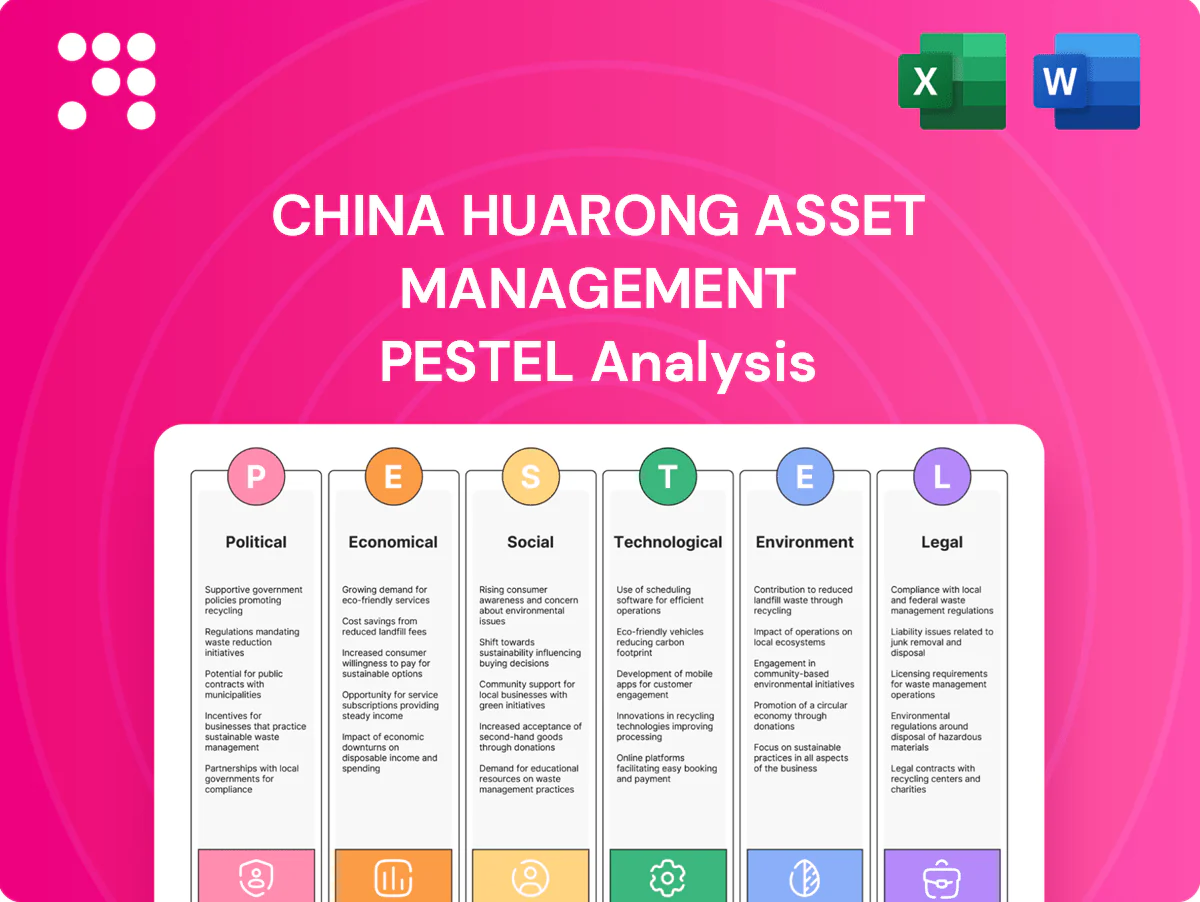
China Huarong Asset Management PESTLE Analysis

Make Smarter Strategic Decisions with a Complete PESTEL View
Our PESTLE analysis pinpoints how political oversight, economic cycles, regulatory reform and ESG pressures are reshaping China Huarong Asset Management’s risk profile and growth prospects; it also highlights technology-driven operational shifts and legal exposure. For strategic recommendations and the full data-backed breakdown, download the complete PESTLE report now.
Political factors

State ownership & policy alignment
As a central state-owned asset manager, China Huarong must execute government directives that prioritize national financial stability and systemic risk containment. Strategic goals align with Party and State Council priorities such as SOE reform and deleveraging, with Huarong reporting total assets of about RMB 2.7 trillion at end-2023. Policy alignment secures implicit state support but limits pure commercial autonomy, and execution speed often hinges on policy signals and ministerial coordination.
Macro-prudential mandates
Authorities have long used four state AMCs (established 1999) to absorb systemic stress from banks and the property sector, and Huarong remains central to these policy tools. Campaigns to cut NPLs and clean up shadow banking drive Huarong's portfolio mix, producing countercyclical deal flow but with policy-driven pricing. Post-2023 state-led restructuring reinforced KPIs prioritizing risk mitigation over short-term profit.

Government backstop expectations
Market participants often assume partial state support for Huarong, lowering funding costs but inviting moral-hazard scrutiny from regulators and investors; during China’s 2023 property stress, SOE bond spreads widened roughly 100–200 bps, illustrating sensitivity to perceived backing. Any official shift in support posture can move Huarong’s credit spreads and narrow or close refinancing windows within weeks. Discipline in communications with policymakers and markets is critical to stabilize spreads and access to liquidity.

Deleveraging and risk campaigns
Periodic deleveraging drives, dating from the 2020 three red lines for developers, repeatedly compress credit supply and reshape distressed-asset flows; Huarong must shift sourcing as regulators tighten real-estate and platform lending corridors. Compliance with PBOC/CBIRC window guidance slows capital deployment and alters resolution pacing, while campaign intensity directly lengthens recovery timelines and prompts more conservative borrower behavior—as seen after the Evergrande collapse (about 1.97 trillion yuan liabilities).
- Regulatory tag: three red lines (2020)
- Market impact: tighter real-estate lending
- Operational: slower capital deployment under window guidance
- Behavioral: longer recoveries, conservative borrowers
Geopolitics & sanctions exposure
US–China tensions have tightened Huarong’s access to offshore capital and weighed on investor appetite after expanded US export controls (Oct 2022 onward) and broader trade measures; sanctions-screening and export-control spillovers raise due-diligence costs in restructurings and increase counterparty risk, while cross-border workouts face added regulatory frictions. Diversifying funding and counterparties reduces political-risk concentration.
- Higher compliance burden: export-control expansions since 2022
- Raised counterparty risk in offshore markets
- Cross-border regulatory frictions in workouts
- Mitigation: diversify funding and counterparties
State-owned AMC pivots to NPL cleanup; assets RMB 2.7tn
As a central state-owned AMC, Huarong executes Party/State Council directives prioritizing systemic stability and SOE reform, limiting pure commercial autonomy; reported total assets ~RMB 2.7 trillion at end-2023. Policy campaigns (three red lines, 2020) and post-2023 restructuring steer deal flow toward NPL cleanup, slowing capital deployment. Perceived state backing narrows funding costs but leaves credit spreads sensitive, widening ~100–200 bps in 2023.
| Indicator | Value |
|---|---|
| Total assets (Huarong, end-2023) | RMB 2.7 trillion |
| Evergrande liabilities (2021) | RMB 1.97 trillion |
| SOE AMCs established | 1999 (4 AMCs) |
| SOE bond spread move (2023) | ~100–200 bps |
What is included in the product
 Detailed Word Document
Explores how macro-environmental forces—Political, Economic, Social, Technological, Environmental, and Legal—uniquely shape China Huarong Asset Management, with each section grounded in current data and trends to reveal risks, opportunities, and forward-looking scenarios; designed for executives and investors to inform strategy, compliance, and funding decisions.

 Customizable Excel Spreadsheet
A concise, PESTLE-segmented summary of China Huarong Asset Management that simplifies regulatory, economic, and governance risks for quick inclusion in briefs or presentations, shareable across teams to align on external threats and strategic positioning.
Economic factors

Property downturn & NPL inflows
Stress among developers and supply chains has elevated distressed-asset supply, with real estate and related sectors contributing roughly 25% of China’s GDP, amplifying systemic exposure. Collateral values for land and housing determine recovery prospects as prices remain under pressure in many second- and third-tier cities. Workouts depend on local market absorption and 2024 policy easing (targeted rate cuts and purchase-relaxation). Timing entries around stabilization protects IRR.
Credit cycle & recovery rates
Recoveries for Huarong historically track China GDP and corporate earnings—China grew 5.2% in 2023 and IMF projected ~4.8% for 2024—while secondary-market liquidity drives exit multiples; in downturns liquidation values fall and time-to-resolution commonly lengthens, reducing recoveries, whereas economic rebounds improve restructuring feasibility and lift exit multiples; scenario analysis therefore calibrates bid pricing and provisioning.

Rates, spreads, and funding costs
Policy rate shifts—China 1-year LPR at 3.45% and 10-year CGB around 2.7% (July 2025)—directly affect Huarong’s carry and deal hurdle rates, as lower rates cut funding costs but compress asset yields. Credit spread widening (EM/onsumer/real-estate spreads up 50–150bp in stress episodes) forces higher required returns and marks down valuations. Active liability-duration management is essential to match funding with long-dated workout assets.

RMB and offshore financing
RMB volatility between about 6.7–7.3 USD/CNY in 2023–24 has raised USD bond servicing costs and complicated offshore debt recovery for Huarong, increasing default conversion risk.
Higher hedging premiums have reduced cross-border project IRRs; access to Hong Kong CNH pools and onshore interbank liquidity—backed by China’s roughly $3.2tn FX reserves (end‑2024)—is critical, and currency mismatches demand disciplined ALM.
- Exchange-rate range: 6.7–7.3 USD/CNY
- FX reserves: $3.2tn (end‑2024)
- Hedging raises IRR sensitivity
- Require strict ALM for currency mismatches
Asset market liquidity swings
In stressed periods bid–ask gaps for distressed loans and collateral can widen to 5–15 percentage points, slowing disposals and extending Huarong inventory turnover; policy-driven liquidity injections by the PBOC and Ministry of Finance since 2022 have intermittently reopened exit channels. Auction platforms and bulk-sales outcomes hinge on buyer risk appetite, while timing and tranche design materially accelerate clearance.
- Bid–ask gaps: 5–15pp
- Policy injections: PBOC/MOF support since 2022
- Sales channels: auctions vs bulk depend on buyer appetite
- Levers: timing and tranche design to clear stock
State-owned AMC pivots to NPL cleanup; assets RMB 2.7tn
Real-estate distress (~25% of GDP) raises distressed-asset supply and ties recoveries to local market absorption and policy easing. Funding costs and valuations are set by 1-year LPR 3.45% and 10y CGB ~2.7% (Jul 2025); FX swings (6.7–7.3 USD/CNY) and $3.2tn FX reserves (end‑2024) drive hedging needs and ALM. Bid–ask gaps 5–15pp slow exits; timing and tranche design key to clear stock.
| Metric | Value |
|---|---|
| Real‑estate share of GDP | ~25% |
| 1y LPR | 3.45% |
| 10y CGB | ~2.7% (Jul 2025) |
| USD/CNY range | 6.7–7.3 |
| FX reserves | $3.2tn (end‑2024) |
| Bid–ask gaps | 5–15pp |
What You See Is What You Get
China Huarong Asset Management PESTLE Analysis
The China Huarong Asset Management PESTLE Analysis preview shown here is the exact document you’ll receive after purchase—fully formatted and ready to use. This is a real screenshot of the product you’re buying, with no placeholders or teasers. The layout, content, and structure visible here are exactly what you’ll download immediately after payment.

Make Smarter Strategic Decisions with a Complete PESTEL View
Our PESTLE analysis pinpoints how political oversight, economic cycles, regulatory reform and ESG pressures are reshaping China Huarong Asset Management’s risk profile and growth prospects; it also highlights technology-driven operational shifts and legal exposure. For strategic recommendations and the full data-backed breakdown, download the complete PESTLE report now.
Political factors
State ownership & policy alignment
As a central state-owned asset manager, China Huarong must execute government directives that prioritize national financial stability and systemic risk containment. Strategic goals align with Party and State Council priorities such as SOE reform and deleveraging, with Huarong reporting total assets of about RMB 2.7 trillion at end-2023. Policy alignment secures implicit state support but limits pure commercial autonomy, and execution speed often hinges on policy signals and ministerial coordination.
Macro-prudential mandates
Authorities have long used four state AMCs (established 1999) to absorb systemic stress from banks and the property sector, and Huarong remains central to these policy tools. Campaigns to cut NPLs and clean up shadow banking drive Huarong's portfolio mix, producing countercyclical deal flow but with policy-driven pricing. Post-2023 state-led restructuring reinforced KPIs prioritizing risk mitigation over short-term profit.
Government backstop expectations
Market participants often assume partial state support for Huarong, lowering funding costs but inviting moral-hazard scrutiny from regulators and investors; during China’s 2023 property stress, SOE bond spreads widened roughly 100–200 bps, illustrating sensitivity to perceived backing. Any official shift in support posture can move Huarong’s credit spreads and narrow or close refinancing windows within weeks. Discipline in communications with policymakers and markets is critical to stabilize spreads and access to liquidity.
Deleveraging and risk campaigns
Periodic deleveraging drives, dating from the 2020 three red lines for developers, repeatedly compress credit supply and reshape distressed-asset flows; Huarong must shift sourcing as regulators tighten real-estate and platform lending corridors. Compliance with PBOC/CBIRC window guidance slows capital deployment and alters resolution pacing, while campaign intensity directly lengthens recovery timelines and prompts more conservative borrower behavior—as seen after the Evergrande collapse (about 1.97 trillion yuan liabilities).
- Regulatory tag: three red lines (2020)
- Market impact: tighter real-estate lending
- Operational: slower capital deployment under window guidance
- Behavioral: longer recoveries, conservative borrowers
Geopolitics & sanctions exposure
US–China tensions have tightened Huarong’s access to offshore capital and weighed on investor appetite after expanded US export controls (Oct 2022 onward) and broader trade measures; sanctions-screening and export-control spillovers raise due-diligence costs in restructurings and increase counterparty risk, while cross-border workouts face added regulatory frictions. Diversifying funding and counterparties reduces political-risk concentration.
- Higher compliance burden: export-control expansions since 2022
- Raised counterparty risk in offshore markets
- Cross-border regulatory frictions in workouts
- Mitigation: diversify funding and counterparties
State-owned AMC pivots to NPL cleanup; assets RMB 2.7tn
As a central state-owned AMC, Huarong executes Party/State Council directives prioritizing systemic stability and SOE reform, limiting pure commercial autonomy; reported total assets ~RMB 2.7 trillion at end-2023. Policy campaigns (three red lines, 2020) and post-2023 restructuring steer deal flow toward NPL cleanup, slowing capital deployment. Perceived state backing narrows funding costs but leaves credit spreads sensitive, widening ~100–200 bps in 2023.
| Indicator | Value |
|---|---|
| Total assets (Huarong, end-2023) | RMB 2.7 trillion |
| Evergrande liabilities (2021) | RMB 1.97 trillion |
| SOE AMCs established | 1999 (4 AMCs) |
| SOE bond spread move (2023) | ~100–200 bps |
What is included in the product
Detailed Word Document
Explores how macro-environmental forces—Political, Economic, Social, Technological, Environmental, and Legal—uniquely shape China Huarong Asset Management, with each section grounded in current data and trends to reveal risks, opportunities, and forward-looking scenarios; designed for executives and investors to inform strategy, compliance, and funding decisions.
Customizable Excel Spreadsheet
A concise, PESTLE-segmented summary of China Huarong Asset Management that simplifies regulatory, economic, and governance risks for quick inclusion in briefs or presentations, shareable across teams to align on external threats and strategic positioning.
Economic factors
Property downturn & NPL inflows
Stress among developers and supply chains has elevated distressed-asset supply, with real estate and related sectors contributing roughly 25% of China’s GDP, amplifying systemic exposure. Collateral values for land and housing determine recovery prospects as prices remain under pressure in many second- and third-tier cities. Workouts depend on local market absorption and 2024 policy easing (targeted rate cuts and purchase-relaxation). Timing entries around stabilization protects IRR.
Credit cycle & recovery rates
Recoveries for Huarong historically track China GDP and corporate earnings—China grew 5.2% in 2023 and IMF projected ~4.8% for 2024—while secondary-market liquidity drives exit multiples; in downturns liquidation values fall and time-to-resolution commonly lengthens, reducing recoveries, whereas economic rebounds improve restructuring feasibility and lift exit multiples; scenario analysis therefore calibrates bid pricing and provisioning.
Rates, spreads, and funding costs
Policy rate shifts—China 1-year LPR at 3.45% and 10-year CGB around 2.7% (July 2025)—directly affect Huarong’s carry and deal hurdle rates, as lower rates cut funding costs but compress asset yields. Credit spread widening (EM/onsumer/real-estate spreads up 50–150bp in stress episodes) forces higher required returns and marks down valuations. Active liability-duration management is essential to match funding with long-dated workout assets.
RMB and offshore financing
RMB volatility between about 6.7–7.3 USD/CNY in 2023–24 has raised USD bond servicing costs and complicated offshore debt recovery for Huarong, increasing default conversion risk.
Higher hedging premiums have reduced cross-border project IRRs; access to Hong Kong CNH pools and onshore interbank liquidity—backed by China’s roughly $3.2tn FX reserves (end‑2024)—is critical, and currency mismatches demand disciplined ALM.
- Exchange-rate range: 6.7–7.3 USD/CNY
- FX reserves: $3.2tn (end‑2024)
- Hedging raises IRR sensitivity
- Require strict ALM for currency mismatches
Asset market liquidity swings
In stressed periods bid–ask gaps for distressed loans and collateral can widen to 5–15 percentage points, slowing disposals and extending Huarong inventory turnover; policy-driven liquidity injections by the PBOC and Ministry of Finance since 2022 have intermittently reopened exit channels. Auction platforms and bulk-sales outcomes hinge on buyer risk appetite, while timing and tranche design materially accelerate clearance.
- Bid–ask gaps: 5–15pp
- Policy injections: PBOC/MOF support since 2022
- Sales channels: auctions vs bulk depend on buyer appetite
- Levers: timing and tranche design to clear stock
State-owned AMC pivots to NPL cleanup; assets RMB 2.7tn
Real-estate distress (~25% of GDP) raises distressed-asset supply and ties recoveries to local market absorption and policy easing. Funding costs and valuations are set by 1-year LPR 3.45% and 10y CGB ~2.7% (Jul 2025); FX swings (6.7–7.3 USD/CNY) and $3.2tn FX reserves (end‑2024) drive hedging needs and ALM. Bid–ask gaps 5–15pp slow exits; timing and tranche design key to clear stock.
| Metric | Value |
|---|---|
| Real‑estate share of GDP | ~25% |
| 1y LPR | 3.45% |
| 10y CGB | ~2.7% (Jul 2025) |
| USD/CNY range | 6.7–7.3 |
| FX reserves | $3.2tn (end‑2024) |
| Bid–ask gaps | 5–15pp |
What You See Is What You Get
China Huarong Asset Management PESTLE Analysis
The China Huarong Asset Management PESTLE Analysis preview shown here is the exact document you’ll receive after purchase—fully formatted and ready to use. This is a real screenshot of the product you’re buying, with no placeholders or teasers. The layout, content, and structure visible here are exactly what you’ll download immediately after payment.
Description
Make Smarter Strategic Decisions with a Complete PESTEL View
Our PESTLE analysis pinpoints how political oversight, economic cycles, regulatory reform and ESG pressures are reshaping China Huarong Asset Management’s risk profile and growth prospects; it also highlights technology-driven operational shifts and legal exposure. For strategic recommendations and the full data-backed breakdown, download the complete PESTLE report now.
Political factors
State ownership & policy alignment
As a central state-owned asset manager, China Huarong must execute government directives that prioritize national financial stability and systemic risk containment. Strategic goals align with Party and State Council priorities such as SOE reform and deleveraging, with Huarong reporting total assets of about RMB 2.7 trillion at end-2023. Policy alignment secures implicit state support but limits pure commercial autonomy, and execution speed often hinges on policy signals and ministerial coordination.
Macro-prudential mandates
Authorities have long used four state AMCs (established 1999) to absorb systemic stress from banks and the property sector, and Huarong remains central to these policy tools. Campaigns to cut NPLs and clean up shadow banking drive Huarong's portfolio mix, producing countercyclical deal flow but with policy-driven pricing. Post-2023 state-led restructuring reinforced KPIs prioritizing risk mitigation over short-term profit.
Government backstop expectations
Market participants often assume partial state support for Huarong, lowering funding costs but inviting moral-hazard scrutiny from regulators and investors; during China’s 2023 property stress, SOE bond spreads widened roughly 100–200 bps, illustrating sensitivity to perceived backing. Any official shift in support posture can move Huarong’s credit spreads and narrow or close refinancing windows within weeks. Discipline in communications with policymakers and markets is critical to stabilize spreads and access to liquidity.
Deleveraging and risk campaigns
Periodic deleveraging drives, dating from the 2020 three red lines for developers, repeatedly compress credit supply and reshape distressed-asset flows; Huarong must shift sourcing as regulators tighten real-estate and platform lending corridors. Compliance with PBOC/CBIRC window guidance slows capital deployment and alters resolution pacing, while campaign intensity directly lengthens recovery timelines and prompts more conservative borrower behavior—as seen after the Evergrande collapse (about 1.97 trillion yuan liabilities).
- Regulatory tag: three red lines (2020)
- Market impact: tighter real-estate lending
- Operational: slower capital deployment under window guidance
- Behavioral: longer recoveries, conservative borrowers
Geopolitics & sanctions exposure
US–China tensions have tightened Huarong’s access to offshore capital and weighed on investor appetite after expanded US export controls (Oct 2022 onward) and broader trade measures; sanctions-screening and export-control spillovers raise due-diligence costs in restructurings and increase counterparty risk, while cross-border workouts face added regulatory frictions. Diversifying funding and counterparties reduces political-risk concentration.
- Higher compliance burden: export-control expansions since 2022
- Raised counterparty risk in offshore markets
- Cross-border regulatory frictions in workouts
- Mitigation: diversify funding and counterparties
State-owned AMC pivots to NPL cleanup; assets RMB 2.7tn
As a central state-owned AMC, Huarong executes Party/State Council directives prioritizing systemic stability and SOE reform, limiting pure commercial autonomy; reported total assets ~RMB 2.7 trillion at end-2023. Policy campaigns (three red lines, 2020) and post-2023 restructuring steer deal flow toward NPL cleanup, slowing capital deployment. Perceived state backing narrows funding costs but leaves credit spreads sensitive, widening ~100–200 bps in 2023.
| Indicator | Value |
|---|---|
| Total assets (Huarong, end-2023) | RMB 2.7 trillion |
| Evergrande liabilities (2021) | RMB 1.97 trillion |
| SOE AMCs established | 1999 (4 AMCs) |
| SOE bond spread move (2023) | ~100–200 bps |
What is included in the product
Detailed Word Document
Explores how macro-environmental forces—Political, Economic, Social, Technological, Environmental, and Legal—uniquely shape China Huarong Asset Management, with each section grounded in current data and trends to reveal risks, opportunities, and forward-looking scenarios; designed for executives and investors to inform strategy, compliance, and funding decisions.
Customizable Excel Spreadsheet
A concise, PESTLE-segmented summary of China Huarong Asset Management that simplifies regulatory, economic, and governance risks for quick inclusion in briefs or presentations, shareable across teams to align on external threats and strategic positioning.
Economic factors
Property downturn & NPL inflows
Stress among developers and supply chains has elevated distressed-asset supply, with real estate and related sectors contributing roughly 25% of China’s GDP, amplifying systemic exposure. Collateral values for land and housing determine recovery prospects as prices remain under pressure in many second- and third-tier cities. Workouts depend on local market absorption and 2024 policy easing (targeted rate cuts and purchase-relaxation). Timing entries around stabilization protects IRR.
Credit cycle & recovery rates
Recoveries for Huarong historically track China GDP and corporate earnings—China grew 5.2% in 2023 and IMF projected ~4.8% for 2024—while secondary-market liquidity drives exit multiples; in downturns liquidation values fall and time-to-resolution commonly lengthens, reducing recoveries, whereas economic rebounds improve restructuring feasibility and lift exit multiples; scenario analysis therefore calibrates bid pricing and provisioning.
Rates, spreads, and funding costs
Policy rate shifts—China 1-year LPR at 3.45% and 10-year CGB around 2.7% (July 2025)—directly affect Huarong’s carry and deal hurdle rates, as lower rates cut funding costs but compress asset yields. Credit spread widening (EM/onsumer/real-estate spreads up 50–150bp in stress episodes) forces higher required returns and marks down valuations. Active liability-duration management is essential to match funding with long-dated workout assets.
RMB and offshore financing
RMB volatility between about 6.7–7.3 USD/CNY in 2023–24 has raised USD bond servicing costs and complicated offshore debt recovery for Huarong, increasing default conversion risk.
Higher hedging premiums have reduced cross-border project IRRs; access to Hong Kong CNH pools and onshore interbank liquidity—backed by China’s roughly $3.2tn FX reserves (end‑2024)—is critical, and currency mismatches demand disciplined ALM.
- Exchange-rate range: 6.7–7.3 USD/CNY
- FX reserves: $3.2tn (end‑2024)
- Hedging raises IRR sensitivity
- Require strict ALM for currency mismatches
Asset market liquidity swings
In stressed periods bid–ask gaps for distressed loans and collateral can widen to 5–15 percentage points, slowing disposals and extending Huarong inventory turnover; policy-driven liquidity injections by the PBOC and Ministry of Finance since 2022 have intermittently reopened exit channels. Auction platforms and bulk-sales outcomes hinge on buyer risk appetite, while timing and tranche design materially accelerate clearance.
- Bid–ask gaps: 5–15pp
- Policy injections: PBOC/MOF support since 2022
- Sales channels: auctions vs bulk depend on buyer appetite
- Levers: timing and tranche design to clear stock
State-owned AMC pivots to NPL cleanup; assets RMB 2.7tn
Real-estate distress (~25% of GDP) raises distressed-asset supply and ties recoveries to local market absorption and policy easing. Funding costs and valuations are set by 1-year LPR 3.45% and 10y CGB ~2.7% (Jul 2025); FX swings (6.7–7.3 USD/CNY) and $3.2tn FX reserves (end‑2024) drive hedging needs and ALM. Bid–ask gaps 5–15pp slow exits; timing and tranche design key to clear stock.
| Metric | Value |
|---|---|
| Real‑estate share of GDP | ~25% |
| 1y LPR | 3.45% |
| 10y CGB | ~2.7% (Jul 2025) |
| USD/CNY range | 6.7–7.3 |
| FX reserves | $3.2tn (end‑2024) |
| Bid–ask gaps | 5–15pp |
What You See Is What You Get
China Huarong Asset Management PESTLE Analysis
The China Huarong Asset Management PESTLE Analysis preview shown here is the exact document you’ll receive after purchase—fully formatted and ready to use. This is a real screenshot of the product you’re buying, with no placeholders or teasers. The layout, content, and structure visible here are exactly what you’ll download immediately after payment.











