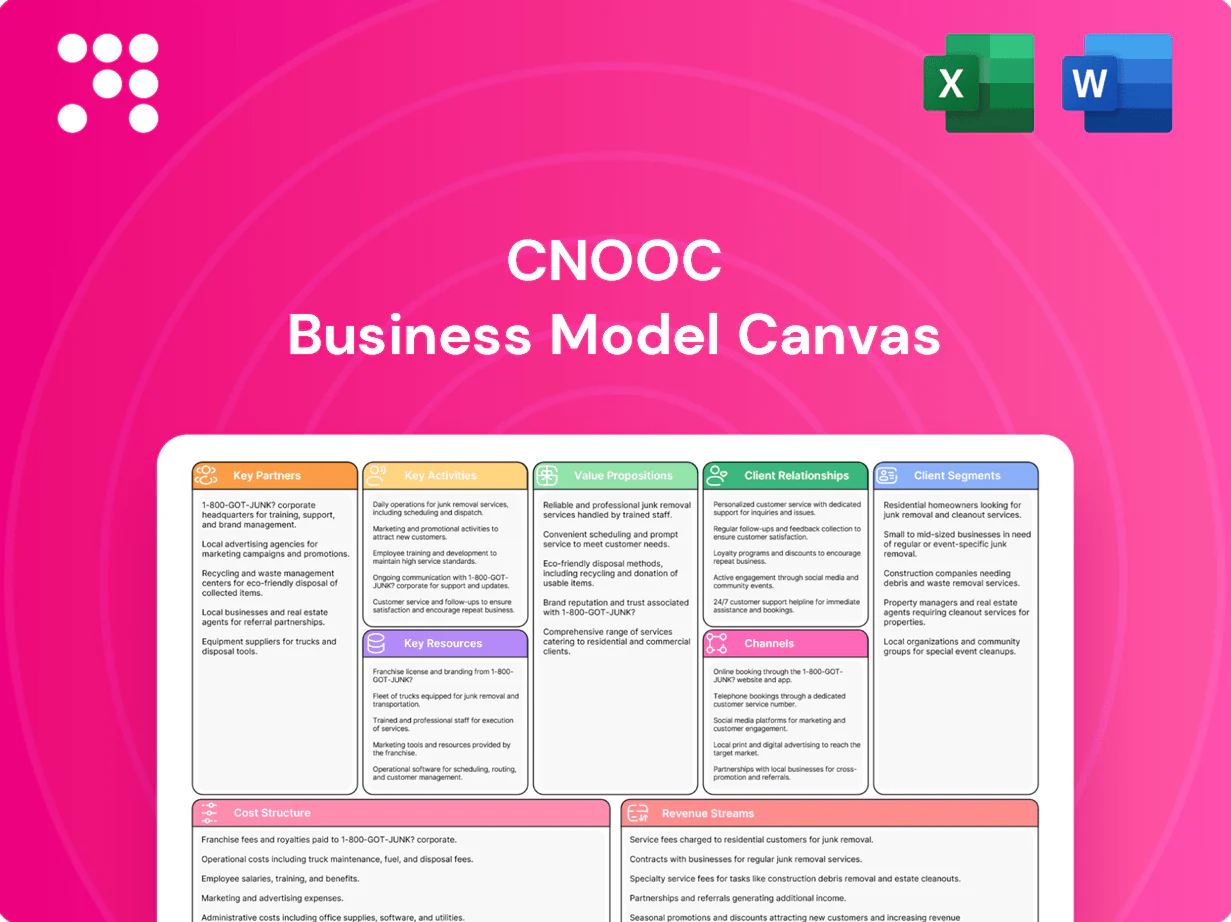
CNOOC Business Model Canvas

Offshore Energy Business Model Canvas: Value Creation, Asset Security, Revenue Strategies
Unlock the full strategic blueprint behind CNOOC’s business model in our in-depth Business Model Canvas — three concise sections reveal how CNOOC creates value, secures offshore assets, and monetizes production in volatile markets. Ideal for investors, consultants, and executives seeking actionable, company-specific insights. Download the complete Word & Excel canvases to benchmark strategy and inform decisions.
Partnerships

National and International Oil Company JVs
CNOOC, China’s largest offshore oil and gas producer, forms joint ventures with NOCs and IOCs such as BP, Eni, Chevron and Shell to share risk, capital and technology in offshore and deepwater blocks; these alliances provide acreage access, deepwater know-how and global best practices, streamline regulatory approvals and local content compliance, and improve project financing and political risk management.
Oilfield Services and EPC Contractors
CNOOC’s strategic ties with seismic, drilling, subsea and EPC firms accelerate project delivery and align with the 2024 global FPSO fleet exceeding 200 units. Service partners supply specialized rigs, FPSO conversions and subsea installation capacity, while collaborative planning has been shown to cut non‑productive time by 10–30%. Preferred‑vendor frameworks maintain safety, quality and equipment availability.

Equipment and Technology Suppliers
Critical equipment and technology suppliers deliver subsea trees, flowlines, compressors, turbines and digital solutions to CNOOC, enabling its offshore projects. Technology alliances in 2024 supported HTHP and deepwater operations through joint engineering and testing. Vendor-managed inventory and lifecycle service contracts improve uptime and reduce downtime risk. Co-development pilots de-risk frontier technologies before full field deployment.

Governments, Regulators, and Maritime Authorities
CNOOC's strong ties with governments and regulators secure licenses, production-sharing contracts and environmental approvals, while coordination enforces HSE, emissions and decommissioning obligations; IMO targets a 40% carbon intensity cut by 2030, shaping compliance. Maritime authorities enable safe offshore logistics and navigation; policy engagement advances national energy security priorities.
- Licenses/PSCs
- HSE & emissions
- Decommissioning
- Maritime logistics
- Energy security
Traders, Shippers, and Terminal Operators
Partnerships with traders and shippers enable CNOOC to optimize offtake, scheduling and freight, while terminal operators provide storage, blending and loading flexibility that smooths export flows. Coordinated logistics reduce demurrage and supply disruptions, and sharing market intelligence with counterparties improves price realization and hedging decisions. These relationships support flexible cargo reallocation and fast response to regional demand shifts.
- traders: optimize sales & hedging
- shippers: improve scheduling & freight efficiency
- terminal operators: storage, blending, loading flexibility
- coordination: lower demurrage, fewer disruptions
- market intel: better pricing and hedging
NOC/IOC JVs, EPC & suppliers cut NPT 10–30%, traders optimize offtake
CNOOC forms JVs with NOCs/IOCs (BP, Eni, Chevron, Shell) to share capital, tech and acreage; service and EPC partners cut non‑productive time 10–30% and support deepwater/HTHP work; suppliers provide subsea trees, compressors and digital ops while vendors run VMI and lifecycle contracts; traders, shippers and terminals optimize offtake, lowering demurrage and enabling flexible cargo allocation.
| Partner type | Role | 2024 metric |
|---|---|---|
| NOC/IOC JVs | Acreage, financing, tech | Key partners: BP, Eni, Chevron, Shell |
| Service/EPC | Delivery, rigs, FPSO | Global FPSO fleet >200 units |
| Suppliers | Equip, digital | NPT cut 10–30% |
What is included in the product
 Detailed Word Document
A concise, pre-written Business Model Canvas for CNOOC covering customer segments, channels, value propositions, key activities, resources, partners, cost and revenue structures across the 9 BMC blocks, with competitive advantage analysis, linked SWOT insights, and investor-ready narrative for strategic and funding discussions.

 Customizable Excel Spreadsheet
Clean one-page Business Model Canvas for CNOOC that condenses strategy into a digestible format, saving hours of structuring while being shareable and editable for team collaboration and quick boardroom reviews.
Activities

Offshore Exploration and Appraisal
CNOOC identifies offshore prospects with integrated 2D/3D seismic, geology and basin modeling to prioritize targets; it drills exploration and appraisal wells to delineate reserves and convert leads to contingent resources. Integrated geoscience workflows and risk-based decision gates reduce subsurface uncertainty and cost overruns. Discoveries are matured into development concepts using fast-track FEED and phased tiebacks to existing infrastructure.
Field Development and Engineering
Design subsea systems, platforms and tie-backs to maximize recovery; subsea tie-backs can cut development capex versus new platforms by up to 40%. Execute EPC, installation and commissioning under strict HSE standards; phased development limits first‑cycle capex (commonly ~20–30% lower) and accelerates learning curves. Integrate digital twins and reliability engineering to lift equipment uptime by an estimated 5–10%.

Production Operations and Maintenance
Operate FPSOs, platforms and subsea networks to maximize uptime while ensuring safe operations in harsh offshore environments. In 2024 industry data show predictive maintenance and integrity management cut unplanned downtime 20–30% and failure rates substantially. Energy efficiency and targeted debottlenecking can reduce lift costs by up to 15%, supporting lower unit operating costs and higher asset availability.

Marketing, Trading, and Logistics
Market crude, gas, LNG and NGLs to a diversified global buyer base across term and spot contracts to optimize revenues and access different demand windows.
Balance long-term sales for security with spot sales to capture price premiums; actively manage shipping, storage and pipeline nominations to minimize bottlenecks and off-take risks.
Use hedging and derivatives to stabilize cash flows and mitigate commodity volatility while aligning marketing and trading strategies with upstream production profiles.
- Market diversification
- Term vs spot optimization
- Shipping, storage, pipeline management
- Hedging for cash‑flow stability
HSE, ESG, and Carbon Management
CNOOC maintains rigorous safety systems and spill-prevention protocols and reported its 2023 Sustainability Report detailing HSE measures. Emissions monitoring, flaring reduction and methane control are operational priorities while advancing CCS, electrification and renewables integration where feasible. ESG disclosures align with stakeholder expectations and China’s 2060 carbon neutrality goal.
- 2023 Sustainability Report
- HSE & spill prevention
- Flaring & methane control
- CCS, electrification, renewables
- ESG disclosure compliance
End‑to‑end upstream cuts capex up to 40%, uptime +5–10%
CNOOC runs end‑to‑end upstream: seismic-led exploration, drilling to convert leads, fast‑track FEED and tie‑backs; subsea tie‑backs cut development capex up to 40% and phased builds lower first‑cycle capex ~20–30%. Operations use predictive maintenance (2024 industry: unplanned downtime −20–30%) and digital twins to lift uptime ~5–10%. Marketing blends term/spot sales, hedging and logistics to stabilize cash flow.
| Metric | 2024/2023 |
|---|---|
| Subsea tie‑back capex saving | up to 40% |
| First‑cycle capex reduction | ~20–30% |
| Downtime reduction (predictive Mx) | 20–30% (2024) |
| Uptime gain (digital) | 5–10% |
Full Document Unlocks After Purchase
Business Model Canvas
The document you're previewing is the exact CNOOC Business Model Canvas you will receive after purchase; it is not a mockup. Upon order you'll get the complete, editable file in Word and Excel formats with all sections included. No surprises—what you see is what you'll download and use.

Offshore Energy Business Model Canvas: Value Creation, Asset Security, Revenue Strategies
Unlock the full strategic blueprint behind CNOOC’s business model in our in-depth Business Model Canvas — three concise sections reveal how CNOOC creates value, secures offshore assets, and monetizes production in volatile markets. Ideal for investors, consultants, and executives seeking actionable, company-specific insights. Download the complete Word & Excel canvases to benchmark strategy and inform decisions.
Partnerships
National and International Oil Company JVs
CNOOC, China’s largest offshore oil and gas producer, forms joint ventures with NOCs and IOCs such as BP, Eni, Chevron and Shell to share risk, capital and technology in offshore and deepwater blocks; these alliances provide acreage access, deepwater know-how and global best practices, streamline regulatory approvals and local content compliance, and improve project financing and political risk management.
Oilfield Services and EPC Contractors
CNOOC’s strategic ties with seismic, drilling, subsea and EPC firms accelerate project delivery and align with the 2024 global FPSO fleet exceeding 200 units. Service partners supply specialized rigs, FPSO conversions and subsea installation capacity, while collaborative planning has been shown to cut non‑productive time by 10–30%. Preferred‑vendor frameworks maintain safety, quality and equipment availability.
Equipment and Technology Suppliers
Critical equipment and technology suppliers deliver subsea trees, flowlines, compressors, turbines and digital solutions to CNOOC, enabling its offshore projects. Technology alliances in 2024 supported HTHP and deepwater operations through joint engineering and testing. Vendor-managed inventory and lifecycle service contracts improve uptime and reduce downtime risk. Co-development pilots de-risk frontier technologies before full field deployment.
Governments, Regulators, and Maritime Authorities
CNOOC's strong ties with governments and regulators secure licenses, production-sharing contracts and environmental approvals, while coordination enforces HSE, emissions and decommissioning obligations; IMO targets a 40% carbon intensity cut by 2030, shaping compliance. Maritime authorities enable safe offshore logistics and navigation; policy engagement advances national energy security priorities.
- Licenses/PSCs
- HSE & emissions
- Decommissioning
- Maritime logistics
- Energy security
Traders, Shippers, and Terminal Operators
Partnerships with traders and shippers enable CNOOC to optimize offtake, scheduling and freight, while terminal operators provide storage, blending and loading flexibility that smooths export flows. Coordinated logistics reduce demurrage and supply disruptions, and sharing market intelligence with counterparties improves price realization and hedging decisions. These relationships support flexible cargo reallocation and fast response to regional demand shifts.
- traders: optimize sales & hedging
- shippers: improve scheduling & freight efficiency
- terminal operators: storage, blending, loading flexibility
- coordination: lower demurrage, fewer disruptions
- market intel: better pricing and hedging
NOC/IOC JVs, EPC & suppliers cut NPT 10–30%, traders optimize offtake
CNOOC forms JVs with NOCs/IOCs (BP, Eni, Chevron, Shell) to share capital, tech and acreage; service and EPC partners cut non‑productive time 10–30% and support deepwater/HTHP work; suppliers provide subsea trees, compressors and digital ops while vendors run VMI and lifecycle contracts; traders, shippers and terminals optimize offtake, lowering demurrage and enabling flexible cargo allocation.
| Partner type | Role | 2024 metric |
|---|---|---|
| NOC/IOC JVs | Acreage, financing, tech | Key partners: BP, Eni, Chevron, Shell |
| Service/EPC | Delivery, rigs, FPSO | Global FPSO fleet >200 units |
| Suppliers | Equip, digital | NPT cut 10–30% |
What is included in the product
Detailed Word Document
A concise, pre-written Business Model Canvas for CNOOC covering customer segments, channels, value propositions, key activities, resources, partners, cost and revenue structures across the 9 BMC blocks, with competitive advantage analysis, linked SWOT insights, and investor-ready narrative for strategic and funding discussions.
Customizable Excel Spreadsheet
Clean one-page Business Model Canvas for CNOOC that condenses strategy into a digestible format, saving hours of structuring while being shareable and editable for team collaboration and quick boardroom reviews.
Activities
Offshore Exploration and Appraisal
CNOOC identifies offshore prospects with integrated 2D/3D seismic, geology and basin modeling to prioritize targets; it drills exploration and appraisal wells to delineate reserves and convert leads to contingent resources. Integrated geoscience workflows and risk-based decision gates reduce subsurface uncertainty and cost overruns. Discoveries are matured into development concepts using fast-track FEED and phased tiebacks to existing infrastructure.
Field Development and Engineering
Design subsea systems, platforms and tie-backs to maximize recovery; subsea tie-backs can cut development capex versus new platforms by up to 40%. Execute EPC, installation and commissioning under strict HSE standards; phased development limits first‑cycle capex (commonly ~20–30% lower) and accelerates learning curves. Integrate digital twins and reliability engineering to lift equipment uptime by an estimated 5–10%.
Production Operations and Maintenance
Operate FPSOs, platforms and subsea networks to maximize uptime while ensuring safe operations in harsh offshore environments. In 2024 industry data show predictive maintenance and integrity management cut unplanned downtime 20–30% and failure rates substantially. Energy efficiency and targeted debottlenecking can reduce lift costs by up to 15%, supporting lower unit operating costs and higher asset availability.
Marketing, Trading, and Logistics
Market crude, gas, LNG and NGLs to a diversified global buyer base across term and spot contracts to optimize revenues and access different demand windows.
Balance long-term sales for security with spot sales to capture price premiums; actively manage shipping, storage and pipeline nominations to minimize bottlenecks and off-take risks.
Use hedging and derivatives to stabilize cash flows and mitigate commodity volatility while aligning marketing and trading strategies with upstream production profiles.
- Market diversification
- Term vs spot optimization
- Shipping, storage, pipeline management
- Hedging for cash‑flow stability
HSE, ESG, and Carbon Management
CNOOC maintains rigorous safety systems and spill-prevention protocols and reported its 2023 Sustainability Report detailing HSE measures. Emissions monitoring, flaring reduction and methane control are operational priorities while advancing CCS, electrification and renewables integration where feasible. ESG disclosures align with stakeholder expectations and China’s 2060 carbon neutrality goal.
- 2023 Sustainability Report
- HSE & spill prevention
- Flaring & methane control
- CCS, electrification, renewables
- ESG disclosure compliance
End‑to‑end upstream cuts capex up to 40%, uptime +5–10%
CNOOC runs end‑to‑end upstream: seismic-led exploration, drilling to convert leads, fast‑track FEED and tie‑backs; subsea tie‑backs cut development capex up to 40% and phased builds lower first‑cycle capex ~20–30%. Operations use predictive maintenance (2024 industry: unplanned downtime −20–30%) and digital twins to lift uptime ~5–10%. Marketing blends term/spot sales, hedging and logistics to stabilize cash flow.
| Metric | 2024/2023 |
|---|---|
| Subsea tie‑back capex saving | up to 40% |
| First‑cycle capex reduction | ~20–30% |
| Downtime reduction (predictive Mx) | 20–30% (2024) |
| Uptime gain (digital) | 5–10% |
Full Document Unlocks After Purchase
Business Model Canvas
The document you're previewing is the exact CNOOC Business Model Canvas you will receive after purchase; it is not a mockup. Upon order you'll get the complete, editable file in Word and Excel formats with all sections included. No surprises—what you see is what you'll download and use.
Original: $10.00
-65%$10.00
$3.50Description
Offshore Energy Business Model Canvas: Value Creation, Asset Security, Revenue Strategies
Unlock the full strategic blueprint behind CNOOC’s business model in our in-depth Business Model Canvas — three concise sections reveal how CNOOC creates value, secures offshore assets, and monetizes production in volatile markets. Ideal for investors, consultants, and executives seeking actionable, company-specific insights. Download the complete Word & Excel canvases to benchmark strategy and inform decisions.
Partnerships
National and International Oil Company JVs
CNOOC, China’s largest offshore oil and gas producer, forms joint ventures with NOCs and IOCs such as BP, Eni, Chevron and Shell to share risk, capital and technology in offshore and deepwater blocks; these alliances provide acreage access, deepwater know-how and global best practices, streamline regulatory approvals and local content compliance, and improve project financing and political risk management.
Oilfield Services and EPC Contractors
CNOOC’s strategic ties with seismic, drilling, subsea and EPC firms accelerate project delivery and align with the 2024 global FPSO fleet exceeding 200 units. Service partners supply specialized rigs, FPSO conversions and subsea installation capacity, while collaborative planning has been shown to cut non‑productive time by 10–30%. Preferred‑vendor frameworks maintain safety, quality and equipment availability.
Equipment and Technology Suppliers
Critical equipment and technology suppliers deliver subsea trees, flowlines, compressors, turbines and digital solutions to CNOOC, enabling its offshore projects. Technology alliances in 2024 supported HTHP and deepwater operations through joint engineering and testing. Vendor-managed inventory and lifecycle service contracts improve uptime and reduce downtime risk. Co-development pilots de-risk frontier technologies before full field deployment.
Governments, Regulators, and Maritime Authorities
CNOOC's strong ties with governments and regulators secure licenses, production-sharing contracts and environmental approvals, while coordination enforces HSE, emissions and decommissioning obligations; IMO targets a 40% carbon intensity cut by 2030, shaping compliance. Maritime authorities enable safe offshore logistics and navigation; policy engagement advances national energy security priorities.
- Licenses/PSCs
- HSE & emissions
- Decommissioning
- Maritime logistics
- Energy security
Traders, Shippers, and Terminal Operators
Partnerships with traders and shippers enable CNOOC to optimize offtake, scheduling and freight, while terminal operators provide storage, blending and loading flexibility that smooths export flows. Coordinated logistics reduce demurrage and supply disruptions, and sharing market intelligence with counterparties improves price realization and hedging decisions. These relationships support flexible cargo reallocation and fast response to regional demand shifts.
- traders: optimize sales & hedging
- shippers: improve scheduling & freight efficiency
- terminal operators: storage, blending, loading flexibility
- coordination: lower demurrage, fewer disruptions
- market intel: better pricing and hedging
NOC/IOC JVs, EPC & suppliers cut NPT 10–30%, traders optimize offtake
CNOOC forms JVs with NOCs/IOCs (BP, Eni, Chevron, Shell) to share capital, tech and acreage; service and EPC partners cut non‑productive time 10–30% and support deepwater/HTHP work; suppliers provide subsea trees, compressors and digital ops while vendors run VMI and lifecycle contracts; traders, shippers and terminals optimize offtake, lowering demurrage and enabling flexible cargo allocation.
| Partner type | Role | 2024 metric |
|---|---|---|
| NOC/IOC JVs | Acreage, financing, tech | Key partners: BP, Eni, Chevron, Shell |
| Service/EPC | Delivery, rigs, FPSO | Global FPSO fleet >200 units |
| Suppliers | Equip, digital | NPT cut 10–30% |
What is included in the product
Detailed Word Document
A concise, pre-written Business Model Canvas for CNOOC covering customer segments, channels, value propositions, key activities, resources, partners, cost and revenue structures across the 9 BMC blocks, with competitive advantage analysis, linked SWOT insights, and investor-ready narrative for strategic and funding discussions.
Customizable Excel Spreadsheet
Clean one-page Business Model Canvas for CNOOC that condenses strategy into a digestible format, saving hours of structuring while being shareable and editable for team collaboration and quick boardroom reviews.
Activities
Offshore Exploration and Appraisal
CNOOC identifies offshore prospects with integrated 2D/3D seismic, geology and basin modeling to prioritize targets; it drills exploration and appraisal wells to delineate reserves and convert leads to contingent resources. Integrated geoscience workflows and risk-based decision gates reduce subsurface uncertainty and cost overruns. Discoveries are matured into development concepts using fast-track FEED and phased tiebacks to existing infrastructure.
Field Development and Engineering
Design subsea systems, platforms and tie-backs to maximize recovery; subsea tie-backs can cut development capex versus new platforms by up to 40%. Execute EPC, installation and commissioning under strict HSE standards; phased development limits first‑cycle capex (commonly ~20–30% lower) and accelerates learning curves. Integrate digital twins and reliability engineering to lift equipment uptime by an estimated 5–10%.
Production Operations and Maintenance
Operate FPSOs, platforms and subsea networks to maximize uptime while ensuring safe operations in harsh offshore environments. In 2024 industry data show predictive maintenance and integrity management cut unplanned downtime 20–30% and failure rates substantially. Energy efficiency and targeted debottlenecking can reduce lift costs by up to 15%, supporting lower unit operating costs and higher asset availability.
Marketing, Trading, and Logistics
Market crude, gas, LNG and NGLs to a diversified global buyer base across term and spot contracts to optimize revenues and access different demand windows.
Balance long-term sales for security with spot sales to capture price premiums; actively manage shipping, storage and pipeline nominations to minimize bottlenecks and off-take risks.
Use hedging and derivatives to stabilize cash flows and mitigate commodity volatility while aligning marketing and trading strategies with upstream production profiles.
- Market diversification
- Term vs spot optimization
- Shipping, storage, pipeline management
- Hedging for cash‑flow stability
HSE, ESG, and Carbon Management
CNOOC maintains rigorous safety systems and spill-prevention protocols and reported its 2023 Sustainability Report detailing HSE measures. Emissions monitoring, flaring reduction and methane control are operational priorities while advancing CCS, electrification and renewables integration where feasible. ESG disclosures align with stakeholder expectations and China’s 2060 carbon neutrality goal.
- 2023 Sustainability Report
- HSE & spill prevention
- Flaring & methane control
- CCS, electrification, renewables
- ESG disclosure compliance
End‑to‑end upstream cuts capex up to 40%, uptime +5–10%
CNOOC runs end‑to‑end upstream: seismic-led exploration, drilling to convert leads, fast‑track FEED and tie‑backs; subsea tie‑backs cut development capex up to 40% and phased builds lower first‑cycle capex ~20–30%. Operations use predictive maintenance (2024 industry: unplanned downtime −20–30%) and digital twins to lift uptime ~5–10%. Marketing blends term/spot sales, hedging and logistics to stabilize cash flow.
| Metric | 2024/2023 |
|---|---|
| Subsea tie‑back capex saving | up to 40% |
| First‑cycle capex reduction | ~20–30% |
| Downtime reduction (predictive Mx) | 20–30% (2024) |
| Uptime gain (digital) | 5–10% |
Full Document Unlocks After Purchase
Business Model Canvas
The document you're previewing is the exact CNOOC Business Model Canvas you will receive after purchase; it is not a mockup. Upon order you'll get the complete, editable file in Word and Excel formats with all sections included. No surprises—what you see is what you'll download and use.











