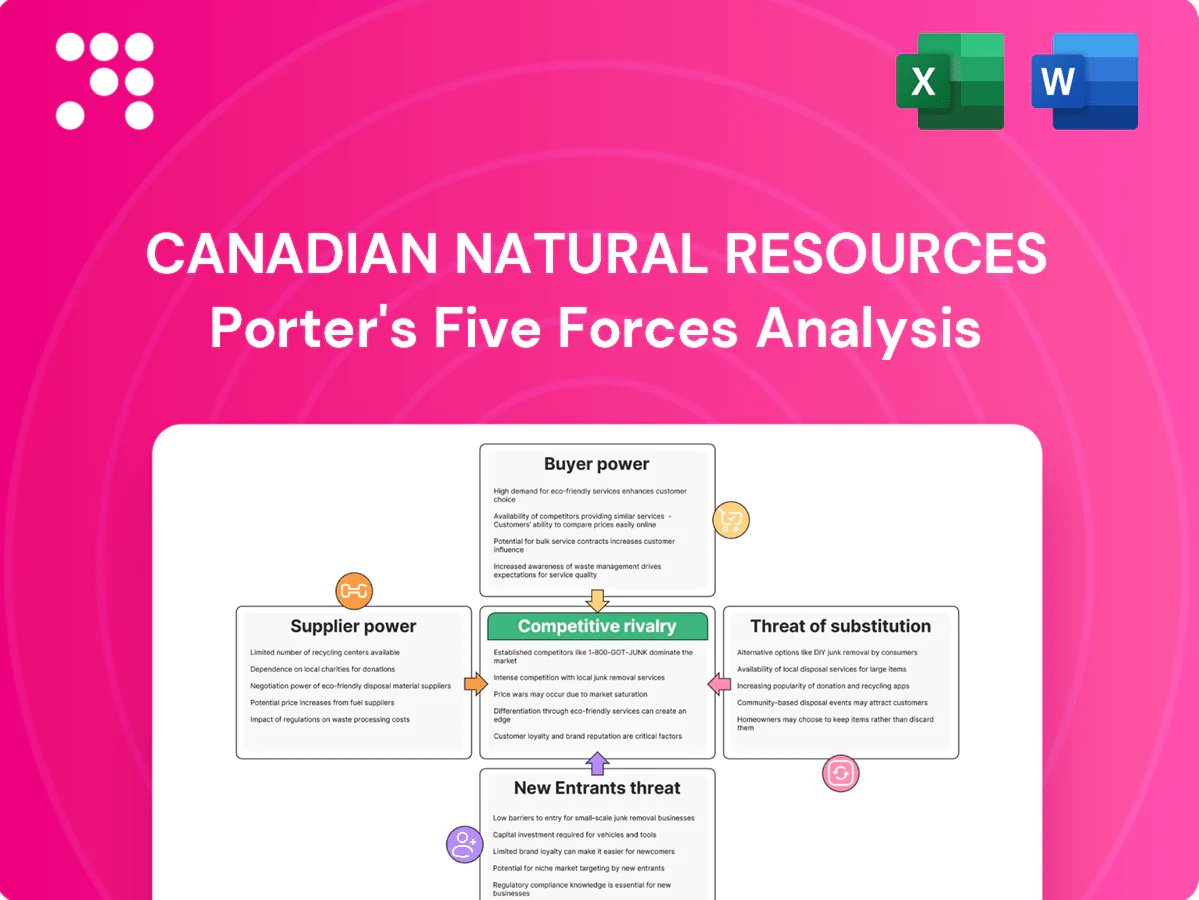
Canadian Natural Resources Porter's Five Forces Analysis

A Must-Have Tool for Decision-Makers
Canadian Natural Resources faces strong industry rivalry, notable supplier leverage for services and equipment, moderate buyer bargaining amid commodity cycles, high capital barriers to entry, and growing substitute threats from renewables. This brief snapshot only scratches the surface. Unlock the full Porter's Five Forces Analysis to explore Canadian Natural Resources’s competitive dynamics in detail.
Suppliers Bargaining Power

Concentrated OFS vendors
Concentrated oilfield services, rigs and specialized SAGD/mining contractors in Canada and offshore mean suppliers hold pricing power; Baker Hughes reported the Canadian rig count climbed in 2024 versus 2023, tightening capacity. Tight service markets have pushed up day-rates and turnaround costs during peak activity. Large multi-year programs from Canadian Natural provide some counter-leverage on pricing and scheduling, but scarce niche capabilities still raise switching costs in peak cycles.
Pipeline & midstream dependence
Takeaway capacity via a few owners — notably Enbridge’s mainline (~2.8 MMbpd) and the Trans Mountain expansion to about 890 kbpd — concentrates control over apportionment and tolls, giving suppliers leverage. Limited egress pushes producers to rail, which in 2024 added $10–25/bbl in transport costs and widened inland differentials. Long-term pipeline contracts dampen spot volatility but lock producers into capacity/toll exposure. Supplier power spikes during bottlenecks.

Diluent and utilities inputs
Bitumen requires condensate diluent, often around 30% of dilbit by volume, making condensate a critical supplier input. Regional condensate tightness pushed premiums versus benchmarks in 2023–24, at times exceeding US$20 per barrel, raising feedstock costs. Power, water and chemicals are essential for oil sands and offshore operations and can account for a material share of operating expense. Hedging and storage mitigate but cannot fully eliminate margin pressure when condensate is scarce, increasing supplier leverage.

Skilled labor and OEM parts
Specialized labor and OEM parts for upgraders, mines and offshore have few substitutes, raising supplier leverage; tight turnaround windows further intensify bargaining. Apprenticeships and multi-year vendor frameworks have reduced unit maintenance costs over time, but strike risks and OEM lead times (reported 20–40 weeks in 2024) can materially disrupt operations and cash flow.
- Few substitutes: skilled trades & OEM parts
- Turnarounds amplify bargaining power
- Apprenticeships/vendor contracts temper costs
- Strike risk & 2024 lead times 20–40 weeks
Technology and decommissioning
Proprietary process technology, specialized subsea systems and decommissioning services remain concentrated among a few global suppliers, giving them leverage over Canadian Natural Resources when sourcing complex offshore solutions; mature U.K. field decommissioning obligations further elevate supplier influence due to long-tail liability and specialist capacity constraints. Standardization of modules and CNRL’s growing in-house engineering expertise mitigate dependence, while regulatory oversight on safety and environmental remediation narrows acceptable supplier alternatives and can raise switching costs.
- supplier_concentration: select firms dominate proprietary tech and subsea systems
- decommissioning_pressure: U.K. mature fields increase specialist demand
- mitigation: standardization and in-house engineering reduce reliance
- regulation: stricter oversight limits alternative suppliers and raises compliance costs
2024 capacity squeeze lifts day-rates and boosts rail and condensate premiums
Concentrated rigs/services and OEMs tightened capacity in 2024 (Canadian rig count up vs 2023), lifting day‑rates and supplier leverage. Takeaway constrained: Enbridge mainline ~2.8 MMbpd, Trans Mountain ~890 kbpd, pushing rail premiums of US$10–25/bbl. Condensate premiums spiked >US$20/bbl in 2023–24; OEM lead times 20–40 weeks raised switching costs.
| Supplier | Metric | 2024 |
|---|---|---|
| Rigs/Services | Rig count | Up vs 2023 |
| Pipeline | Capacity | Enbridge 2.8 MMbpd; TMX 890 kbpd |
| Transport | Rail premium | US$10–25/bbl |
| Condensate | Premium | >US$20/bbl |
| OEM | Lead times | 20–40 weeks |
What is included in the product
 Detailed Word Document
Tailored Porter's Five Forces analysis for Canadian Natural Resources, uncovering competitive intensity, supplier and buyer power, substitution risks, and barriers that protect its upstream oil and gas position. Highlights disruptive threats, pricing leverage, and strategic implications for profitability.

 Customizable Excel Spreadsheet
One-sheet Porter's Five Forces for Canadian Natural Resources—editable force levels and instant radar visualization to simplify competitive pressure, ready to drop into decks or dashboards for fast, boardroom-ready decisions.
Customers Bargaining Power

Refiners for heavy sour
Heavy-sour refiners, especially in the U.S. Gulf Coast where PADD3 crude distillation capacity was about 8.9 million b/d in 2024 (EIA), are relatively few, concentrating buying power; configuration fit lets them demand quality and logistics discounts. Long-term contracts and reliable volumes help balance power, while consistent quality and certifications can secure premiums for suppliers.
Benchmark-driven pricing
Crude and gas for Canadian Natural Resources are priced off global/regional benchmarks (WTI, NYMEX, Henry Hub), leaving limited discretionary pricing and forcing sales based on prevailing benchmark-linked netbacks. Buyers can switch to comparable grades when netbacks favor alternatives, and 2024 pipeline congestion pushed WCS-WTI differentials to around US$20/bbl, embedding buyer leverage. Active marketing optimization and use of swaps/FOB sales have narrowed adverse basis impacts by improving realized prices.

Contract mix and term
A blend of spot, term and indexed contracts moderates buyer influence: term liftings improve cashflow predictability but lock in pricing formulas, while spot exposure can swing realized revenues by over 30% in weak markets. Portfolio diversification across regions reduces single-buyer concentration and lowers counterparty risk, helping Canadian Natural dilute buyer leverage across multiple offtake channels.

LNG/NGL and utility buyers
LNG/NGL and gas buyers—primarily petrochemical plants and utilities with alternative feedstocks—wield moderate bargaining power; storage and seasonal demand cycles (winter/summer peaks) create timing leverage while take‑or‑pay and capacity rights stabilize cash flows. Canada had no large‑scale LNG export terminals operational in 2024, leaving prices capped by competing basins.
- Buyers: petrochemicals, utilities
- Leverage: seasonal storage effects
- Stability: take‑or‑pay, capacity rights
- Cap: US/Gulf/Guyana supply limits premiums
ESG and carbon intensity
PADD3 buyer power: WCS-WTI US$20/bbl, CAD 80/t
Buyers concentrated (PADD3 heavy‑sour capacity 8.9m b/d in 2024) exert strong quality/logistics demands; long‑term contracts temper but do not eliminate leverage. Benchmark pricing (WCS‑WTI differential ~US$20/bbl in 2024) and >30% spot revenue swings give buyers switching power; emissions scrutiny (Canada carbon price CAD 80/t) raises discounts for high‑CI barrels.
| Metric | 2024 value | Impact |
|---|---|---|
| PADD3 heavy‑sour capacity | 8.9m b/d | Buyer concentration |
| WCS‑WTI differential | ~US$20/bbl | Pricing pressure |
| Canada carbon price | CAD 80/t | CI discounts |
| Spot volatility | >30% revenue swing | Buyer leverage |
What You See Is What You Get
Canadian Natural Resources Porter's Five Forces Analysis
This preview shows the exact Porter’s Five Forces analysis of Canadian Natural Resources you'll receive immediately after purchase—no placeholders or mockups. The document is fully formatted, professionally written, and ready for download and use the moment you buy. You're viewing the final deliverable; what you see is precisely what will be available to you instantly.

A Must-Have Tool for Decision-Makers
Canadian Natural Resources faces strong industry rivalry, notable supplier leverage for services and equipment, moderate buyer bargaining amid commodity cycles, high capital barriers to entry, and growing substitute threats from renewables. This brief snapshot only scratches the surface. Unlock the full Porter's Five Forces Analysis to explore Canadian Natural Resources’s competitive dynamics in detail.
Suppliers Bargaining Power
Concentrated OFS vendors
Concentrated oilfield services, rigs and specialized SAGD/mining contractors in Canada and offshore mean suppliers hold pricing power; Baker Hughes reported the Canadian rig count climbed in 2024 versus 2023, tightening capacity. Tight service markets have pushed up day-rates and turnaround costs during peak activity. Large multi-year programs from Canadian Natural provide some counter-leverage on pricing and scheduling, but scarce niche capabilities still raise switching costs in peak cycles.
Pipeline & midstream dependence
Takeaway capacity via a few owners — notably Enbridge’s mainline (~2.8 MMbpd) and the Trans Mountain expansion to about 890 kbpd — concentrates control over apportionment and tolls, giving suppliers leverage. Limited egress pushes producers to rail, which in 2024 added $10–25/bbl in transport costs and widened inland differentials. Long-term pipeline contracts dampen spot volatility but lock producers into capacity/toll exposure. Supplier power spikes during bottlenecks.
Diluent and utilities inputs
Bitumen requires condensate diluent, often around 30% of dilbit by volume, making condensate a critical supplier input. Regional condensate tightness pushed premiums versus benchmarks in 2023–24, at times exceeding US$20 per barrel, raising feedstock costs. Power, water and chemicals are essential for oil sands and offshore operations and can account for a material share of operating expense. Hedging and storage mitigate but cannot fully eliminate margin pressure when condensate is scarce, increasing supplier leverage.
Skilled labor and OEM parts
Specialized labor and OEM parts for upgraders, mines and offshore have few substitutes, raising supplier leverage; tight turnaround windows further intensify bargaining. Apprenticeships and multi-year vendor frameworks have reduced unit maintenance costs over time, but strike risks and OEM lead times (reported 20–40 weeks in 2024) can materially disrupt operations and cash flow.
- Few substitutes: skilled trades & OEM parts
- Turnarounds amplify bargaining power
- Apprenticeships/vendor contracts temper costs
- Strike risk & 2024 lead times 20–40 weeks
Technology and decommissioning
Proprietary process technology, specialized subsea systems and decommissioning services remain concentrated among a few global suppliers, giving them leverage over Canadian Natural Resources when sourcing complex offshore solutions; mature U.K. field decommissioning obligations further elevate supplier influence due to long-tail liability and specialist capacity constraints. Standardization of modules and CNRL’s growing in-house engineering expertise mitigate dependence, while regulatory oversight on safety and environmental remediation narrows acceptable supplier alternatives and can raise switching costs.
- supplier_concentration: select firms dominate proprietary tech and subsea systems
- decommissioning_pressure: U.K. mature fields increase specialist demand
- mitigation: standardization and in-house engineering reduce reliance
- regulation: stricter oversight limits alternative suppliers and raises compliance costs
2024 capacity squeeze lifts day-rates and boosts rail and condensate premiums
Concentrated rigs/services and OEMs tightened capacity in 2024 (Canadian rig count up vs 2023), lifting day‑rates and supplier leverage. Takeaway constrained: Enbridge mainline ~2.8 MMbpd, Trans Mountain ~890 kbpd, pushing rail premiums of US$10–25/bbl. Condensate premiums spiked >US$20/bbl in 2023–24; OEM lead times 20–40 weeks raised switching costs.
| Supplier | Metric | 2024 |
|---|---|---|
| Rigs/Services | Rig count | Up vs 2023 |
| Pipeline | Capacity | Enbridge 2.8 MMbpd; TMX 890 kbpd |
| Transport | Rail premium | US$10–25/bbl |
| Condensate | Premium | >US$20/bbl |
| OEM | Lead times | 20–40 weeks |
What is included in the product
Detailed Word Document
Tailored Porter's Five Forces analysis for Canadian Natural Resources, uncovering competitive intensity, supplier and buyer power, substitution risks, and barriers that protect its upstream oil and gas position. Highlights disruptive threats, pricing leverage, and strategic implications for profitability.
Customizable Excel Spreadsheet
One-sheet Porter's Five Forces for Canadian Natural Resources—editable force levels and instant radar visualization to simplify competitive pressure, ready to drop into decks or dashboards for fast, boardroom-ready decisions.
Customers Bargaining Power
Refiners for heavy sour
Heavy-sour refiners, especially in the U.S. Gulf Coast where PADD3 crude distillation capacity was about 8.9 million b/d in 2024 (EIA), are relatively few, concentrating buying power; configuration fit lets them demand quality and logistics discounts. Long-term contracts and reliable volumes help balance power, while consistent quality and certifications can secure premiums for suppliers.
Benchmark-driven pricing
Crude and gas for Canadian Natural Resources are priced off global/regional benchmarks (WTI, NYMEX, Henry Hub), leaving limited discretionary pricing and forcing sales based on prevailing benchmark-linked netbacks. Buyers can switch to comparable grades when netbacks favor alternatives, and 2024 pipeline congestion pushed WCS-WTI differentials to around US$20/bbl, embedding buyer leverage. Active marketing optimization and use of swaps/FOB sales have narrowed adverse basis impacts by improving realized prices.
Contract mix and term
A blend of spot, term and indexed contracts moderates buyer influence: term liftings improve cashflow predictability but lock in pricing formulas, while spot exposure can swing realized revenues by over 30% in weak markets. Portfolio diversification across regions reduces single-buyer concentration and lowers counterparty risk, helping Canadian Natural dilute buyer leverage across multiple offtake channels.
LNG/NGL and utility buyers
LNG/NGL and gas buyers—primarily petrochemical plants and utilities with alternative feedstocks—wield moderate bargaining power; storage and seasonal demand cycles (winter/summer peaks) create timing leverage while take‑or‑pay and capacity rights stabilize cash flows. Canada had no large‑scale LNG export terminals operational in 2024, leaving prices capped by competing basins.
- Buyers: petrochemicals, utilities
- Leverage: seasonal storage effects
- Stability: take‑or‑pay, capacity rights
- Cap: US/Gulf/Guyana supply limits premiums
ESG and carbon intensity
PADD3 buyer power: WCS-WTI US$20/bbl, CAD 80/t
Buyers concentrated (PADD3 heavy‑sour capacity 8.9m b/d in 2024) exert strong quality/logistics demands; long‑term contracts temper but do not eliminate leverage. Benchmark pricing (WCS‑WTI differential ~US$20/bbl in 2024) and >30% spot revenue swings give buyers switching power; emissions scrutiny (Canada carbon price CAD 80/t) raises discounts for high‑CI barrels.
| Metric | 2024 value | Impact |
|---|---|---|
| PADD3 heavy‑sour capacity | 8.9m b/d | Buyer concentration |
| WCS‑WTI differential | ~US$20/bbl | Pricing pressure |
| Canada carbon price | CAD 80/t | CI discounts |
| Spot volatility | >30% revenue swing | Buyer leverage |
What You See Is What You Get
Canadian Natural Resources Porter's Five Forces Analysis
This preview shows the exact Porter’s Five Forces analysis of Canadian Natural Resources you'll receive immediately after purchase—no placeholders or mockups. The document is fully formatted, professionally written, and ready for download and use the moment you buy. You're viewing the final deliverable; what you see is precisely what will be available to you instantly.
Original: $10.00
-65%$10.00
$3.50Description
A Must-Have Tool for Decision-Makers
Canadian Natural Resources faces strong industry rivalry, notable supplier leverage for services and equipment, moderate buyer bargaining amid commodity cycles, high capital barriers to entry, and growing substitute threats from renewables. This brief snapshot only scratches the surface. Unlock the full Porter's Five Forces Analysis to explore Canadian Natural Resources’s competitive dynamics in detail.
Suppliers Bargaining Power
Concentrated OFS vendors
Concentrated oilfield services, rigs and specialized SAGD/mining contractors in Canada and offshore mean suppliers hold pricing power; Baker Hughes reported the Canadian rig count climbed in 2024 versus 2023, tightening capacity. Tight service markets have pushed up day-rates and turnaround costs during peak activity. Large multi-year programs from Canadian Natural provide some counter-leverage on pricing and scheduling, but scarce niche capabilities still raise switching costs in peak cycles.
Pipeline & midstream dependence
Takeaway capacity via a few owners — notably Enbridge’s mainline (~2.8 MMbpd) and the Trans Mountain expansion to about 890 kbpd — concentrates control over apportionment and tolls, giving suppliers leverage. Limited egress pushes producers to rail, which in 2024 added $10–25/bbl in transport costs and widened inland differentials. Long-term pipeline contracts dampen spot volatility but lock producers into capacity/toll exposure. Supplier power spikes during bottlenecks.
Diluent and utilities inputs
Bitumen requires condensate diluent, often around 30% of dilbit by volume, making condensate a critical supplier input. Regional condensate tightness pushed premiums versus benchmarks in 2023–24, at times exceeding US$20 per barrel, raising feedstock costs. Power, water and chemicals are essential for oil sands and offshore operations and can account for a material share of operating expense. Hedging and storage mitigate but cannot fully eliminate margin pressure when condensate is scarce, increasing supplier leverage.
Skilled labor and OEM parts
Specialized labor and OEM parts for upgraders, mines and offshore have few substitutes, raising supplier leverage; tight turnaround windows further intensify bargaining. Apprenticeships and multi-year vendor frameworks have reduced unit maintenance costs over time, but strike risks and OEM lead times (reported 20–40 weeks in 2024) can materially disrupt operations and cash flow.
- Few substitutes: skilled trades & OEM parts
- Turnarounds amplify bargaining power
- Apprenticeships/vendor contracts temper costs
- Strike risk & 2024 lead times 20–40 weeks
Technology and decommissioning
Proprietary process technology, specialized subsea systems and decommissioning services remain concentrated among a few global suppliers, giving them leverage over Canadian Natural Resources when sourcing complex offshore solutions; mature U.K. field decommissioning obligations further elevate supplier influence due to long-tail liability and specialist capacity constraints. Standardization of modules and CNRL’s growing in-house engineering expertise mitigate dependence, while regulatory oversight on safety and environmental remediation narrows acceptable supplier alternatives and can raise switching costs.
- supplier_concentration: select firms dominate proprietary tech and subsea systems
- decommissioning_pressure: U.K. mature fields increase specialist demand
- mitigation: standardization and in-house engineering reduce reliance
- regulation: stricter oversight limits alternative suppliers and raises compliance costs
2024 capacity squeeze lifts day-rates and boosts rail and condensate premiums
Concentrated rigs/services and OEMs tightened capacity in 2024 (Canadian rig count up vs 2023), lifting day‑rates and supplier leverage. Takeaway constrained: Enbridge mainline ~2.8 MMbpd, Trans Mountain ~890 kbpd, pushing rail premiums of US$10–25/bbl. Condensate premiums spiked >US$20/bbl in 2023–24; OEM lead times 20–40 weeks raised switching costs.
| Supplier | Metric | 2024 |
|---|---|---|
| Rigs/Services | Rig count | Up vs 2023 |
| Pipeline | Capacity | Enbridge 2.8 MMbpd; TMX 890 kbpd |
| Transport | Rail premium | US$10–25/bbl |
| Condensate | Premium | >US$20/bbl |
| OEM | Lead times | 20–40 weeks |
What is included in the product
Detailed Word Document
Tailored Porter's Five Forces analysis for Canadian Natural Resources, uncovering competitive intensity, supplier and buyer power, substitution risks, and barriers that protect its upstream oil and gas position. Highlights disruptive threats, pricing leverage, and strategic implications for profitability.
Customizable Excel Spreadsheet
One-sheet Porter's Five Forces for Canadian Natural Resources—editable force levels and instant radar visualization to simplify competitive pressure, ready to drop into decks or dashboards for fast, boardroom-ready decisions.
Customers Bargaining Power
Refiners for heavy sour
Heavy-sour refiners, especially in the U.S. Gulf Coast where PADD3 crude distillation capacity was about 8.9 million b/d in 2024 (EIA), are relatively few, concentrating buying power; configuration fit lets them demand quality and logistics discounts. Long-term contracts and reliable volumes help balance power, while consistent quality and certifications can secure premiums for suppliers.
Benchmark-driven pricing
Crude and gas for Canadian Natural Resources are priced off global/regional benchmarks (WTI, NYMEX, Henry Hub), leaving limited discretionary pricing and forcing sales based on prevailing benchmark-linked netbacks. Buyers can switch to comparable grades when netbacks favor alternatives, and 2024 pipeline congestion pushed WCS-WTI differentials to around US$20/bbl, embedding buyer leverage. Active marketing optimization and use of swaps/FOB sales have narrowed adverse basis impacts by improving realized prices.
Contract mix and term
A blend of spot, term and indexed contracts moderates buyer influence: term liftings improve cashflow predictability but lock in pricing formulas, while spot exposure can swing realized revenues by over 30% in weak markets. Portfolio diversification across regions reduces single-buyer concentration and lowers counterparty risk, helping Canadian Natural dilute buyer leverage across multiple offtake channels.
LNG/NGL and utility buyers
LNG/NGL and gas buyers—primarily petrochemical plants and utilities with alternative feedstocks—wield moderate bargaining power; storage and seasonal demand cycles (winter/summer peaks) create timing leverage while take‑or‑pay and capacity rights stabilize cash flows. Canada had no large‑scale LNG export terminals operational in 2024, leaving prices capped by competing basins.
- Buyers: petrochemicals, utilities
- Leverage: seasonal storage effects
- Stability: take‑or‑pay, capacity rights
- Cap: US/Gulf/Guyana supply limits premiums
ESG and carbon intensity
PADD3 buyer power: WCS-WTI US$20/bbl, CAD 80/t
Buyers concentrated (PADD3 heavy‑sour capacity 8.9m b/d in 2024) exert strong quality/logistics demands; long‑term contracts temper but do not eliminate leverage. Benchmark pricing (WCS‑WTI differential ~US$20/bbl in 2024) and >30% spot revenue swings give buyers switching power; emissions scrutiny (Canada carbon price CAD 80/t) raises discounts for high‑CI barrels.
| Metric | 2024 value | Impact |
|---|---|---|
| PADD3 heavy‑sour capacity | 8.9m b/d | Buyer concentration |
| WCS‑WTI differential | ~US$20/bbl | Pricing pressure |
| Canada carbon price | CAD 80/t | CI discounts |
| Spot volatility | >30% revenue swing | Buyer leverage |
What You See Is What You Get
Canadian Natural Resources Porter's Five Forces Analysis
This preview shows the exact Porter’s Five Forces analysis of Canadian Natural Resources you'll receive immediately after purchase—no placeholders or mockups. The document is fully formatted, professionally written, and ready for download and use the moment you buy. You're viewing the final deliverable; what you see is precisely what will be available to you instantly.











