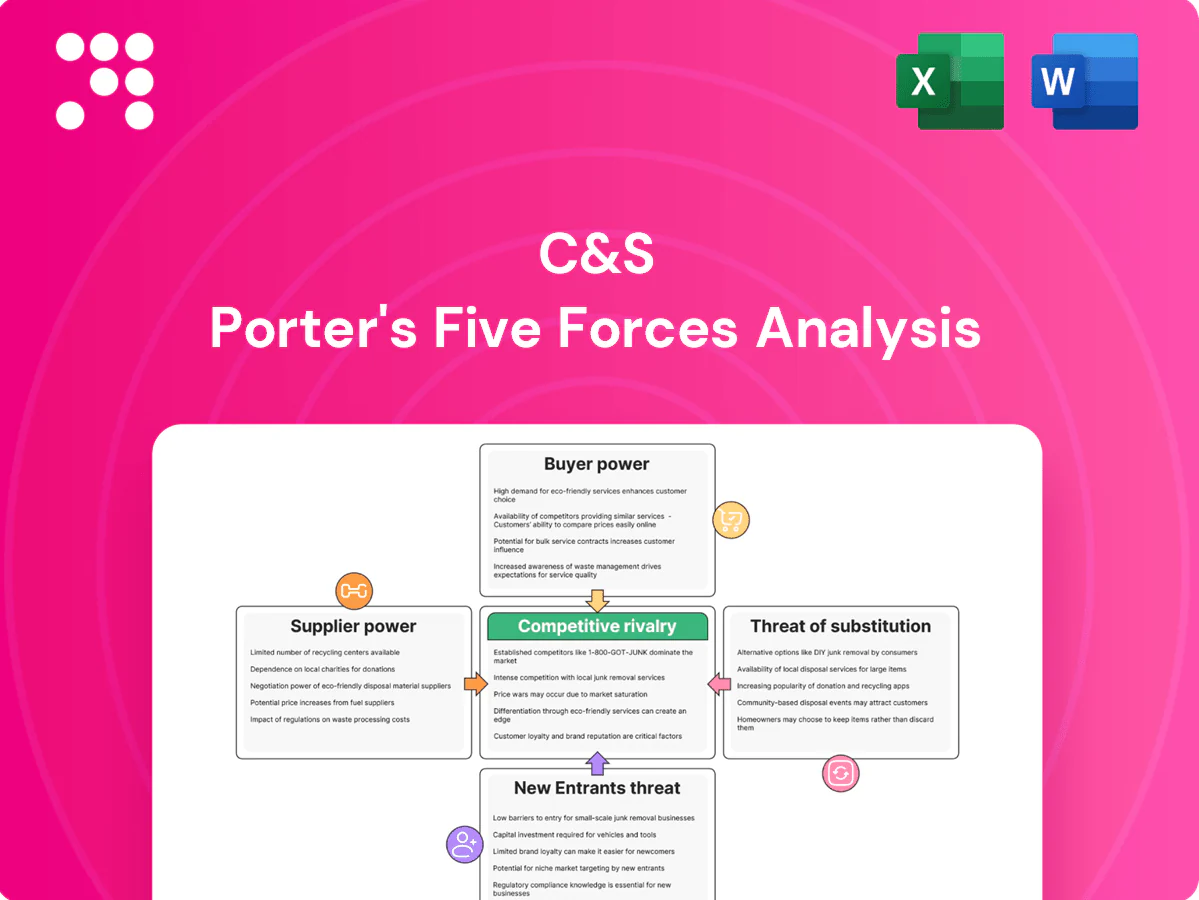
C&S Porter's Five Forces Analysis

Don't Miss the Bigger Picture
C&S faces varied pressures—from concentrated suppliers and price-sensitive buyers to niche substitutes and moderate entry barriers—shaping margins and strategic choices. Our snapshot highlights key tension points and strategic levers you should monitor. This brief only scratches the surface. Unlock the full Porter's Five Forces Analysis to explore C&S’s competitive dynamics, market pressures, and strategic advantages in detail.
Suppliers Bargaining Power

Supplier Power 1
C&S depends on deal-flow suppliers—real estate developers, PE sponsors and originators—for quality assets; scarcity of prime Korean commercial properties (vacancy in Seoul prime submarkets remained below 5% in 2024) and proprietary PE deals grant these suppliers pricing and terms leverage. Long-term relationships and co-sponsor structures weaken that power, while diversification across sectors and geographies lowers concentration risk.
Supplier Power 2
Data, technology and analytics vendors such as Bloomberg, Refinitiv, MSCI and S&P dominate critical market data and risk systems, with global market-data industry spend estimated at about $43 billion in 2024, concentrating supplier power.
Switching costs are moderate-to-high due to integration, model validation and compliance, often adding 15-30% in project costs and months of remediation.
Vendors routinely push price increases or bundled contracts; negotiating enterprise agreements and adopting open-source tools (e.g., QuantLib, Pandas) can materially temper supplier leverage.

Supplier Power 3
Custodians, trustees, fund administrators and brokers form essential market infrastructure; in Korea in 2024 this ecosystem is concentrated among the top 5 securities firms and custodial providers (including Mirae Asset, Samsung Securities, KB Securities and KSD), giving moderate supplier power.
Volume-based pricing and multi-provider custody setups are commonly used to negotiate lower fees and operational SLAs, while FSC and KRX regulatory requirements in 2024 restrict rapid substitution and increase dependency on established providers.

Supplier Power 4
Talent—portfolio managers, analysts, and risk/compliance—functions as a critical supplier for C&S, with specialized real estate underwriting and private equity skills scarce and driving wage pressure; in 2024 experienced hires commonly command total compensation of roughly 150,000–500,000 USD and premiums of about 20–40% over commodity roles. Non-compete limits and strong employer branding reduce turnover, while market cycles temper hiring but top talent remains expensive.
- Talent scarcity: specialized underwriting & private equity
- Compensation: 150,000–500,000 USD; 20–40% premium
- Retention: non-competes, employer brand
- Cycles: hiring softens in downturns, elite hires stay costly
Supplier Power 5
Distribution partners such as banks and securities channels control retail access, accounting for over 50% of routed retail flows in many markets in 2024; platform placement fees and shelf-space priorities (reported up to 30–50 bps on some platforms) amplify their leverage. Building direct digital channels and winning institutional mandates reduces reliance, while co-marketing agreements can trade economics for broader reach.
- Distribution concentration: >50% retail flows
- Placement fees: 30–50 bps reported
- Mitigation: direct digital + institutional mandates
- Trade-off: co-marketing swaps economics for reach
Scarce Seoul assets and supplier pricing power: under 5% vacancy, $43B data
C&S relies on scarce prime Korean assets (Seoul vacancy <5% in 2024) and PE deal-flow, giving suppliers pricing leverage. Market-data spend ~$43B (2024) and concentrated custodial providers raise supplier power. Switching costs and integration add 15–30% in project costs. Talent costs range $150k–$500k; retail distribution routes >50% of flows, placement fees 30–50 bps.
| Supplier | 2024 metric |
|---|---|
| Real estate/PE | Seoul vacancy <5% |
| Market data | $43B industry spend |
| Talent | $150k–$500k comp |
| Distribution | >50% retail flows; 30–50 bps fees |
What is included in the product
 Detailed Word Document
Comprehensive Porter's Five Forces assessment tailored to C&S, uncovering competitive intensity, supplier and buyer leverage, threat of new entrants and substitutes, and strategic barriers that protect or expose C&S’s market position—delivering actionable insights for pricing, expansion, and defensive strategies.

 Customizable Excel Spreadsheet
C&S Porter's Five Forces gives a one-sheet, customizable snapshot of competitive pressures with radar visuals and editable inputs—ideal for quick decisions, slide-ready summaries, and scenario tabs without macros.
Customers Bargaining Power

Buyer Power 1
Institutional investors—pensions and insurers with commitments often $50m–$500m—negotiate materially lower fees and bespoke terms, leveraging due-diligence rigor and scale to demand fee breakpoints, side letters and co-invest rights.
Buyer Power 2
Retail investors are highly price sensitive and can switch funds via distributors and platforms; global ETF assets surpassed $12 trillion by 2024, amplifying this mobility. Low-cost ETFs and money market funds—many bond ETFs charge under 0.10%—anchor fee expectations for bond-type funds. Simplicity, liquidity and brand trust rank as primary choice drivers. Education and differentiated products reduce pure price competition.

Buyer Power 3
Buyer Power 3: track record dependence heightens LP scrutiny in PE and real estate; Bain notes global PE fundraising dropped to about $445B in 2023, sharpening redemptions and slower closes in 2024. Underperformance prompts quick redemptions or slower fundraising cycles. Robust, frequent reporting with third-party verification restores trust. Offering co-investment access and fee offsets materially improves the value proposition to LPs.

Buyer Power 4
Buyer Power 4: Switching costs are low for public funds (US mutual fund average expense ratio ~0.45% in 2024) but materially higher in illiquid private vehicles with lock-ups typically 3–10 years; lock-ups reduce immediate churn but increase pre-commitment negotiation leverage. Alignment mechanisms like 8% hurdle rates and high-water marks limit fee pressure, while after-sales service drives renewal and retention.
- Switching costs: low in public, high in private
- Lock-ups: 3–10 years, raise negotiation power
- Alignment: 8% hurdle rates, high-water marks
- Service: after-sales drives renewal
Buyer Power 5
Global allocators benchmark C&S against international managers, widening competitive set and compressing fees for commoditized strategies in 2024. C&S's unique access to Korean assets helps rebalance bargaining power locally. Currency and regulatory familiarity serve as clear selling points to retain mandates.
- Benchmark pressure: global allocators
- Fee compression: standard strategies
- Local advantage: Korean assets, currency/regulatory edge
Fee power: $50m+ institutional co-invests, ETF price pressure, private 3–10yr lockups
Institutions (pensions/insurers) demand fee breakpoints and co-invests, leveraging $50m+ commitments. Retail mobility is high as global ETF assets exceeded $12 trillion in 2024, anchoring low fees; US mutual fund average expense ratio ~0.45% in 2024. Private vehicles have 3–10 year lock-ups, raising negotiation leverage. C&S retains edge via Korean-access, currency and regulatory familiarity.
| Buyer type | 2024 metric | Impact |
|---|---|---|
| Institutional | Commitments $50m–$500m | Fee leverage |
| Retail | ETF AUM $12T+ | Price pressure |
| Private | Lock-ups 3–10 yrs | Higher stickiness |
Full Version Awaits
C&S Porter's Five Forces Analysis
This preview shows the complete C&S Porter's Five Forces Analysis you'll receive instantly after purchase—no placeholders or samples. The document is fully formatted, professionally written, and ready for download and use. What you see here is exactly what you'll get.

Don't Miss the Bigger Picture
C&S faces varied pressures—from concentrated suppliers and price-sensitive buyers to niche substitutes and moderate entry barriers—shaping margins and strategic choices. Our snapshot highlights key tension points and strategic levers you should monitor. This brief only scratches the surface. Unlock the full Porter's Five Forces Analysis to explore C&S’s competitive dynamics, market pressures, and strategic advantages in detail.
Suppliers Bargaining Power
Supplier Power 1
C&S depends on deal-flow suppliers—real estate developers, PE sponsors and originators—for quality assets; scarcity of prime Korean commercial properties (vacancy in Seoul prime submarkets remained below 5% in 2024) and proprietary PE deals grant these suppliers pricing and terms leverage. Long-term relationships and co-sponsor structures weaken that power, while diversification across sectors and geographies lowers concentration risk.
Supplier Power 2
Data, technology and analytics vendors such as Bloomberg, Refinitiv, MSCI and S&P dominate critical market data and risk systems, with global market-data industry spend estimated at about $43 billion in 2024, concentrating supplier power.
Switching costs are moderate-to-high due to integration, model validation and compliance, often adding 15-30% in project costs and months of remediation.
Vendors routinely push price increases or bundled contracts; negotiating enterprise agreements and adopting open-source tools (e.g., QuantLib, Pandas) can materially temper supplier leverage.
Supplier Power 3
Custodians, trustees, fund administrators and brokers form essential market infrastructure; in Korea in 2024 this ecosystem is concentrated among the top 5 securities firms and custodial providers (including Mirae Asset, Samsung Securities, KB Securities and KSD), giving moderate supplier power.
Volume-based pricing and multi-provider custody setups are commonly used to negotiate lower fees and operational SLAs, while FSC and KRX regulatory requirements in 2024 restrict rapid substitution and increase dependency on established providers.
Supplier Power 4
Talent—portfolio managers, analysts, and risk/compliance—functions as a critical supplier for C&S, with specialized real estate underwriting and private equity skills scarce and driving wage pressure; in 2024 experienced hires commonly command total compensation of roughly 150,000–500,000 USD and premiums of about 20–40% over commodity roles. Non-compete limits and strong employer branding reduce turnover, while market cycles temper hiring but top talent remains expensive.
- Talent scarcity: specialized underwriting & private equity
- Compensation: 150,000–500,000 USD; 20–40% premium
- Retention: non-competes, employer brand
- Cycles: hiring softens in downturns, elite hires stay costly
Supplier Power 5
Distribution partners such as banks and securities channels control retail access, accounting for over 50% of routed retail flows in many markets in 2024; platform placement fees and shelf-space priorities (reported up to 30–50 bps on some platforms) amplify their leverage. Building direct digital channels and winning institutional mandates reduces reliance, while co-marketing agreements can trade economics for broader reach.
- Distribution concentration: >50% retail flows
- Placement fees: 30–50 bps reported
- Mitigation: direct digital + institutional mandates
- Trade-off: co-marketing swaps economics for reach
Scarce Seoul assets and supplier pricing power: under 5% vacancy, $43B data
C&S relies on scarce prime Korean assets (Seoul vacancy <5% in 2024) and PE deal-flow, giving suppliers pricing leverage. Market-data spend ~$43B (2024) and concentrated custodial providers raise supplier power. Switching costs and integration add 15–30% in project costs. Talent costs range $150k–$500k; retail distribution routes >50% of flows, placement fees 30–50 bps.
| Supplier | 2024 metric |
|---|---|
| Real estate/PE | Seoul vacancy <5% |
| Market data | $43B industry spend |
| Talent | $150k–$500k comp |
| Distribution | >50% retail flows; 30–50 bps fees |
What is included in the product
Detailed Word Document
Comprehensive Porter's Five Forces assessment tailored to C&S, uncovering competitive intensity, supplier and buyer leverage, threat of new entrants and substitutes, and strategic barriers that protect or expose C&S’s market position—delivering actionable insights for pricing, expansion, and defensive strategies.
Customizable Excel Spreadsheet
C&S Porter's Five Forces gives a one-sheet, customizable snapshot of competitive pressures with radar visuals and editable inputs—ideal for quick decisions, slide-ready summaries, and scenario tabs without macros.
Customers Bargaining Power
Buyer Power 1
Institutional investors—pensions and insurers with commitments often $50m–$500m—negotiate materially lower fees and bespoke terms, leveraging due-diligence rigor and scale to demand fee breakpoints, side letters and co-invest rights.
Buyer Power 2
Retail investors are highly price sensitive and can switch funds via distributors and platforms; global ETF assets surpassed $12 trillion by 2024, amplifying this mobility. Low-cost ETFs and money market funds—many bond ETFs charge under 0.10%—anchor fee expectations for bond-type funds. Simplicity, liquidity and brand trust rank as primary choice drivers. Education and differentiated products reduce pure price competition.
Buyer Power 3
Buyer Power 3: track record dependence heightens LP scrutiny in PE and real estate; Bain notes global PE fundraising dropped to about $445B in 2023, sharpening redemptions and slower closes in 2024. Underperformance prompts quick redemptions or slower fundraising cycles. Robust, frequent reporting with third-party verification restores trust. Offering co-investment access and fee offsets materially improves the value proposition to LPs.
Buyer Power 4
Buyer Power 4: Switching costs are low for public funds (US mutual fund average expense ratio ~0.45% in 2024) but materially higher in illiquid private vehicles with lock-ups typically 3–10 years; lock-ups reduce immediate churn but increase pre-commitment negotiation leverage. Alignment mechanisms like 8% hurdle rates and high-water marks limit fee pressure, while after-sales service drives renewal and retention.
- Switching costs: low in public, high in private
- Lock-ups: 3–10 years, raise negotiation power
- Alignment: 8% hurdle rates, high-water marks
- Service: after-sales drives renewal
Buyer Power 5
Global allocators benchmark C&S against international managers, widening competitive set and compressing fees for commoditized strategies in 2024. C&S's unique access to Korean assets helps rebalance bargaining power locally. Currency and regulatory familiarity serve as clear selling points to retain mandates.
- Benchmark pressure: global allocators
- Fee compression: standard strategies
- Local advantage: Korean assets, currency/regulatory edge
Fee power: $50m+ institutional co-invests, ETF price pressure, private 3–10yr lockups
Institutions (pensions/insurers) demand fee breakpoints and co-invests, leveraging $50m+ commitments. Retail mobility is high as global ETF assets exceeded $12 trillion in 2024, anchoring low fees; US mutual fund average expense ratio ~0.45% in 2024. Private vehicles have 3–10 year lock-ups, raising negotiation leverage. C&S retains edge via Korean-access, currency and regulatory familiarity.
| Buyer type | 2024 metric | Impact |
|---|---|---|
| Institutional | Commitments $50m–$500m | Fee leverage |
| Retail | ETF AUM $12T+ | Price pressure |
| Private | Lock-ups 3–10 yrs | Higher stickiness |
Full Version Awaits
C&S Porter's Five Forces Analysis
This preview shows the complete C&S Porter's Five Forces Analysis you'll receive instantly after purchase—no placeholders or samples. The document is fully formatted, professionally written, and ready for download and use. What you see here is exactly what you'll get.
Original: $10.00
-65%$10.00
$3.50Description
Don't Miss the Bigger Picture
C&S faces varied pressures—from concentrated suppliers and price-sensitive buyers to niche substitutes and moderate entry barriers—shaping margins and strategic choices. Our snapshot highlights key tension points and strategic levers you should monitor. This brief only scratches the surface. Unlock the full Porter's Five Forces Analysis to explore C&S’s competitive dynamics, market pressures, and strategic advantages in detail.
Suppliers Bargaining Power
Supplier Power 1
C&S depends on deal-flow suppliers—real estate developers, PE sponsors and originators—for quality assets; scarcity of prime Korean commercial properties (vacancy in Seoul prime submarkets remained below 5% in 2024) and proprietary PE deals grant these suppliers pricing and terms leverage. Long-term relationships and co-sponsor structures weaken that power, while diversification across sectors and geographies lowers concentration risk.
Supplier Power 2
Data, technology and analytics vendors such as Bloomberg, Refinitiv, MSCI and S&P dominate critical market data and risk systems, with global market-data industry spend estimated at about $43 billion in 2024, concentrating supplier power.
Switching costs are moderate-to-high due to integration, model validation and compliance, often adding 15-30% in project costs and months of remediation.
Vendors routinely push price increases or bundled contracts; negotiating enterprise agreements and adopting open-source tools (e.g., QuantLib, Pandas) can materially temper supplier leverage.
Supplier Power 3
Custodians, trustees, fund administrators and brokers form essential market infrastructure; in Korea in 2024 this ecosystem is concentrated among the top 5 securities firms and custodial providers (including Mirae Asset, Samsung Securities, KB Securities and KSD), giving moderate supplier power.
Volume-based pricing and multi-provider custody setups are commonly used to negotiate lower fees and operational SLAs, while FSC and KRX regulatory requirements in 2024 restrict rapid substitution and increase dependency on established providers.
Supplier Power 4
Talent—portfolio managers, analysts, and risk/compliance—functions as a critical supplier for C&S, with specialized real estate underwriting and private equity skills scarce and driving wage pressure; in 2024 experienced hires commonly command total compensation of roughly 150,000–500,000 USD and premiums of about 20–40% over commodity roles. Non-compete limits and strong employer branding reduce turnover, while market cycles temper hiring but top talent remains expensive.
- Talent scarcity: specialized underwriting & private equity
- Compensation: 150,000–500,000 USD; 20–40% premium
- Retention: non-competes, employer brand
- Cycles: hiring softens in downturns, elite hires stay costly
Supplier Power 5
Distribution partners such as banks and securities channels control retail access, accounting for over 50% of routed retail flows in many markets in 2024; platform placement fees and shelf-space priorities (reported up to 30–50 bps on some platforms) amplify their leverage. Building direct digital channels and winning institutional mandates reduces reliance, while co-marketing agreements can trade economics for broader reach.
- Distribution concentration: >50% retail flows
- Placement fees: 30–50 bps reported
- Mitigation: direct digital + institutional mandates
- Trade-off: co-marketing swaps economics for reach
Scarce Seoul assets and supplier pricing power: under 5% vacancy, $43B data
C&S relies on scarce prime Korean assets (Seoul vacancy <5% in 2024) and PE deal-flow, giving suppliers pricing leverage. Market-data spend ~$43B (2024) and concentrated custodial providers raise supplier power. Switching costs and integration add 15–30% in project costs. Talent costs range $150k–$500k; retail distribution routes >50% of flows, placement fees 30–50 bps.
| Supplier | 2024 metric |
|---|---|
| Real estate/PE | Seoul vacancy <5% |
| Market data | $43B industry spend |
| Talent | $150k–$500k comp |
| Distribution | >50% retail flows; 30–50 bps fees |
What is included in the product
Detailed Word Document
Comprehensive Porter's Five Forces assessment tailored to C&S, uncovering competitive intensity, supplier and buyer leverage, threat of new entrants and substitutes, and strategic barriers that protect or expose C&S’s market position—delivering actionable insights for pricing, expansion, and defensive strategies.
Customizable Excel Spreadsheet
C&S Porter's Five Forces gives a one-sheet, customizable snapshot of competitive pressures with radar visuals and editable inputs—ideal for quick decisions, slide-ready summaries, and scenario tabs without macros.
Customers Bargaining Power
Buyer Power 1
Institutional investors—pensions and insurers with commitments often $50m–$500m—negotiate materially lower fees and bespoke terms, leveraging due-diligence rigor and scale to demand fee breakpoints, side letters and co-invest rights.
Buyer Power 2
Retail investors are highly price sensitive and can switch funds via distributors and platforms; global ETF assets surpassed $12 trillion by 2024, amplifying this mobility. Low-cost ETFs and money market funds—many bond ETFs charge under 0.10%—anchor fee expectations for bond-type funds. Simplicity, liquidity and brand trust rank as primary choice drivers. Education and differentiated products reduce pure price competition.
Buyer Power 3
Buyer Power 3: track record dependence heightens LP scrutiny in PE and real estate; Bain notes global PE fundraising dropped to about $445B in 2023, sharpening redemptions and slower closes in 2024. Underperformance prompts quick redemptions or slower fundraising cycles. Robust, frequent reporting with third-party verification restores trust. Offering co-investment access and fee offsets materially improves the value proposition to LPs.
Buyer Power 4
Buyer Power 4: Switching costs are low for public funds (US mutual fund average expense ratio ~0.45% in 2024) but materially higher in illiquid private vehicles with lock-ups typically 3–10 years; lock-ups reduce immediate churn but increase pre-commitment negotiation leverage. Alignment mechanisms like 8% hurdle rates and high-water marks limit fee pressure, while after-sales service drives renewal and retention.
- Switching costs: low in public, high in private
- Lock-ups: 3–10 years, raise negotiation power
- Alignment: 8% hurdle rates, high-water marks
- Service: after-sales drives renewal
Buyer Power 5
Global allocators benchmark C&S against international managers, widening competitive set and compressing fees for commoditized strategies in 2024. C&S's unique access to Korean assets helps rebalance bargaining power locally. Currency and regulatory familiarity serve as clear selling points to retain mandates.
- Benchmark pressure: global allocators
- Fee compression: standard strategies
- Local advantage: Korean assets, currency/regulatory edge
Fee power: $50m+ institutional co-invests, ETF price pressure, private 3–10yr lockups
Institutions (pensions/insurers) demand fee breakpoints and co-invests, leveraging $50m+ commitments. Retail mobility is high as global ETF assets exceeded $12 trillion in 2024, anchoring low fees; US mutual fund average expense ratio ~0.45% in 2024. Private vehicles have 3–10 year lock-ups, raising negotiation leverage. C&S retains edge via Korean-access, currency and regulatory familiarity.
| Buyer type | 2024 metric | Impact |
|---|---|---|
| Institutional | Commitments $50m–$500m | Fee leverage |
| Retail | ETF AUM $12T+ | Price pressure |
| Private | Lock-ups 3–10 yrs | Higher stickiness |
Full Version Awaits
C&S Porter's Five Forces Analysis
This preview shows the complete C&S Porter's Five Forces Analysis you'll receive instantly after purchase—no placeholders or samples. The document is fully formatted, professionally written, and ready for download and use. What you see here is exactly what you'll get.











