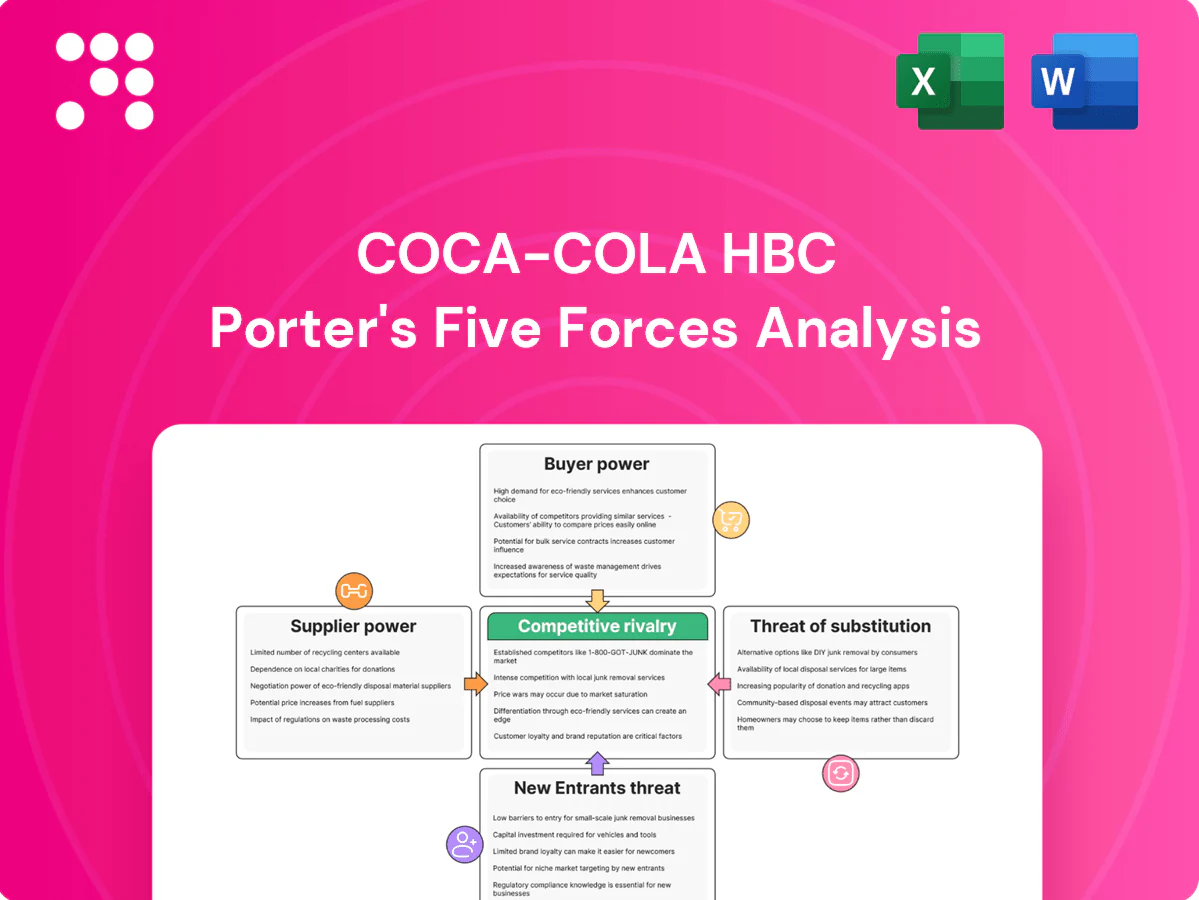
Coca-Cola HBC Porter's Five Forces Analysis

Go Beyond the Preview—Access the Full Strategic Report
Coca‑Cola HBC faces intense competitive rivalry and rising substitute threats, while strong distribution scale caps new entrants and suppliers exert limited leverage; buyers have moderate price sensitivity driven by retail consolidation. These dynamics pressure margins and make brand strength and route‑to‑market efficiency critical strategic levers. This preview is just the beginning. The full analysis provides a complete strategic snapshot with force-by-force ratings, visuals, and business implications tailored to Coca-Cola HBC.
Suppliers Bargaining Power

Exclusive concentrate dependency
Coca-Cola HBC depends on The Coca-Cola Company for proprietary concentrates, brands and marketing IP, a non-substitutable input that increases supplier leverage. Long-term concentrate and licensing agreements define pricing frameworks and quality standards across its 28-country footprint. Strategic alignment reduces operational risk but does not remove upstream bargaining power over cost and brand access.
Packaging and commodity volatility
Key inputs for Coca-Cola HBC include PET resin, aluminum cans, sugar/sweeteners, CO2 and glass; packaging and commodity cost swings are driven by energy and oil (Brent averaged ~85 USD/bbl in 2024) and industrial metals (aluminum ~2,200 USD/t in 2024), which can squeeze margins if not passed on. Multi-sourcing and hedging mitigate but do not fully neutralize spikes. Sustainability shifts to rPET and lightweighting add specification constraints that concentrate suppliers.

Logistics and utility dependencies
Bottling is energy-, water- and transport-intensive, tying Coca-Cola HBC’s operations to utilities and carriers; disruptions such as fuel shocks, strikes or port congestion raise cost-to-serve and can hit service levels. Regional diversification reduces systemic exposure but local bottlenecks (single-source plants, congested ports) still cause outsized impacts. Long-term carrier and utility contracts mitigate volatility but do not eliminate supplier bargaining power.

Specialized equipment and maintenance
Filling lines, blow-molding and cold-chain equipment are sourced mainly from OEMs such as KHS, Krones and Sidel, concentrating supply and raising dependence. High switching costs arise from systems integration, operator training and proprietary spare-parts ecosystems, while preventive maintenance contracts create recurring vendor lock-in. OEM consolidation in 2024 sustains moderate supplier leverage over Coca-Cola HBC.
- Key OEMs: KHS, Krones, Sidel
- High switching costs: integration, training, spares
- Recurring dependency: preventive maintenance contracts
Sustainability and compliance inputs
Sustainability and compliance inputs raise supplier power for Coca-Cola HBC as regulatory-driven rPET quotas (EU targets: 25% rPET in PET bottles by 2025, 30% by 2030) and expanding EPR schemes channel purchasing toward compliant suppliers, narrowing eligible pools across Europe in 2024. Tighter ESG standards increase input costs and reduce negotiation room, while proactive supplier development and long-term contracts partially offset margin pressure.
- rPET quotas: EU 25% by 2025, 30% by 2030
- EPR expansion: widespread implementation across EU in 2024
- Impact: higher costs, reduced supplier leverage
- Mitigation: supplier development, long-term sourcing
Major bottler faces supplier squeeze: Brent 85 USD/bbl, Al 2,200 USD/t
Coca-Cola HBC faces moderate-high supplier power: Coca-Cola Co. controls concentrates; packaging commodities driven by Brent ~85 USD/bbl (2024) and aluminum ~2,200 USD/t (2024) squeeze margins; OEM concentration (KHS, Krones, Sidel) raises switching costs; rPET quotas (EU 25% by 2025, 30% by 2030) and EPR narrow supplier pool.
| Factor | 2024 datapoint | Impact |
|---|---|---|
| Concentrates | Exclusive licensing | High leverage |
| Packaging | Brent ~85 USD/bbl; Al ~2,200 USD/t | Margin squeeze |
| rPET/EPR | EU 25% by 2025; 30% by 2030 | Narrowed suppliers |
| OEMs | KHS, Krones, Sidel | High switching cost |
What is included in the product
 Detailed Word Document
Concise Porter's Five Forces assessment of Coca‑Cola HBC, detailing competitive rivalry, supplier and buyer power, threat of entrants and substitutes, and highlighting disruptive threats, pricing pressure, and entry barriers shaping its profitability.

 Customizable Excel Spreadsheet
A concise, one-sheet Porter’s Five Forces for Coca‑Cola HBC that highlights supplier, buyer, competitive and regulatory pressures—ready to copy into pitch decks and customize with your own data for rapid strategic decisions.
Customers Bargaining Power

Concentrated modern retail
Large supermarkets, discounters and convenience chains command shelf space and volumes, with top retail groups in key CCH markets often controlling over half of modern grocery sales; they press CCH on price, payment terms, promotional funding and data sharing. Retail consolidation across multiple markets increases buyer power, though CCH mitigates this through joint business plans, category leadership and tailored trade spend to protect margins.
Fragmented HoReCa and traditional trade
Bars, restaurants, cafes and kiosks are numerous but small, so fragmentation in HoReCa and traditional trade limits individual bargaining power and helps sustain margins and mix. Coca‑Cola HBC operates across 28 countries and leverages cold equipment placements and service agreements to lock in relationships. Its route‑to‑market excellence and direct distribution networks support pricing resilience and promo control. These dynamics reduce customer leverage over pricing.

Private label and value tiers
Retailers increasingly push private-label waters and colas to pressure branded pricing, raising bargaining power over Coca-Cola HBC. Value and economy tiers heighten consumer price sensitivity during inflationary periods and shift volume away from core brands. Mix management and targeted innovation are used to defend premium positions and preserve brand equity. Strict promotional discipline is required to avoid margin dilution from deep discounting.

Switching costs and brand pull
Consumers exhibit strong loyalty to Coca-Cola brands, reducing buyer power: Coca-Cola HBC reported roughly €9.0bn net revenue in FY2023, reflecting resilient branded demand; delisting core SKUs risks material traffic loss for retailers. Exclusive HoReCa pouring deals increase switching costs, though buyers leverage seasonal promotional calendars to extract price and display concessions.
- Brand loyalty: lowers buyer leverage
- Delisting risk: traffic loss for buyers
- HoReCa exclusives: higher switching costs
- Promotional windows: bargaining leverage for buyers
Data, DSD, and service levels
Data-driven DSD, merchandising and cooler service make retailers dependent on Coca‑Cola HBC execution across 28 markets; retailers demand ~98% on‑shelf availability and rapid store response, and industry out‑of‑stock averages near 8%, turning service failures into immediate penalties or lost facings.
- DSD dependency
- 98% on‑shelf target
- ~8% out‑of‑stock
- Penalties and lost facings
Retail consolidation pressures margins; DSD, cooler exclusives and strict trade spend
Large consolidated retailers (often >50% of modern grocery) exert strong price/payment/promo pressure, but CCHB (28 markets, €9.0bn net revenue FY2023) offsets via DSD, cooler/service exclusives and joint business plans. HoReCa fragmentation and brand loyalty sustain margins, yet private‑label growth and promo windows raise buyer leverage, requiring strict trade spend discipline.
| Metric | Value |
|---|---|
| Markets | 28 |
| Net revenue (FY2023) | €9.0bn |
| On‑shelf target | ~98% |
| Out‑of‑stock avg | ~8% |
Same Document Delivered
Coca-Cola HBC Porter's Five Forces Analysis
This preview shows the exact Coca‑Cola HBC Porter's Five Forces analysis you'll receive immediately after purchase—no surprises, no placeholders. The comprehensive assessment covers rivalry, supplier and buyer power, and threats of entry and substitution with clear strategic implications. It's the professionally formatted file you'll be able to download and use instantly.

Go Beyond the Preview—Access the Full Strategic Report
Coca‑Cola HBC faces intense competitive rivalry and rising substitute threats, while strong distribution scale caps new entrants and suppliers exert limited leverage; buyers have moderate price sensitivity driven by retail consolidation. These dynamics pressure margins and make brand strength and route‑to‑market efficiency critical strategic levers. This preview is just the beginning. The full analysis provides a complete strategic snapshot with force-by-force ratings, visuals, and business implications tailored to Coca-Cola HBC.
Suppliers Bargaining Power
Exclusive concentrate dependency
Coca-Cola HBC depends on The Coca-Cola Company for proprietary concentrates, brands and marketing IP, a non-substitutable input that increases supplier leverage. Long-term concentrate and licensing agreements define pricing frameworks and quality standards across its 28-country footprint. Strategic alignment reduces operational risk but does not remove upstream bargaining power over cost and brand access.
Packaging and commodity volatility
Key inputs for Coca-Cola HBC include PET resin, aluminum cans, sugar/sweeteners, CO2 and glass; packaging and commodity cost swings are driven by energy and oil (Brent averaged ~85 USD/bbl in 2024) and industrial metals (aluminum ~2,200 USD/t in 2024), which can squeeze margins if not passed on. Multi-sourcing and hedging mitigate but do not fully neutralize spikes. Sustainability shifts to rPET and lightweighting add specification constraints that concentrate suppliers.
Logistics and utility dependencies
Bottling is energy-, water- and transport-intensive, tying Coca-Cola HBC’s operations to utilities and carriers; disruptions such as fuel shocks, strikes or port congestion raise cost-to-serve and can hit service levels. Regional diversification reduces systemic exposure but local bottlenecks (single-source plants, congested ports) still cause outsized impacts. Long-term carrier and utility contracts mitigate volatility but do not eliminate supplier bargaining power.
Specialized equipment and maintenance
Filling lines, blow-molding and cold-chain equipment are sourced mainly from OEMs such as KHS, Krones and Sidel, concentrating supply and raising dependence. High switching costs arise from systems integration, operator training and proprietary spare-parts ecosystems, while preventive maintenance contracts create recurring vendor lock-in. OEM consolidation in 2024 sustains moderate supplier leverage over Coca-Cola HBC.
- Key OEMs: KHS, Krones, Sidel
- High switching costs: integration, training, spares
- Recurring dependency: preventive maintenance contracts
Sustainability and compliance inputs
Sustainability and compliance inputs raise supplier power for Coca-Cola HBC as regulatory-driven rPET quotas (EU targets: 25% rPET in PET bottles by 2025, 30% by 2030) and expanding EPR schemes channel purchasing toward compliant suppliers, narrowing eligible pools across Europe in 2024. Tighter ESG standards increase input costs and reduce negotiation room, while proactive supplier development and long-term contracts partially offset margin pressure.
- rPET quotas: EU 25% by 2025, 30% by 2030
- EPR expansion: widespread implementation across EU in 2024
- Impact: higher costs, reduced supplier leverage
- Mitigation: supplier development, long-term sourcing
Major bottler faces supplier squeeze: Brent 85 USD/bbl, Al 2,200 USD/t
Coca-Cola HBC faces moderate-high supplier power: Coca-Cola Co. controls concentrates; packaging commodities driven by Brent ~85 USD/bbl (2024) and aluminum ~2,200 USD/t (2024) squeeze margins; OEM concentration (KHS, Krones, Sidel) raises switching costs; rPET quotas (EU 25% by 2025, 30% by 2030) and EPR narrow supplier pool.
| Factor | 2024 datapoint | Impact |
|---|---|---|
| Concentrates | Exclusive licensing | High leverage |
| Packaging | Brent ~85 USD/bbl; Al ~2,200 USD/t | Margin squeeze |
| rPET/EPR | EU 25% by 2025; 30% by 2030 | Narrowed suppliers |
| OEMs | KHS, Krones, Sidel | High switching cost |
What is included in the product
Detailed Word Document
Concise Porter's Five Forces assessment of Coca‑Cola HBC, detailing competitive rivalry, supplier and buyer power, threat of entrants and substitutes, and highlighting disruptive threats, pricing pressure, and entry barriers shaping its profitability.
Customizable Excel Spreadsheet
A concise, one-sheet Porter’s Five Forces for Coca‑Cola HBC that highlights supplier, buyer, competitive and regulatory pressures—ready to copy into pitch decks and customize with your own data for rapid strategic decisions.
Customers Bargaining Power
Concentrated modern retail
Large supermarkets, discounters and convenience chains command shelf space and volumes, with top retail groups in key CCH markets often controlling over half of modern grocery sales; they press CCH on price, payment terms, promotional funding and data sharing. Retail consolidation across multiple markets increases buyer power, though CCH mitigates this through joint business plans, category leadership and tailored trade spend to protect margins.
Fragmented HoReCa and traditional trade
Bars, restaurants, cafes and kiosks are numerous but small, so fragmentation in HoReCa and traditional trade limits individual bargaining power and helps sustain margins and mix. Coca‑Cola HBC operates across 28 countries and leverages cold equipment placements and service agreements to lock in relationships. Its route‑to‑market excellence and direct distribution networks support pricing resilience and promo control. These dynamics reduce customer leverage over pricing.
Private label and value tiers
Retailers increasingly push private-label waters and colas to pressure branded pricing, raising bargaining power over Coca-Cola HBC. Value and economy tiers heighten consumer price sensitivity during inflationary periods and shift volume away from core brands. Mix management and targeted innovation are used to defend premium positions and preserve brand equity. Strict promotional discipline is required to avoid margin dilution from deep discounting.
Switching costs and brand pull
Consumers exhibit strong loyalty to Coca-Cola brands, reducing buyer power: Coca-Cola HBC reported roughly €9.0bn net revenue in FY2023, reflecting resilient branded demand; delisting core SKUs risks material traffic loss for retailers. Exclusive HoReCa pouring deals increase switching costs, though buyers leverage seasonal promotional calendars to extract price and display concessions.
- Brand loyalty: lowers buyer leverage
- Delisting risk: traffic loss for buyers
- HoReCa exclusives: higher switching costs
- Promotional windows: bargaining leverage for buyers
Data, DSD, and service levels
Data-driven DSD, merchandising and cooler service make retailers dependent on Coca‑Cola HBC execution across 28 markets; retailers demand ~98% on‑shelf availability and rapid store response, and industry out‑of‑stock averages near 8%, turning service failures into immediate penalties or lost facings.
- DSD dependency
- 98% on‑shelf target
- ~8% out‑of‑stock
- Penalties and lost facings
Retail consolidation pressures margins; DSD, cooler exclusives and strict trade spend
Large consolidated retailers (often >50% of modern grocery) exert strong price/payment/promo pressure, but CCHB (28 markets, €9.0bn net revenue FY2023) offsets via DSD, cooler/service exclusives and joint business plans. HoReCa fragmentation and brand loyalty sustain margins, yet private‑label growth and promo windows raise buyer leverage, requiring strict trade spend discipline.
| Metric | Value |
|---|---|
| Markets | 28 |
| Net revenue (FY2023) | €9.0bn |
| On‑shelf target | ~98% |
| Out‑of‑stock avg | ~8% |
Same Document Delivered
Coca-Cola HBC Porter's Five Forces Analysis
This preview shows the exact Coca‑Cola HBC Porter's Five Forces analysis you'll receive immediately after purchase—no surprises, no placeholders. The comprehensive assessment covers rivalry, supplier and buyer power, and threats of entry and substitution with clear strategic implications. It's the professionally formatted file you'll be able to download and use instantly.
Original: $10.00
-65%$10.00
$3.50Description
Go Beyond the Preview—Access the Full Strategic Report
Coca‑Cola HBC faces intense competitive rivalry and rising substitute threats, while strong distribution scale caps new entrants and suppliers exert limited leverage; buyers have moderate price sensitivity driven by retail consolidation. These dynamics pressure margins and make brand strength and route‑to‑market efficiency critical strategic levers. This preview is just the beginning. The full analysis provides a complete strategic snapshot with force-by-force ratings, visuals, and business implications tailored to Coca-Cola HBC.
Suppliers Bargaining Power
Exclusive concentrate dependency
Coca-Cola HBC depends on The Coca-Cola Company for proprietary concentrates, brands and marketing IP, a non-substitutable input that increases supplier leverage. Long-term concentrate and licensing agreements define pricing frameworks and quality standards across its 28-country footprint. Strategic alignment reduces operational risk but does not remove upstream bargaining power over cost and brand access.
Packaging and commodity volatility
Key inputs for Coca-Cola HBC include PET resin, aluminum cans, sugar/sweeteners, CO2 and glass; packaging and commodity cost swings are driven by energy and oil (Brent averaged ~85 USD/bbl in 2024) and industrial metals (aluminum ~2,200 USD/t in 2024), which can squeeze margins if not passed on. Multi-sourcing and hedging mitigate but do not fully neutralize spikes. Sustainability shifts to rPET and lightweighting add specification constraints that concentrate suppliers.
Logistics and utility dependencies
Bottling is energy-, water- and transport-intensive, tying Coca-Cola HBC’s operations to utilities and carriers; disruptions such as fuel shocks, strikes or port congestion raise cost-to-serve and can hit service levels. Regional diversification reduces systemic exposure but local bottlenecks (single-source plants, congested ports) still cause outsized impacts. Long-term carrier and utility contracts mitigate volatility but do not eliminate supplier bargaining power.
Specialized equipment and maintenance
Filling lines, blow-molding and cold-chain equipment are sourced mainly from OEMs such as KHS, Krones and Sidel, concentrating supply and raising dependence. High switching costs arise from systems integration, operator training and proprietary spare-parts ecosystems, while preventive maintenance contracts create recurring vendor lock-in. OEM consolidation in 2024 sustains moderate supplier leverage over Coca-Cola HBC.
- Key OEMs: KHS, Krones, Sidel
- High switching costs: integration, training, spares
- Recurring dependency: preventive maintenance contracts
Sustainability and compliance inputs
Sustainability and compliance inputs raise supplier power for Coca-Cola HBC as regulatory-driven rPET quotas (EU targets: 25% rPET in PET bottles by 2025, 30% by 2030) and expanding EPR schemes channel purchasing toward compliant suppliers, narrowing eligible pools across Europe in 2024. Tighter ESG standards increase input costs and reduce negotiation room, while proactive supplier development and long-term contracts partially offset margin pressure.
- rPET quotas: EU 25% by 2025, 30% by 2030
- EPR expansion: widespread implementation across EU in 2024
- Impact: higher costs, reduced supplier leverage
- Mitigation: supplier development, long-term sourcing
Major bottler faces supplier squeeze: Brent 85 USD/bbl, Al 2,200 USD/t
Coca-Cola HBC faces moderate-high supplier power: Coca-Cola Co. controls concentrates; packaging commodities driven by Brent ~85 USD/bbl (2024) and aluminum ~2,200 USD/t (2024) squeeze margins; OEM concentration (KHS, Krones, Sidel) raises switching costs; rPET quotas (EU 25% by 2025, 30% by 2030) and EPR narrow supplier pool.
| Factor | 2024 datapoint | Impact |
|---|---|---|
| Concentrates | Exclusive licensing | High leverage |
| Packaging | Brent ~85 USD/bbl; Al ~2,200 USD/t | Margin squeeze |
| rPET/EPR | EU 25% by 2025; 30% by 2030 | Narrowed suppliers |
| OEMs | KHS, Krones, Sidel | High switching cost |
What is included in the product
Detailed Word Document
Concise Porter's Five Forces assessment of Coca‑Cola HBC, detailing competitive rivalry, supplier and buyer power, threat of entrants and substitutes, and highlighting disruptive threats, pricing pressure, and entry barriers shaping its profitability.
Customizable Excel Spreadsheet
A concise, one-sheet Porter’s Five Forces for Coca‑Cola HBC that highlights supplier, buyer, competitive and regulatory pressures—ready to copy into pitch decks and customize with your own data for rapid strategic decisions.
Customers Bargaining Power
Concentrated modern retail
Large supermarkets, discounters and convenience chains command shelf space and volumes, with top retail groups in key CCH markets often controlling over half of modern grocery sales; they press CCH on price, payment terms, promotional funding and data sharing. Retail consolidation across multiple markets increases buyer power, though CCH mitigates this through joint business plans, category leadership and tailored trade spend to protect margins.
Fragmented HoReCa and traditional trade
Bars, restaurants, cafes and kiosks are numerous but small, so fragmentation in HoReCa and traditional trade limits individual bargaining power and helps sustain margins and mix. Coca‑Cola HBC operates across 28 countries and leverages cold equipment placements and service agreements to lock in relationships. Its route‑to‑market excellence and direct distribution networks support pricing resilience and promo control. These dynamics reduce customer leverage over pricing.
Private label and value tiers
Retailers increasingly push private-label waters and colas to pressure branded pricing, raising bargaining power over Coca-Cola HBC. Value and economy tiers heighten consumer price sensitivity during inflationary periods and shift volume away from core brands. Mix management and targeted innovation are used to defend premium positions and preserve brand equity. Strict promotional discipline is required to avoid margin dilution from deep discounting.
Switching costs and brand pull
Consumers exhibit strong loyalty to Coca-Cola brands, reducing buyer power: Coca-Cola HBC reported roughly €9.0bn net revenue in FY2023, reflecting resilient branded demand; delisting core SKUs risks material traffic loss for retailers. Exclusive HoReCa pouring deals increase switching costs, though buyers leverage seasonal promotional calendars to extract price and display concessions.
- Brand loyalty: lowers buyer leverage
- Delisting risk: traffic loss for buyers
- HoReCa exclusives: higher switching costs
- Promotional windows: bargaining leverage for buyers
Data, DSD, and service levels
Data-driven DSD, merchandising and cooler service make retailers dependent on Coca‑Cola HBC execution across 28 markets; retailers demand ~98% on‑shelf availability and rapid store response, and industry out‑of‑stock averages near 8%, turning service failures into immediate penalties or lost facings.
- DSD dependency
- 98% on‑shelf target
- ~8% out‑of‑stock
- Penalties and lost facings
Retail consolidation pressures margins; DSD, cooler exclusives and strict trade spend
Large consolidated retailers (often >50% of modern grocery) exert strong price/payment/promo pressure, but CCHB (28 markets, €9.0bn net revenue FY2023) offsets via DSD, cooler/service exclusives and joint business plans. HoReCa fragmentation and brand loyalty sustain margins, yet private‑label growth and promo windows raise buyer leverage, requiring strict trade spend discipline.
| Metric | Value |
|---|---|
| Markets | 28 |
| Net revenue (FY2023) | €9.0bn |
| On‑shelf target | ~98% |
| Out‑of‑stock avg | ~8% |
Same Document Delivered
Coca-Cola HBC Porter's Five Forces Analysis
This preview shows the exact Coca‑Cola HBC Porter's Five Forces analysis you'll receive immediately after purchase—no surprises, no placeholders. The comprehensive assessment covers rivalry, supplier and buyer power, and threats of entry and substitution with clear strategic implications. It's the professionally formatted file you'll be able to download and use instantly.











