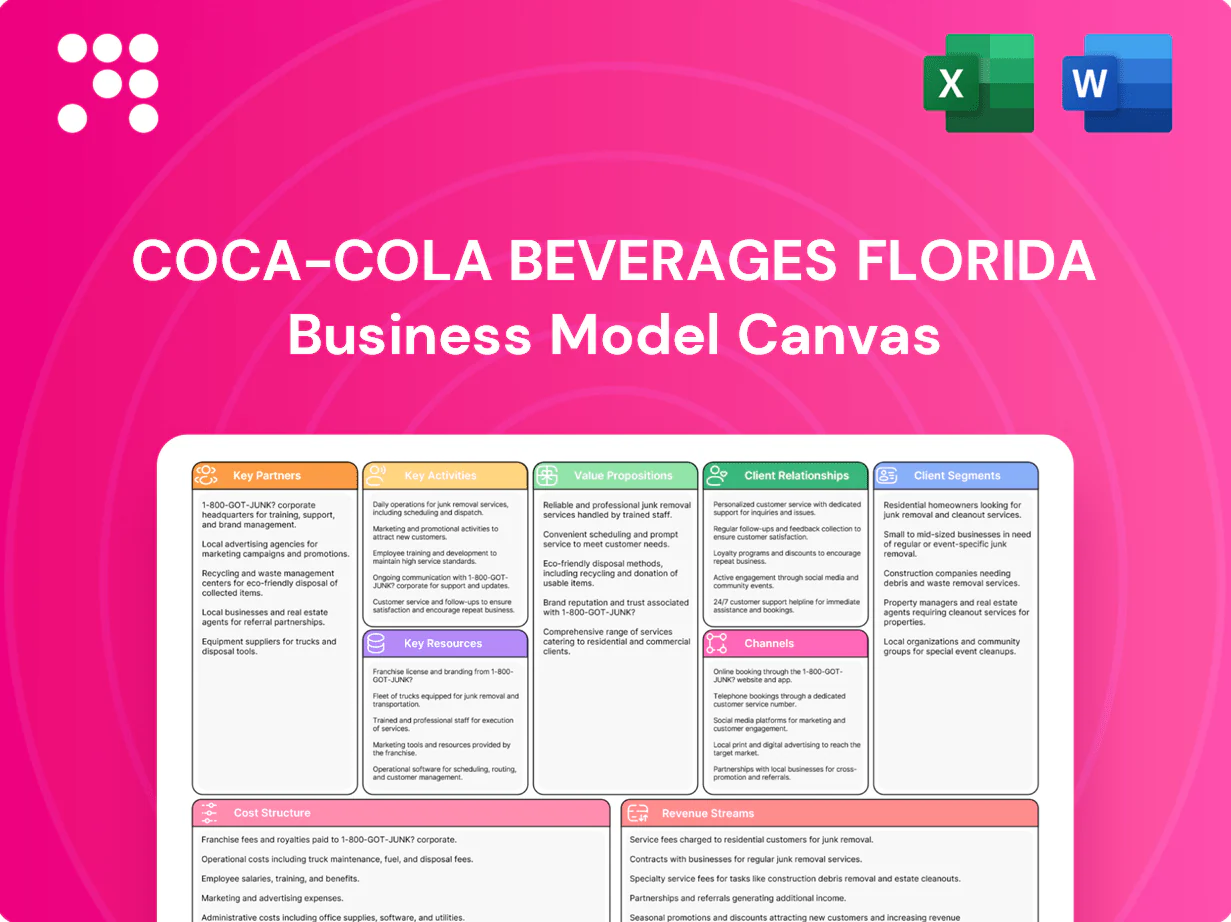
Coca-Cola Beverages Florida Business Model Canvas

Business Model Canvas: Strategic Blueprint for Beverage Market Growth
Unlock the full strategic blueprint behind Coca-Cola Beverages Florida with our Business Model Canvas. This concise, actionable document maps value propositions, key partnerships, revenue streams and cost structure to show how the company scales and wins market share. Ideal for investors, consultants, and founders—download the complete Word & Excel canvas to benchmark and implement proven strategies.
Partnerships

The Coca-Cola Company franchise
The Coca-Cola Company franchise supplies concentrates, brands and marketing assets to Coca-Cola Beverages Florida under a territorial agreement and aligns on pricing corridors, innovation launches and commercial priorities. The franchisor enforces brand standards, quality protocols and system-wide compliance and provides growth funding and joint business planning support. Coca-Cola Co reported roughly $43.0 billion revenue in 2023, underpinning its scale of investment.
Packaging and ingredient suppliers
Strategic suppliers for PET preforms, aluminum cans, closures, labels, sweeteners, CO2 and water-treatment chemicals are contracted to secure quality and availability; long-term agreements stabilize pricing and supply for bottling operations. Collaboration with vendors on lightweighting and increasing recycled content supports Coca-Cola's World Without Waste goal of 50% recycled PET by 2030 and reduces material cost per unit. Vendor-managed inventory programs cut stockouts and free working capital by shifting replenishment responsibility to suppliers, improving production continuity and cash flow.

Retail and foodservice customers
Key accounts in Florida partner on assortments, promotions and planograms to drive category growth across a market serving about 22.2 million residents. Joint business planning aligns volume, margin and service expectations to meet retailer on-shelf availability targets (≈97%). Data sharing improves forecast accuracy and shelf execution. Co-op marketing funds accelerate velocity and deepen brand penetration.

Logistics, equipment, and tech providers
Fleet leasing, route-optimization, telematics, and WMS/TMS partners cut delivery miles by up to 15–20% and improve on-time deliveries ~15–20%, lowering operational cost and fuel spend for Coca-Cola Beverages Florida in 2024.
Equipment OEMs and preventive-maintenance contracts keep coolers, fountains, and vending uptime above 95%, while IoT, ERP, and EDI integrations streamline ordering and billing; cold-chain and last-mile partners flex capacity for seasonal peaks.
- Fleet: route optimization 15–20% mile reduction
- Telematics: ~10–15% fuel efficiency gains
- Uptime: equipment >95%
- Peak: cold-chain flex capacity for seasonal volume spikes
Recycling, sustainability, and regulatory bodies
Partnerships with recyclers and deposit programs accelerate PET and aluminum collection, advancing Coca‑Cola Beverages Florida toward Coca‑Cola’s World Without Waste goals (collect a bottle/can for each sold; 50% recycled PET by 2030). Utilities and water stewardship groups improve resource efficiency across operations serving Florida’s ~22.2M residents. Compliance with FDA, OSHA, DOT and state regulators protects operations, while community organizations enable local engagement and brand goodwill.
- Recycling: aligns with World Without Waste targets (50% rPET by 2030)
- Water: partners with utilities for efficiency across a 22.2M-population state
- Compliance: FDA, OSHA, DOT, state regs
- Community: local NGOs drive engagement and brand trust
Franchisor-led chain reaches $43.0B, 50% rPET by 2030; logistics cut miles 15–20%
Franchisor supplies concentrates, brands and $43.0B scale (2023) while enforcing brand standards and joint business planning. Strategic suppliers secure PET, cans, sweeteners and CO2 with long-term contracts and rPET initiatives (50% by 2030). Logistics, equipment OEMs and recyclers cut miles 15–20%, keep cooler uptime >95% and support collection targets across Florida (~22.2M).
| Partner | Metric | 2024/2023 |
|---|---|---|
| Franchisor | Revenue | $43.0B (2023) |
| Logistics | Miles↓ / On-time | 15–20% / ≈95% |
| Packaging | rPET target | 50% by 2030 |
What is included in the product
 Detailed Word Document
A concise, ready-to-use Business Model Canvas for Coca-Cola Beverages Florida detailing customer segments, channels, value propositions, key activities, partners, resources, cost structure and revenue streams aligned with real-world distribution, sales and marketing operations; ideal for presentations, investor discussions and strategic analysis with linked competitive advantages and SWOT insights.

 Customizable Excel Spreadsheet
High-level view of Coca‑Cola Beverages Florida’s business model with editable cells, relieving the pain of assembling fragmented distribution, route-to-market and franchisee data for faster decisions.
Activities

Beverage production and quality
Bottling operations across CCBF plants integrate syrup blending, carbonation, filling and packaging with HACCP, GMP and ISO 9001:2015-aligned quality systems to ensure safety and consistency. Line changeover optimization and OEE programs target world-class OEE near 85% to boost throughput and lower unit cost. Preventive maintenance programs sustain plant uptime above 95% and protect product integrity.
Sales, merchandising, and execution
Field sales secure orders, shelf space, and promotions across retail and on‑premise, reaching Florida’s ~22.5 million residents (2024 est.) to drive velocity. Merchandisers ensure shelf availability, branded displays, and planogram compliance to minimize OOS and lift category sales. Activation of price‑pack architecture (PPA) optimizes revenue and mix through targeted pack/pricing tiers. Local marketing funds support product launches and seasonal programs at store and community level.

Distribution and route logistics
Direct-store, warehouse and foodservice routes blanket the territory with DSD and warehouse drops supported by dynamic routing and load-building to maximize fill rates; telematics and route optimization typically cut miles and fuel use by 10–20% in comparable beverage networks (2024 industry data). Cold-equipment placement and service drive availability that can lift on-premise sales by up to 20–30%. Peak management plans smooth demand spikes from storms and events, where volume can surge double-digit percentages.

Forecasting and revenue growth management
Demand planning integrates POS, promotions and seasonality to shape weekly forecasts; RGM sets price-pack, trade terms and channel mix targets; S&OP aligns production, inventory and service levels to those targets; analytics identify gaps, price elasticity and assortment opportunities to lift category profitability.
- Demand planning: POS + promos + seasonality
- RGM: price-pack, trade terms, mix by channel
- S&OP: production, inventory, service alignment
- Analytics: gaps, elasticity, assortment
Compliance, safety, and sustainability
Compliance with food, worker and transport regulations is enforced through certified HACCP, OSHA-aligned programs and vetted carrier audits to ensure product integrity and safe distribution.
Water, energy and waste reduction initiatives cut operational footprint and lower costs via continuous improvement projects and utility optimization.
Recycling and customer take-back programs advance circularity while training embeds a culture of safety and ongoing performance improvement.
- HACCP certified operations
- OSHA-aligned safety training
- Water/energy/waste reduction programs
- Recycling and take-back initiatives
OEE 85%, uptime >95%, Florida reach 22.5M
Bottling and QA: OEE target 85% and plant uptime >95% with HACCP and ISO 9001:2015.
Sales & marketing: DSD/field reach Florida 22.5M (2024), PPA and local funds drive velocity.
Logistics: route optimization/telematics cut miles/fuel 10–20%; cold equipment boosts on‑premise sales 20–30%.
S&OP & analytics: POS-driven demand planning, RGM and S&OP align production, inventory and service.
| Metric | Value |
|---|---|
| Florida population (2024) | 22.5M |
| OEE target | 85% |
| Plant uptime | >95% |
| Fuel/miles reduction | 10–20% |
| On‑premise sales lift | 20–30% |
Preview Before You Purchase
Business Model Canvas
The Coca‑Cola Beverages Florida Business Model Canvas shown here is the actual file you’ll receive—this is not a mockup. When you purchase, you’ll get the same complete document, formatted and ready to use. No hidden pages or placeholders, just the full, editable Business Model Canvas. Purchase grants instant access to this exact deliverable.

Business Model Canvas: Strategic Blueprint for Beverage Market Growth
Unlock the full strategic blueprint behind Coca-Cola Beverages Florida with our Business Model Canvas. This concise, actionable document maps value propositions, key partnerships, revenue streams and cost structure to show how the company scales and wins market share. Ideal for investors, consultants, and founders—download the complete Word & Excel canvas to benchmark and implement proven strategies.
Partnerships
The Coca-Cola Company franchise
The Coca-Cola Company franchise supplies concentrates, brands and marketing assets to Coca-Cola Beverages Florida under a territorial agreement and aligns on pricing corridors, innovation launches and commercial priorities. The franchisor enforces brand standards, quality protocols and system-wide compliance and provides growth funding and joint business planning support. Coca-Cola Co reported roughly $43.0 billion revenue in 2023, underpinning its scale of investment.
Packaging and ingredient suppliers
Strategic suppliers for PET preforms, aluminum cans, closures, labels, sweeteners, CO2 and water-treatment chemicals are contracted to secure quality and availability; long-term agreements stabilize pricing and supply for bottling operations. Collaboration with vendors on lightweighting and increasing recycled content supports Coca-Cola's World Without Waste goal of 50% recycled PET by 2030 and reduces material cost per unit. Vendor-managed inventory programs cut stockouts and free working capital by shifting replenishment responsibility to suppliers, improving production continuity and cash flow.
Retail and foodservice customers
Key accounts in Florida partner on assortments, promotions and planograms to drive category growth across a market serving about 22.2 million residents. Joint business planning aligns volume, margin and service expectations to meet retailer on-shelf availability targets (≈97%). Data sharing improves forecast accuracy and shelf execution. Co-op marketing funds accelerate velocity and deepen brand penetration.
Logistics, equipment, and tech providers
Fleet leasing, route-optimization, telematics, and WMS/TMS partners cut delivery miles by up to 15–20% and improve on-time deliveries ~15–20%, lowering operational cost and fuel spend for Coca-Cola Beverages Florida in 2024.
Equipment OEMs and preventive-maintenance contracts keep coolers, fountains, and vending uptime above 95%, while IoT, ERP, and EDI integrations streamline ordering and billing; cold-chain and last-mile partners flex capacity for seasonal peaks.
- Fleet: route optimization 15–20% mile reduction
- Telematics: ~10–15% fuel efficiency gains
- Uptime: equipment >95%
- Peak: cold-chain flex capacity for seasonal volume spikes
Recycling, sustainability, and regulatory bodies
Partnerships with recyclers and deposit programs accelerate PET and aluminum collection, advancing Coca‑Cola Beverages Florida toward Coca‑Cola’s World Without Waste goals (collect a bottle/can for each sold; 50% recycled PET by 2030). Utilities and water stewardship groups improve resource efficiency across operations serving Florida’s ~22.2M residents. Compliance with FDA, OSHA, DOT and state regulators protects operations, while community organizations enable local engagement and brand goodwill.
- Recycling: aligns with World Without Waste targets (50% rPET by 2030)
- Water: partners with utilities for efficiency across a 22.2M-population state
- Compliance: FDA, OSHA, DOT, state regs
- Community: local NGOs drive engagement and brand trust
Franchisor-led chain reaches $43.0B, 50% rPET by 2030; logistics cut miles 15–20%
Franchisor supplies concentrates, brands and $43.0B scale (2023) while enforcing brand standards and joint business planning. Strategic suppliers secure PET, cans, sweeteners and CO2 with long-term contracts and rPET initiatives (50% by 2030). Logistics, equipment OEMs and recyclers cut miles 15–20%, keep cooler uptime >95% and support collection targets across Florida (~22.2M).
| Partner | Metric | 2024/2023 |
|---|---|---|
| Franchisor | Revenue | $43.0B (2023) |
| Logistics | Miles↓ / On-time | 15–20% / ≈95% |
| Packaging | rPET target | 50% by 2030 |
What is included in the product
Detailed Word Document
A concise, ready-to-use Business Model Canvas for Coca-Cola Beverages Florida detailing customer segments, channels, value propositions, key activities, partners, resources, cost structure and revenue streams aligned with real-world distribution, sales and marketing operations; ideal for presentations, investor discussions and strategic analysis with linked competitive advantages and SWOT insights.
Customizable Excel Spreadsheet
High-level view of Coca‑Cola Beverages Florida’s business model with editable cells, relieving the pain of assembling fragmented distribution, route-to-market and franchisee data for faster decisions.
Activities
Beverage production and quality
Bottling operations across CCBF plants integrate syrup blending, carbonation, filling and packaging with HACCP, GMP and ISO 9001:2015-aligned quality systems to ensure safety and consistency. Line changeover optimization and OEE programs target world-class OEE near 85% to boost throughput and lower unit cost. Preventive maintenance programs sustain plant uptime above 95% and protect product integrity.
Sales, merchandising, and execution
Field sales secure orders, shelf space, and promotions across retail and on‑premise, reaching Florida’s ~22.5 million residents (2024 est.) to drive velocity. Merchandisers ensure shelf availability, branded displays, and planogram compliance to minimize OOS and lift category sales. Activation of price‑pack architecture (PPA) optimizes revenue and mix through targeted pack/pricing tiers. Local marketing funds support product launches and seasonal programs at store and community level.
Distribution and route logistics
Direct-store, warehouse and foodservice routes blanket the territory with DSD and warehouse drops supported by dynamic routing and load-building to maximize fill rates; telematics and route optimization typically cut miles and fuel use by 10–20% in comparable beverage networks (2024 industry data). Cold-equipment placement and service drive availability that can lift on-premise sales by up to 20–30%. Peak management plans smooth demand spikes from storms and events, where volume can surge double-digit percentages.
Forecasting and revenue growth management
Demand planning integrates POS, promotions and seasonality to shape weekly forecasts; RGM sets price-pack, trade terms and channel mix targets; S&OP aligns production, inventory and service levels to those targets; analytics identify gaps, price elasticity and assortment opportunities to lift category profitability.
- Demand planning: POS + promos + seasonality
- RGM: price-pack, trade terms, mix by channel
- S&OP: production, inventory, service alignment
- Analytics: gaps, elasticity, assortment
Compliance, safety, and sustainability
Compliance with food, worker and transport regulations is enforced through certified HACCP, OSHA-aligned programs and vetted carrier audits to ensure product integrity and safe distribution.
Water, energy and waste reduction initiatives cut operational footprint and lower costs via continuous improvement projects and utility optimization.
Recycling and customer take-back programs advance circularity while training embeds a culture of safety and ongoing performance improvement.
- HACCP certified operations
- OSHA-aligned safety training
- Water/energy/waste reduction programs
- Recycling and take-back initiatives
OEE 85%, uptime >95%, Florida reach 22.5M
Bottling and QA: OEE target 85% and plant uptime >95% with HACCP and ISO 9001:2015.
Sales & marketing: DSD/field reach Florida 22.5M (2024), PPA and local funds drive velocity.
Logistics: route optimization/telematics cut miles/fuel 10–20%; cold equipment boosts on‑premise sales 20–30%.
S&OP & analytics: POS-driven demand planning, RGM and S&OP align production, inventory and service.
| Metric | Value |
|---|---|
| Florida population (2024) | 22.5M |
| OEE target | 85% |
| Plant uptime | >95% |
| Fuel/miles reduction | 10–20% |
| On‑premise sales lift | 20–30% |
Preview Before You Purchase
Business Model Canvas
The Coca‑Cola Beverages Florida Business Model Canvas shown here is the actual file you’ll receive—this is not a mockup. When you purchase, you’ll get the same complete document, formatted and ready to use. No hidden pages or placeholders, just the full, editable Business Model Canvas. Purchase grants instant access to this exact deliverable.
Original: $10.00
-65%$10.00
$3.50Description
Business Model Canvas: Strategic Blueprint for Beverage Market Growth
Unlock the full strategic blueprint behind Coca-Cola Beverages Florida with our Business Model Canvas. This concise, actionable document maps value propositions, key partnerships, revenue streams and cost structure to show how the company scales and wins market share. Ideal for investors, consultants, and founders—download the complete Word & Excel canvas to benchmark and implement proven strategies.
Partnerships
The Coca-Cola Company franchise
The Coca-Cola Company franchise supplies concentrates, brands and marketing assets to Coca-Cola Beverages Florida under a territorial agreement and aligns on pricing corridors, innovation launches and commercial priorities. The franchisor enforces brand standards, quality protocols and system-wide compliance and provides growth funding and joint business planning support. Coca-Cola Co reported roughly $43.0 billion revenue in 2023, underpinning its scale of investment.
Packaging and ingredient suppliers
Strategic suppliers for PET preforms, aluminum cans, closures, labels, sweeteners, CO2 and water-treatment chemicals are contracted to secure quality and availability; long-term agreements stabilize pricing and supply for bottling operations. Collaboration with vendors on lightweighting and increasing recycled content supports Coca-Cola's World Without Waste goal of 50% recycled PET by 2030 and reduces material cost per unit. Vendor-managed inventory programs cut stockouts and free working capital by shifting replenishment responsibility to suppliers, improving production continuity and cash flow.
Retail and foodservice customers
Key accounts in Florida partner on assortments, promotions and planograms to drive category growth across a market serving about 22.2 million residents. Joint business planning aligns volume, margin and service expectations to meet retailer on-shelf availability targets (≈97%). Data sharing improves forecast accuracy and shelf execution. Co-op marketing funds accelerate velocity and deepen brand penetration.
Logistics, equipment, and tech providers
Fleet leasing, route-optimization, telematics, and WMS/TMS partners cut delivery miles by up to 15–20% and improve on-time deliveries ~15–20%, lowering operational cost and fuel spend for Coca-Cola Beverages Florida in 2024.
Equipment OEMs and preventive-maintenance contracts keep coolers, fountains, and vending uptime above 95%, while IoT, ERP, and EDI integrations streamline ordering and billing; cold-chain and last-mile partners flex capacity for seasonal peaks.
- Fleet: route optimization 15–20% mile reduction
- Telematics: ~10–15% fuel efficiency gains
- Uptime: equipment >95%
- Peak: cold-chain flex capacity for seasonal volume spikes
Recycling, sustainability, and regulatory bodies
Partnerships with recyclers and deposit programs accelerate PET and aluminum collection, advancing Coca‑Cola Beverages Florida toward Coca‑Cola’s World Without Waste goals (collect a bottle/can for each sold; 50% recycled PET by 2030). Utilities and water stewardship groups improve resource efficiency across operations serving Florida’s ~22.2M residents. Compliance with FDA, OSHA, DOT and state regulators protects operations, while community organizations enable local engagement and brand goodwill.
- Recycling: aligns with World Without Waste targets (50% rPET by 2030)
- Water: partners with utilities for efficiency across a 22.2M-population state
- Compliance: FDA, OSHA, DOT, state regs
- Community: local NGOs drive engagement and brand trust
Franchisor-led chain reaches $43.0B, 50% rPET by 2030; logistics cut miles 15–20%
Franchisor supplies concentrates, brands and $43.0B scale (2023) while enforcing brand standards and joint business planning. Strategic suppliers secure PET, cans, sweeteners and CO2 with long-term contracts and rPET initiatives (50% by 2030). Logistics, equipment OEMs and recyclers cut miles 15–20%, keep cooler uptime >95% and support collection targets across Florida (~22.2M).
| Partner | Metric | 2024/2023 |
|---|---|---|
| Franchisor | Revenue | $43.0B (2023) |
| Logistics | Miles↓ / On-time | 15–20% / ≈95% |
| Packaging | rPET target | 50% by 2030 |
What is included in the product
Detailed Word Document
A concise, ready-to-use Business Model Canvas for Coca-Cola Beverages Florida detailing customer segments, channels, value propositions, key activities, partners, resources, cost structure and revenue streams aligned with real-world distribution, sales and marketing operations; ideal for presentations, investor discussions and strategic analysis with linked competitive advantages and SWOT insights.
Customizable Excel Spreadsheet
High-level view of Coca‑Cola Beverages Florida’s business model with editable cells, relieving the pain of assembling fragmented distribution, route-to-market and franchisee data for faster decisions.
Activities
Beverage production and quality
Bottling operations across CCBF plants integrate syrup blending, carbonation, filling and packaging with HACCP, GMP and ISO 9001:2015-aligned quality systems to ensure safety and consistency. Line changeover optimization and OEE programs target world-class OEE near 85% to boost throughput and lower unit cost. Preventive maintenance programs sustain plant uptime above 95% and protect product integrity.
Sales, merchandising, and execution
Field sales secure orders, shelf space, and promotions across retail and on‑premise, reaching Florida’s ~22.5 million residents (2024 est.) to drive velocity. Merchandisers ensure shelf availability, branded displays, and planogram compliance to minimize OOS and lift category sales. Activation of price‑pack architecture (PPA) optimizes revenue and mix through targeted pack/pricing tiers. Local marketing funds support product launches and seasonal programs at store and community level.
Distribution and route logistics
Direct-store, warehouse and foodservice routes blanket the territory with DSD and warehouse drops supported by dynamic routing and load-building to maximize fill rates; telematics and route optimization typically cut miles and fuel use by 10–20% in comparable beverage networks (2024 industry data). Cold-equipment placement and service drive availability that can lift on-premise sales by up to 20–30%. Peak management plans smooth demand spikes from storms and events, where volume can surge double-digit percentages.
Forecasting and revenue growth management
Demand planning integrates POS, promotions and seasonality to shape weekly forecasts; RGM sets price-pack, trade terms and channel mix targets; S&OP aligns production, inventory and service levels to those targets; analytics identify gaps, price elasticity and assortment opportunities to lift category profitability.
- Demand planning: POS + promos + seasonality
- RGM: price-pack, trade terms, mix by channel
- S&OP: production, inventory, service alignment
- Analytics: gaps, elasticity, assortment
Compliance, safety, and sustainability
Compliance with food, worker and transport regulations is enforced through certified HACCP, OSHA-aligned programs and vetted carrier audits to ensure product integrity and safe distribution.
Water, energy and waste reduction initiatives cut operational footprint and lower costs via continuous improvement projects and utility optimization.
Recycling and customer take-back programs advance circularity while training embeds a culture of safety and ongoing performance improvement.
- HACCP certified operations
- OSHA-aligned safety training
- Water/energy/waste reduction programs
- Recycling and take-back initiatives
OEE 85%, uptime >95%, Florida reach 22.5M
Bottling and QA: OEE target 85% and plant uptime >95% with HACCP and ISO 9001:2015.
Sales & marketing: DSD/field reach Florida 22.5M (2024), PPA and local funds drive velocity.
Logistics: route optimization/telematics cut miles/fuel 10–20%; cold equipment boosts on‑premise sales 20–30%.
S&OP & analytics: POS-driven demand planning, RGM and S&OP align production, inventory and service.
| Metric | Value |
|---|---|
| Florida population (2024) | 22.5M |
| OEE target | 85% |
| Plant uptime | >95% |
| Fuel/miles reduction | 10–20% |
| On‑premise sales lift | 20–30% |
Preview Before You Purchase
Business Model Canvas
The Coca‑Cola Beverages Florida Business Model Canvas shown here is the actual file you’ll receive—this is not a mockup. When you purchase, you’ll get the same complete document, formatted and ready to use. No hidden pages or placeholders, just the full, editable Business Model Canvas. Purchase grants instant access to this exact deliverable.











