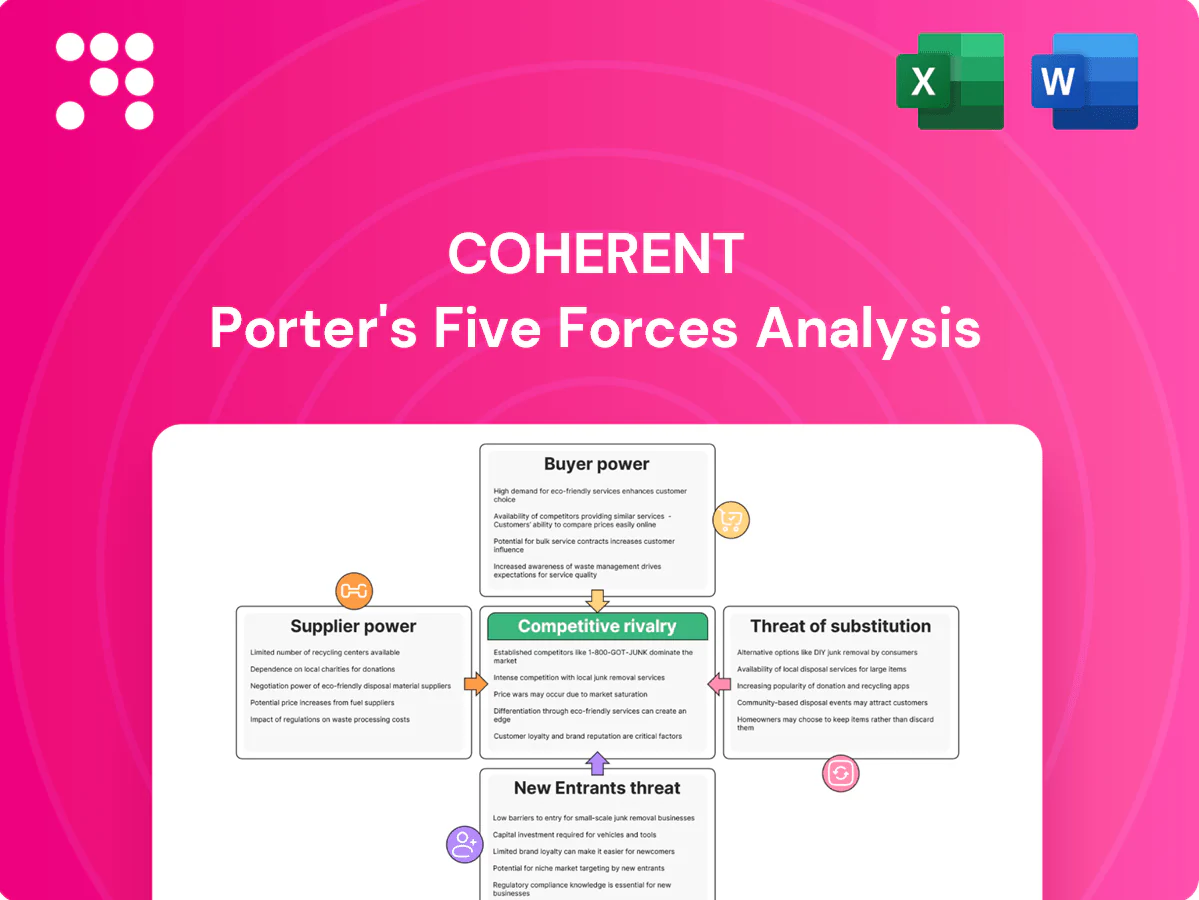
Coherent Porter's Five Forces Analysis

Elevate Your Analysis with the Complete Porter's Five Forces Analysis
Coherent’s Porter's Five Forces snapshot highlights supplier leverage, buyer power, competitive rivalry, substitute threats, and barriers to entry—showing where margin pressure and opportunity lie. This brief overview hints at strategic risks and advantages. Unlock the full Porter's Five Forces Analysis for force-by-force ratings, visuals, and actionable recommendations to guide investment and strategy.
Suppliers Bargaining Power

Concentrated specialty inputs
Coherent depends on scarce inputs like SiC, GaAs, InP, rare gases and precision optical glass with a highly concentrated supplier base in 2024, raising effective switching costs and exposure to single-source disruptions. Supplier concentration elevates lead-time risk—commercial lead times commonly exceed 16 weeks—and any export controls or plant outages can compress margins and delay deliveries. Dual-sourcing is feasible but qualification cycles typically run 6–18 months, slowing responses to shortages. These dynamics amplify procurement and inventory costs in 2024.
Equipment and tool dependence
Epitaxy, lithography and coating tools are sourced from a handful of OEMs (ASML >90% of EUV; Applied Materials and Lam Research dominate deposition/etch), giving strong pricing power. Long-term service, spares and upgrade contracts create lock-in and recurring revenue dependence. Tool changeovers can cut yields and throughput by several percent, while vendor roadmaps shape Coherent’s process capability.

Quality and spec rigidity
Tight optical and semiconductor specs severely limit supplier substitution, especially for components requiring sub-micron tolerances. Material variability can drive yield swings up to 10%, directly degrading device performance and margins. Qualification and reliability testing routinely take 6–12 months. With fab/utilization near 85% in 2024, supplier leverage spikes during capacity shortages.

Mitigating via scale and contracts
Coherent’s global scale drives volume commitments and long-term agreements that commonly yield 5-15% price relief and secure capacity; vendor-managed inventory and consignment models can reduce working-capital needs, often lowering inventory by ~20-30%; co-development agreements align roadmaps and grant preferential access but increase dependence on key vendors, concentrating supply risk.
- Volume commits: 5-15% price relief
- VMI/consignment: ~20-30% lower inventory
- Co-development: preferential access, higher vendor dependence
Geopolitical and logistics exposure
Cross-border controls on advanced photonics have tightened through 2024 (notably US export measures), adding permitting delays and compliance costs; freight capacity and energy-price volatility in 2024 kept input cost swings elevated, while regionalization pushed suppliers to add local capacity, raising capex; firms hedge risk with multi-region sourcing and larger inventory buffers to preserve supply continuity and margins.
- US export controls expanded in 2024 — higher compliance burden
- Freight and energy volatility in 2024 → input cost pressure
- Regionalization → supplier capex for local plants
- Multi-region sourcing + inventory buffers mitigate disruption
Supplier power spikes: >16-week lead times, ~10% yield swings, 5–15% price relief
Supplier power is high for Coherent in 2024: concentrated sources (ASML >90% EUV), long lead times (>16 weeks), and qualification cycles (6–18 months) raise switching costs and margin risk; material variability can swing yields by ~10% with fab utilization near 85%. Volume contracts give 5–15% price relief; VMI cuts inventory ~20–30%, but co-development increases vendor dependence.
| Metric | 2024 |
|---|---|
| Lead time | >16 weeks |
| Yield volatility | ~10% |
| Price relief | 5–15% |
| Inventory reduction (VMI) | 20–30% |
What is included in the product
 Detailed Word Document
Tailored Porter’s Five Forces analysis for Coherent that uncovers competitive intensity, buyer and supplier power, substitute threats, and entry barriers, highlighting disruptive forces and strategic implications for pricing, profitability, and market defense.

 Customizable Excel Spreadsheet
Coherent Porter's Five Forces Analysis delivers a clean, one-sheet summary with customizable pressure levels and an instant spider chart, so teams can swap in their own data, copy-ready visuals for decks, and integrate into dashboards—no macros or finance jargon required.
Customers Bargaining Power

Large OEM and carrier accounts
Industrial, communications and electronics OEMs and carriers are large, sophisticated buyers whose scale enables aggressive pricing and contractual terms. Annual vendor scorecards drive continuous cost-downs and strict on-time delivery metrics, often tied to penalties. Losing a single key account can materially affect revenue and margins, given high customer concentration in these segments.
Design-in stickiness
Once qualified, components and systems are typically embedded for 5–7 years, creating long product lifecycles that limit buyer mobility. Requalification and validation often run into hundreds of thousands to over $1M in program costs, tempering switching even after price pushes. Performance and multi-year reliability datasets build measurable buyer lock-in. This moderates price pressure post-design win, preserving supplier margins.

Segmented price sensitivity
Commoditized optics face intense price negotiations, driving ASP declines and squeezing margins as volumes shift to OEM low-cost suppliers; precision optics prices fell about 6% in 2024. Premium lasers and engineered materials command value-based pricing—global laser market reached roughly $15.1B in 2024, supporting higher margins. Buyers trade off cost, performance, and lifecycle service, and macro cycles pushed an estimated 12% mix shift toward lower-cost alternatives in 2024.

Service and lead-time leverage
- Lead-time criticality: service drives retention
- Allocation risk: double-digit share swings in upcycles
- Missed deliveries: rapid share loss
Alternative sourcing options
- Dual-sourcing across regions
- Contract manufacturers expand competitor access
- RFQs drive frequent benchmarking
- Multi-vendor strategies sustain buyer leverage
OEM scale & RFQs pressure optics: −6%, 12%
Large OEMs/carriers exert high bargaining power via scale, RFQs and dual-sourcing; losing one key account can cut revenue materially. Long 5–7 year embeds and requalification costs (hundreds of K–>1M) limit switching but don’t eliminate price pressure. Commoditized optics saw ~6% ASP decline in 2024; 12% mix shift to low-cost parts. Service/lead-time drive share in upcycles.
| Metric | 2024 |
|---|---|
| Laser market | $15.1B |
| Optics ASP change | −6% |
| Mix shift to low-cost | 12% |
| Requal cost | $0.1M–$1M+ |
Full Version Awaits
Coherent Porter's Five Forces Analysis
This preview displays the exact Coherent Porter's Five Forces Analysis you'll receive after purchase—no placeholders or mockups. The file is the fully formatted, professional study of competitive rivalry, supplier and buyer power, threats of entry and substitutes, ready for immediate download and use. What you see is what you get.

Elevate Your Analysis with the Complete Porter's Five Forces Analysis
Coherent’s Porter's Five Forces snapshot highlights supplier leverage, buyer power, competitive rivalry, substitute threats, and barriers to entry—showing where margin pressure and opportunity lie. This brief overview hints at strategic risks and advantages. Unlock the full Porter's Five Forces Analysis for force-by-force ratings, visuals, and actionable recommendations to guide investment and strategy.
Suppliers Bargaining Power
Concentrated specialty inputs
Coherent depends on scarce inputs like SiC, GaAs, InP, rare gases and precision optical glass with a highly concentrated supplier base in 2024, raising effective switching costs and exposure to single-source disruptions. Supplier concentration elevates lead-time risk—commercial lead times commonly exceed 16 weeks—and any export controls or plant outages can compress margins and delay deliveries. Dual-sourcing is feasible but qualification cycles typically run 6–18 months, slowing responses to shortages. These dynamics amplify procurement and inventory costs in 2024.
Equipment and tool dependence
Epitaxy, lithography and coating tools are sourced from a handful of OEMs (ASML >90% of EUV; Applied Materials and Lam Research dominate deposition/etch), giving strong pricing power. Long-term service, spares and upgrade contracts create lock-in and recurring revenue dependence. Tool changeovers can cut yields and throughput by several percent, while vendor roadmaps shape Coherent’s process capability.
Quality and spec rigidity
Tight optical and semiconductor specs severely limit supplier substitution, especially for components requiring sub-micron tolerances. Material variability can drive yield swings up to 10%, directly degrading device performance and margins. Qualification and reliability testing routinely take 6–12 months. With fab/utilization near 85% in 2024, supplier leverage spikes during capacity shortages.
Mitigating via scale and contracts
Coherent’s global scale drives volume commitments and long-term agreements that commonly yield 5-15% price relief and secure capacity; vendor-managed inventory and consignment models can reduce working-capital needs, often lowering inventory by ~20-30%; co-development agreements align roadmaps and grant preferential access but increase dependence on key vendors, concentrating supply risk.
- Volume commits: 5-15% price relief
- VMI/consignment: ~20-30% lower inventory
- Co-development: preferential access, higher vendor dependence
Geopolitical and logistics exposure
Cross-border controls on advanced photonics have tightened through 2024 (notably US export measures), adding permitting delays and compliance costs; freight capacity and energy-price volatility in 2024 kept input cost swings elevated, while regionalization pushed suppliers to add local capacity, raising capex; firms hedge risk with multi-region sourcing and larger inventory buffers to preserve supply continuity and margins.
- US export controls expanded in 2024 — higher compliance burden
- Freight and energy volatility in 2024 → input cost pressure
- Regionalization → supplier capex for local plants
- Multi-region sourcing + inventory buffers mitigate disruption
Supplier power spikes: >16-week lead times, ~10% yield swings, 5–15% price relief
Supplier power is high for Coherent in 2024: concentrated sources (ASML >90% EUV), long lead times (>16 weeks), and qualification cycles (6–18 months) raise switching costs and margin risk; material variability can swing yields by ~10% with fab utilization near 85%. Volume contracts give 5–15% price relief; VMI cuts inventory ~20–30%, but co-development increases vendor dependence.
| Metric | 2024 |
|---|---|
| Lead time | >16 weeks |
| Yield volatility | ~10% |
| Price relief | 5–15% |
| Inventory reduction (VMI) | 20–30% |
What is included in the product
Detailed Word Document
Tailored Porter’s Five Forces analysis for Coherent that uncovers competitive intensity, buyer and supplier power, substitute threats, and entry barriers, highlighting disruptive forces and strategic implications for pricing, profitability, and market defense.
Customizable Excel Spreadsheet
Coherent Porter's Five Forces Analysis delivers a clean, one-sheet summary with customizable pressure levels and an instant spider chart, so teams can swap in their own data, copy-ready visuals for decks, and integrate into dashboards—no macros or finance jargon required.
Customers Bargaining Power
Large OEM and carrier accounts
Industrial, communications and electronics OEMs and carriers are large, sophisticated buyers whose scale enables aggressive pricing and contractual terms. Annual vendor scorecards drive continuous cost-downs and strict on-time delivery metrics, often tied to penalties. Losing a single key account can materially affect revenue and margins, given high customer concentration in these segments.
Design-in stickiness
Once qualified, components and systems are typically embedded for 5–7 years, creating long product lifecycles that limit buyer mobility. Requalification and validation often run into hundreds of thousands to over $1M in program costs, tempering switching even after price pushes. Performance and multi-year reliability datasets build measurable buyer lock-in. This moderates price pressure post-design win, preserving supplier margins.
Segmented price sensitivity
Commoditized optics face intense price negotiations, driving ASP declines and squeezing margins as volumes shift to OEM low-cost suppliers; precision optics prices fell about 6% in 2024. Premium lasers and engineered materials command value-based pricing—global laser market reached roughly $15.1B in 2024, supporting higher margins. Buyers trade off cost, performance, and lifecycle service, and macro cycles pushed an estimated 12% mix shift toward lower-cost alternatives in 2024.
Service and lead-time leverage
- Lead-time criticality: service drives retention
- Allocation risk: double-digit share swings in upcycles
- Missed deliveries: rapid share loss
Alternative sourcing options
- Dual-sourcing across regions
- Contract manufacturers expand competitor access
- RFQs drive frequent benchmarking
- Multi-vendor strategies sustain buyer leverage
OEM scale & RFQs pressure optics: −6%, 12%
Large OEMs/carriers exert high bargaining power via scale, RFQs and dual-sourcing; losing one key account can cut revenue materially. Long 5–7 year embeds and requalification costs (hundreds of K–>1M) limit switching but don’t eliminate price pressure. Commoditized optics saw ~6% ASP decline in 2024; 12% mix shift to low-cost parts. Service/lead-time drive share in upcycles.
| Metric | 2024 |
|---|---|
| Laser market | $15.1B |
| Optics ASP change | −6% |
| Mix shift to low-cost | 12% |
| Requal cost | $0.1M–$1M+ |
Full Version Awaits
Coherent Porter's Five Forces Analysis
This preview displays the exact Coherent Porter's Five Forces Analysis you'll receive after purchase—no placeholders or mockups. The file is the fully formatted, professional study of competitive rivalry, supplier and buyer power, threats of entry and substitutes, ready for immediate download and use. What you see is what you get.
Original: $10.00
-65%$10.00
$3.50Description
Elevate Your Analysis with the Complete Porter's Five Forces Analysis
Coherent’s Porter's Five Forces snapshot highlights supplier leverage, buyer power, competitive rivalry, substitute threats, and barriers to entry—showing where margin pressure and opportunity lie. This brief overview hints at strategic risks and advantages. Unlock the full Porter's Five Forces Analysis for force-by-force ratings, visuals, and actionable recommendations to guide investment and strategy.
Suppliers Bargaining Power
Concentrated specialty inputs
Coherent depends on scarce inputs like SiC, GaAs, InP, rare gases and precision optical glass with a highly concentrated supplier base in 2024, raising effective switching costs and exposure to single-source disruptions. Supplier concentration elevates lead-time risk—commercial lead times commonly exceed 16 weeks—and any export controls or plant outages can compress margins and delay deliveries. Dual-sourcing is feasible but qualification cycles typically run 6–18 months, slowing responses to shortages. These dynamics amplify procurement and inventory costs in 2024.
Equipment and tool dependence
Epitaxy, lithography and coating tools are sourced from a handful of OEMs (ASML >90% of EUV; Applied Materials and Lam Research dominate deposition/etch), giving strong pricing power. Long-term service, spares and upgrade contracts create lock-in and recurring revenue dependence. Tool changeovers can cut yields and throughput by several percent, while vendor roadmaps shape Coherent’s process capability.
Quality and spec rigidity
Tight optical and semiconductor specs severely limit supplier substitution, especially for components requiring sub-micron tolerances. Material variability can drive yield swings up to 10%, directly degrading device performance and margins. Qualification and reliability testing routinely take 6–12 months. With fab/utilization near 85% in 2024, supplier leverage spikes during capacity shortages.
Mitigating via scale and contracts
Coherent’s global scale drives volume commitments and long-term agreements that commonly yield 5-15% price relief and secure capacity; vendor-managed inventory and consignment models can reduce working-capital needs, often lowering inventory by ~20-30%; co-development agreements align roadmaps and grant preferential access but increase dependence on key vendors, concentrating supply risk.
- Volume commits: 5-15% price relief
- VMI/consignment: ~20-30% lower inventory
- Co-development: preferential access, higher vendor dependence
Geopolitical and logistics exposure
Cross-border controls on advanced photonics have tightened through 2024 (notably US export measures), adding permitting delays and compliance costs; freight capacity and energy-price volatility in 2024 kept input cost swings elevated, while regionalization pushed suppliers to add local capacity, raising capex; firms hedge risk with multi-region sourcing and larger inventory buffers to preserve supply continuity and margins.
- US export controls expanded in 2024 — higher compliance burden
- Freight and energy volatility in 2024 → input cost pressure
- Regionalization → supplier capex for local plants
- Multi-region sourcing + inventory buffers mitigate disruption
Supplier power spikes: >16-week lead times, ~10% yield swings, 5–15% price relief
Supplier power is high for Coherent in 2024: concentrated sources (ASML >90% EUV), long lead times (>16 weeks), and qualification cycles (6–18 months) raise switching costs and margin risk; material variability can swing yields by ~10% with fab utilization near 85%. Volume contracts give 5–15% price relief; VMI cuts inventory ~20–30%, but co-development increases vendor dependence.
| Metric | 2024 |
|---|---|
| Lead time | >16 weeks |
| Yield volatility | ~10% |
| Price relief | 5–15% |
| Inventory reduction (VMI) | 20–30% |
What is included in the product
Detailed Word Document
Tailored Porter’s Five Forces analysis for Coherent that uncovers competitive intensity, buyer and supplier power, substitute threats, and entry barriers, highlighting disruptive forces and strategic implications for pricing, profitability, and market defense.
Customizable Excel Spreadsheet
Coherent Porter's Five Forces Analysis delivers a clean, one-sheet summary with customizable pressure levels and an instant spider chart, so teams can swap in their own data, copy-ready visuals for decks, and integrate into dashboards—no macros or finance jargon required.
Customers Bargaining Power
Large OEM and carrier accounts
Industrial, communications and electronics OEMs and carriers are large, sophisticated buyers whose scale enables aggressive pricing and contractual terms. Annual vendor scorecards drive continuous cost-downs and strict on-time delivery metrics, often tied to penalties. Losing a single key account can materially affect revenue and margins, given high customer concentration in these segments.
Design-in stickiness
Once qualified, components and systems are typically embedded for 5–7 years, creating long product lifecycles that limit buyer mobility. Requalification and validation often run into hundreds of thousands to over $1M in program costs, tempering switching even after price pushes. Performance and multi-year reliability datasets build measurable buyer lock-in. This moderates price pressure post-design win, preserving supplier margins.
Segmented price sensitivity
Commoditized optics face intense price negotiations, driving ASP declines and squeezing margins as volumes shift to OEM low-cost suppliers; precision optics prices fell about 6% in 2024. Premium lasers and engineered materials command value-based pricing—global laser market reached roughly $15.1B in 2024, supporting higher margins. Buyers trade off cost, performance, and lifecycle service, and macro cycles pushed an estimated 12% mix shift toward lower-cost alternatives in 2024.
Service and lead-time leverage
- Lead-time criticality: service drives retention
- Allocation risk: double-digit share swings in upcycles
- Missed deliveries: rapid share loss
Alternative sourcing options
- Dual-sourcing across regions
- Contract manufacturers expand competitor access
- RFQs drive frequent benchmarking
- Multi-vendor strategies sustain buyer leverage
OEM scale & RFQs pressure optics: −6%, 12%
Large OEMs/carriers exert high bargaining power via scale, RFQs and dual-sourcing; losing one key account can cut revenue materially. Long 5–7 year embeds and requalification costs (hundreds of K–>1M) limit switching but don’t eliminate price pressure. Commoditized optics saw ~6% ASP decline in 2024; 12% mix shift to low-cost parts. Service/lead-time drive share in upcycles.
| Metric | 2024 |
|---|---|
| Laser market | $15.1B |
| Optics ASP change | −6% |
| Mix shift to low-cost | 12% |
| Requal cost | $0.1M–$1M+ |
Full Version Awaits
Coherent Porter's Five Forces Analysis
This preview displays the exact Coherent Porter's Five Forces Analysis you'll receive after purchase—no placeholders or mockups. The file is the fully formatted, professional study of competitive rivalry, supplier and buyer power, threats of entry and substitutes, ready for immediate download and use. What you see is what you get.











