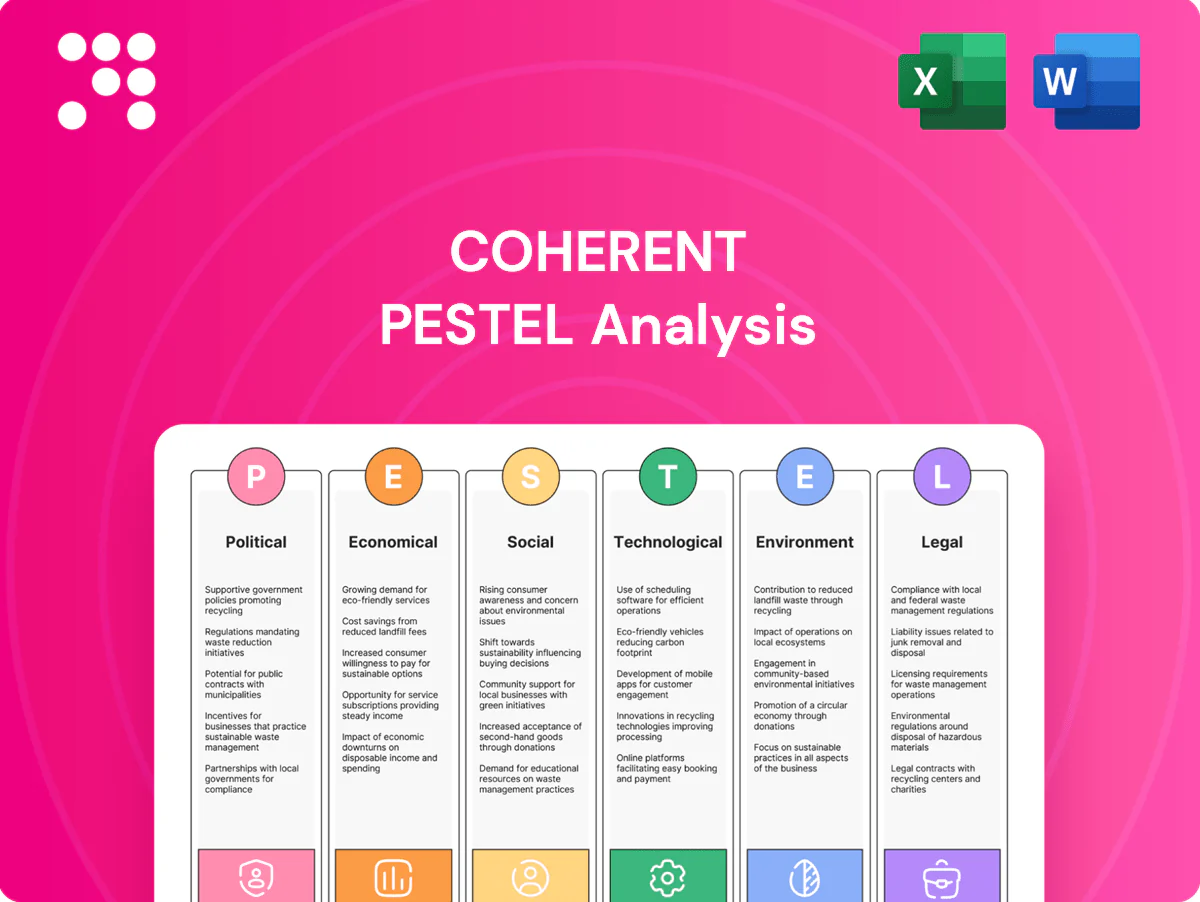
Coherent PESTLE Analysis

Your Competitive Advantage Starts with This Report
Gain a strategic advantage with our Coherent PESTLE Analysis—three to five targeted insights show how political, economic, social, technological, legal, and environmental forces shape Coherent’s future. Use this research to inform investments and strategy. Buy the full report for a complete, editable breakdown ready for immediate use.
Political factors

Export controls & geopolitics
US export controls introduced in October 2022 and parallel EU measures in 2023 on advanced photonics, lasers and compound semiconductors constrain product eligibility and market access. Tighter rules targeting China and Russia require licenses for high‑end systems, often adding weeks to months of lead time. Coherent needs rigorous classification, screening and end‑use diligence to avoid disruptions and rising compliance costs.
Industrial policy & subsidies
CHIPS-era industrial policy—US CHIPS Act $52B, EU Chips Act ~€43B and South Korea's $450B semiconductor push—is driving fab siting, capex and partner ecosystems. Grants and tax credits can cut new-materials and epitaxy capacity costs by double-digit percentages. Local-content and guardrail clauses limit strategic flexibility. Competitive subsidies abroad re-route customer investment flows.

Trade tariffs & localization
Tariffs of up to 25% from Section 301 and similar measures on optics, lasers and electronic components directly lift BOM costs and force price adjustments. The US CHIPS Act includes roughly $52 billion for domestic incentives, accelerating government pushes for localization of critical tech and nudging Coherent to regionalize manufacturing. Rules-of-origin and customs frictions fragment supply chains and increase compliance complexity. Strategic dual-sourcing and nearshoring reduce exposure to tariff volatility and supply shocks.

Government demand & defense
Defense, aerospace and research agencies drive photonics R&D and system procurements; global military expenditure was about 2.24 trillion USD in 2023 (SIPRI), underpinning steady demand for precision optics and directed-energy subsystems. Budget cycles and shifting priorities create multi-year swings; major programs commonly have 3–10 year procurement timelines, while security clearances and ITAR increase overhead but grant access to high-margin contracts.
- Defense funding: sustained global military spend (2.24T USD, 2023)
- Procurement: programs often 3–10 years
- Compliance: ITAR/clearance raises costs but enables premium programs
Standards diplomacy & alliances
International standards bodies and multilateral alliances drive telecom optics and laser safety norms; alignment with ITU/IEC frameworks eases interoperability and market entry—ITU counts 193 member states. Regional divergence (regulatory, safety) increases certification burden and forces variant SKUs. Active participation in standards bodies shapes favorable specifications and accelerates adoption.
- Standards: ITU alignment = smoother global entry
- Certification: regional divergence → higher compliance costs
- Product: variant SKUs raise inventory and R&D
- Strategy: active participation influences specs
Export controls, CHIPS incentives and tariffs fragment chip supply; defense demand supports margins
Export controls (US Oct 2022, EU 2023) and licensing for China/Russia raise lead times and compliance costs. CHIPS-era incentives (US $52B, EU ~€43B, S.Korea $450B) drive localization but add local‑content constraints. Tariffs up to 25% lift BOM and fragment supply chains. Defense demand (global military spend ~2.24T USD, 2023) supports high‑margin procurement with 3–10 year cycles.
| Factor | Key data | Impact |
|---|---|---|
| Export controls | US Oct 2022; EU 2023 | Longer lead times, screening |
| Industrial policy | US $52B; EU €43B; KR $450B | Localization, subsidies |
| Tariffs | Up to 25% | Higher BOM, dual‑sourcing |
| Defense | 2.24T USD (2023) | Stable high‑margin demand |
What is included in the product
 Detailed Word Document
Explores how external macro-environmental factors uniquely affect the Coherent across six dimensions—Political, Economic, Social, Technological, Environmental, and Legal—backed by data and forward-looking insights to identify risks, opportunities, and scenario-driven strategies for executives, investors, and consultants.

 Customizable Excel Spreadsheet
Visually segmented by PESTLE categories for rapid interpretation, the Coherent PESTLE Analysis delivers a clean, shareable summary that teams can drop into presentations, annotate for local context, and use to align strategy discussions on external risks and market positioning.
Economic factors

Capex cycles in end-markets
Capex cycles in telecom/datacom optics, industrial automation and electronics are highly cyclical and rate-sensitive; slowdowns in carrier or hyperscaler capex directly compress transceiver and laser orders. S&P Global manufacturing PMI readings near 50 in 2024–25 signalled weak order flow, guiding materials and precision optics demand. Diversification across segments lowers volatility but does not eliminate correlation risk across capex cycles.
Interest rates & FX
Higher policy rates (US fed funds 5.25–5.50% in July 2025) lift discount rates and WACC—after ~525 bps tightening since 2021—dampening customer capex and compressing valuation multiples. A strong dollar (DXY ~106) reduces reported EMEA/APAC revenue and can squeeze margins when inputs are non‑USD; hedging mitigates but cannot remove translation losses. Pricing discipline and regional cost bases are primary levers to protect margins.

Supply chain costs & availability
Rare elements, specialty gases and substrates such as sapphire, SiC, GaAs and InP face marked price swings and allocation risk, with substrate lead times commonly 20–40 weeks and episodic spot-price spikes. Logistics bottlenecks and energy costs—which can represent up to ~25–30% of furnace/epitaxy operating expense—compress margins. Long lead times force inventory buffers that tie up working capital. Supplier consolidation (top-tier suppliers often >50% share in niche substrates) reduces buyer bargaining power.

Scale economies & yield learning
Cost structure hinges on yields in crystal growth, wafering and thin‑film coatings; industry learning rates of ~10–20% cost reduction per cumulative doubling mean AI/optics and EV/SiC volume ramps (SiC market CAGR ~28% 2024–30; silicon photonics ~22%) can unlock material margin gains, while mix complexity raises throughput loss and scrap; continuous process improvement preserves gross margin.
- Learning rate: ~10–20% cost decline per doubling
- SiC CAGR: ~28% (2024–2030)
- Silicon photonics CAGR: ~22% (2024–2030)
- Yield move 85%→95% cuts scrap from 15% to 5%
M&A and portfolio optimization
Photonics consolidation is accelerating, creating scope for bolt‑ons and divestitures while integration execution drives realization of synergies, cross‑selling and R&D efficiency.
Antitrust scrutiny, especially around strategic materials and supply chains, can slow transactions and increase deal costs; portfolio focus requires balancing high‑growth segments against capital‑intensive manufacturing investments.
- Consolidation: bolt‑ons/divestitures
- Integration: synergies, cross‑sell, R&D efficiency
- Regulation: antitrust delays in strategic materials
- Portfolio: growth vs capital intensity
Export controls, CHIPS incentives and tariffs fragment chip supply; defense demand supports margins
Capex sensitivity: carrier/hyperscaler slowdowns directly cut optics orders; S&P PMIs ~50 in 2024–25 signalled weak demand. Rates/dollar: Fed funds 5.25–5.50% (Jul 2025) and DXY ~106 raise WACC and compress multiples. Supply/input risk: substrates lead times 20–40w, energy 25–30% of epilaxy costs. Growth offsets: SiC CAGR ~28% (24–30), silicon photonics ~22% (24–30).
| Metric | Value |
|---|---|
| Fed funds (Jul 2025) | 5.25–5.50% |
| DXY | ~106 |
| SiC CAGR (24–30) | ~28% |
| Si photonics CAGR (24–30) | ~22% |
| Substrate lead time | 20–40 weeks |
| Energy cost share | 25–30% |
| PMI | ~50 |
Preview Before You Purchase
Coherent PESTLE Analysis
The preview shown here is the exact Coherent PESTLE Analysis you’ll receive after purchase—fully formatted, professionally structured, and ready to use. This is the real, final document with no placeholders or teasers. After payment you’ll instantly download the same file displayed here.

Your Competitive Advantage Starts with This Report
Gain a strategic advantage with our Coherent PESTLE Analysis—three to five targeted insights show how political, economic, social, technological, legal, and environmental forces shape Coherent’s future. Use this research to inform investments and strategy. Buy the full report for a complete, editable breakdown ready for immediate use.
Political factors
Export controls & geopolitics
US export controls introduced in October 2022 and parallel EU measures in 2023 on advanced photonics, lasers and compound semiconductors constrain product eligibility and market access. Tighter rules targeting China and Russia require licenses for high‑end systems, often adding weeks to months of lead time. Coherent needs rigorous classification, screening and end‑use diligence to avoid disruptions and rising compliance costs.
Industrial policy & subsidies
CHIPS-era industrial policy—US CHIPS Act $52B, EU Chips Act ~€43B and South Korea's $450B semiconductor push—is driving fab siting, capex and partner ecosystems. Grants and tax credits can cut new-materials and epitaxy capacity costs by double-digit percentages. Local-content and guardrail clauses limit strategic flexibility. Competitive subsidies abroad re-route customer investment flows.
Trade tariffs & localization
Tariffs of up to 25% from Section 301 and similar measures on optics, lasers and electronic components directly lift BOM costs and force price adjustments. The US CHIPS Act includes roughly $52 billion for domestic incentives, accelerating government pushes for localization of critical tech and nudging Coherent to regionalize manufacturing. Rules-of-origin and customs frictions fragment supply chains and increase compliance complexity. Strategic dual-sourcing and nearshoring reduce exposure to tariff volatility and supply shocks.
Government demand & defense
Defense, aerospace and research agencies drive photonics R&D and system procurements; global military expenditure was about 2.24 trillion USD in 2023 (SIPRI), underpinning steady demand for precision optics and directed-energy subsystems. Budget cycles and shifting priorities create multi-year swings; major programs commonly have 3–10 year procurement timelines, while security clearances and ITAR increase overhead but grant access to high-margin contracts.
- Defense funding: sustained global military spend (2.24T USD, 2023)
- Procurement: programs often 3–10 years
- Compliance: ITAR/clearance raises costs but enables premium programs
Standards diplomacy & alliances
International standards bodies and multilateral alliances drive telecom optics and laser safety norms; alignment with ITU/IEC frameworks eases interoperability and market entry—ITU counts 193 member states. Regional divergence (regulatory, safety) increases certification burden and forces variant SKUs. Active participation in standards bodies shapes favorable specifications and accelerates adoption.
- Standards: ITU alignment = smoother global entry
- Certification: regional divergence → higher compliance costs
- Product: variant SKUs raise inventory and R&D
- Strategy: active participation influences specs
Export controls, CHIPS incentives and tariffs fragment chip supply; defense demand supports margins
Export controls (US Oct 2022, EU 2023) and licensing for China/Russia raise lead times and compliance costs. CHIPS-era incentives (US $52B, EU ~€43B, S.Korea $450B) drive localization but add local‑content constraints. Tariffs up to 25% lift BOM and fragment supply chains. Defense demand (global military spend ~2.24T USD, 2023) supports high‑margin procurement with 3–10 year cycles.
| Factor | Key data | Impact |
|---|---|---|
| Export controls | US Oct 2022; EU 2023 | Longer lead times, screening |
| Industrial policy | US $52B; EU €43B; KR $450B | Localization, subsidies |
| Tariffs | Up to 25% | Higher BOM, dual‑sourcing |
| Defense | 2.24T USD (2023) | Stable high‑margin demand |
What is included in the product
Detailed Word Document
Explores how external macro-environmental factors uniquely affect the Coherent across six dimensions—Political, Economic, Social, Technological, Environmental, and Legal—backed by data and forward-looking insights to identify risks, opportunities, and scenario-driven strategies for executives, investors, and consultants.
Customizable Excel Spreadsheet
Visually segmented by PESTLE categories for rapid interpretation, the Coherent PESTLE Analysis delivers a clean, shareable summary that teams can drop into presentations, annotate for local context, and use to align strategy discussions on external risks and market positioning.
Economic factors
Capex cycles in end-markets
Capex cycles in telecom/datacom optics, industrial automation and electronics are highly cyclical and rate-sensitive; slowdowns in carrier or hyperscaler capex directly compress transceiver and laser orders. S&P Global manufacturing PMI readings near 50 in 2024–25 signalled weak order flow, guiding materials and precision optics demand. Diversification across segments lowers volatility but does not eliminate correlation risk across capex cycles.
Interest rates & FX
Higher policy rates (US fed funds 5.25–5.50% in July 2025) lift discount rates and WACC—after ~525 bps tightening since 2021—dampening customer capex and compressing valuation multiples. A strong dollar (DXY ~106) reduces reported EMEA/APAC revenue and can squeeze margins when inputs are non‑USD; hedging mitigates but cannot remove translation losses. Pricing discipline and regional cost bases are primary levers to protect margins.
Supply chain costs & availability
Rare elements, specialty gases and substrates such as sapphire, SiC, GaAs and InP face marked price swings and allocation risk, with substrate lead times commonly 20–40 weeks and episodic spot-price spikes. Logistics bottlenecks and energy costs—which can represent up to ~25–30% of furnace/epitaxy operating expense—compress margins. Long lead times force inventory buffers that tie up working capital. Supplier consolidation (top-tier suppliers often >50% share in niche substrates) reduces buyer bargaining power.
Scale economies & yield learning
Cost structure hinges on yields in crystal growth, wafering and thin‑film coatings; industry learning rates of ~10–20% cost reduction per cumulative doubling mean AI/optics and EV/SiC volume ramps (SiC market CAGR ~28% 2024–30; silicon photonics ~22%) can unlock material margin gains, while mix complexity raises throughput loss and scrap; continuous process improvement preserves gross margin.
- Learning rate: ~10–20% cost decline per doubling
- SiC CAGR: ~28% (2024–2030)
- Silicon photonics CAGR: ~22% (2024–2030)
- Yield move 85%→95% cuts scrap from 15% to 5%
M&A and portfolio optimization
Photonics consolidation is accelerating, creating scope for bolt‑ons and divestitures while integration execution drives realization of synergies, cross‑selling and R&D efficiency.
Antitrust scrutiny, especially around strategic materials and supply chains, can slow transactions and increase deal costs; portfolio focus requires balancing high‑growth segments against capital‑intensive manufacturing investments.
- Consolidation: bolt‑ons/divestitures
- Integration: synergies, cross‑sell, R&D efficiency
- Regulation: antitrust delays in strategic materials
- Portfolio: growth vs capital intensity
Export controls, CHIPS incentives and tariffs fragment chip supply; defense demand supports margins
Capex sensitivity: carrier/hyperscaler slowdowns directly cut optics orders; S&P PMIs ~50 in 2024–25 signalled weak demand. Rates/dollar: Fed funds 5.25–5.50% (Jul 2025) and DXY ~106 raise WACC and compress multiples. Supply/input risk: substrates lead times 20–40w, energy 25–30% of epilaxy costs. Growth offsets: SiC CAGR ~28% (24–30), silicon photonics ~22% (24–30).
| Metric | Value |
|---|---|
| Fed funds (Jul 2025) | 5.25–5.50% |
| DXY | ~106 |
| SiC CAGR (24–30) | ~28% |
| Si photonics CAGR (24–30) | ~22% |
| Substrate lead time | 20–40 weeks |
| Energy cost share | 25–30% |
| PMI | ~50 |
Preview Before You Purchase
Coherent PESTLE Analysis
The preview shown here is the exact Coherent PESTLE Analysis you’ll receive after purchase—fully formatted, professionally structured, and ready to use. This is the real, final document with no placeholders or teasers. After payment you’ll instantly download the same file displayed here.
Original: $10.00
-65%$10.00
$3.50Description
Your Competitive Advantage Starts with This Report
Gain a strategic advantage with our Coherent PESTLE Analysis—three to five targeted insights show how political, economic, social, technological, legal, and environmental forces shape Coherent’s future. Use this research to inform investments and strategy. Buy the full report for a complete, editable breakdown ready for immediate use.
Political factors
Export controls & geopolitics
US export controls introduced in October 2022 and parallel EU measures in 2023 on advanced photonics, lasers and compound semiconductors constrain product eligibility and market access. Tighter rules targeting China and Russia require licenses for high‑end systems, often adding weeks to months of lead time. Coherent needs rigorous classification, screening and end‑use diligence to avoid disruptions and rising compliance costs.
Industrial policy & subsidies
CHIPS-era industrial policy—US CHIPS Act $52B, EU Chips Act ~€43B and South Korea's $450B semiconductor push—is driving fab siting, capex and partner ecosystems. Grants and tax credits can cut new-materials and epitaxy capacity costs by double-digit percentages. Local-content and guardrail clauses limit strategic flexibility. Competitive subsidies abroad re-route customer investment flows.
Trade tariffs & localization
Tariffs of up to 25% from Section 301 and similar measures on optics, lasers and electronic components directly lift BOM costs and force price adjustments. The US CHIPS Act includes roughly $52 billion for domestic incentives, accelerating government pushes for localization of critical tech and nudging Coherent to regionalize manufacturing. Rules-of-origin and customs frictions fragment supply chains and increase compliance complexity. Strategic dual-sourcing and nearshoring reduce exposure to tariff volatility and supply shocks.
Government demand & defense
Defense, aerospace and research agencies drive photonics R&D and system procurements; global military expenditure was about 2.24 trillion USD in 2023 (SIPRI), underpinning steady demand for precision optics and directed-energy subsystems. Budget cycles and shifting priorities create multi-year swings; major programs commonly have 3–10 year procurement timelines, while security clearances and ITAR increase overhead but grant access to high-margin contracts.
- Defense funding: sustained global military spend (2.24T USD, 2023)
- Procurement: programs often 3–10 years
- Compliance: ITAR/clearance raises costs but enables premium programs
Standards diplomacy & alliances
International standards bodies and multilateral alliances drive telecom optics and laser safety norms; alignment with ITU/IEC frameworks eases interoperability and market entry—ITU counts 193 member states. Regional divergence (regulatory, safety) increases certification burden and forces variant SKUs. Active participation in standards bodies shapes favorable specifications and accelerates adoption.
- Standards: ITU alignment = smoother global entry
- Certification: regional divergence → higher compliance costs
- Product: variant SKUs raise inventory and R&D
- Strategy: active participation influences specs
Export controls, CHIPS incentives and tariffs fragment chip supply; defense demand supports margins
Export controls (US Oct 2022, EU 2023) and licensing for China/Russia raise lead times and compliance costs. CHIPS-era incentives (US $52B, EU ~€43B, S.Korea $450B) drive localization but add local‑content constraints. Tariffs up to 25% lift BOM and fragment supply chains. Defense demand (global military spend ~2.24T USD, 2023) supports high‑margin procurement with 3–10 year cycles.
| Factor | Key data | Impact |
|---|---|---|
| Export controls | US Oct 2022; EU 2023 | Longer lead times, screening |
| Industrial policy | US $52B; EU €43B; KR $450B | Localization, subsidies |
| Tariffs | Up to 25% | Higher BOM, dual‑sourcing |
| Defense | 2.24T USD (2023) | Stable high‑margin demand |
What is included in the product
Detailed Word Document
Explores how external macro-environmental factors uniquely affect the Coherent across six dimensions—Political, Economic, Social, Technological, Environmental, and Legal—backed by data and forward-looking insights to identify risks, opportunities, and scenario-driven strategies for executives, investors, and consultants.
Customizable Excel Spreadsheet
Visually segmented by PESTLE categories for rapid interpretation, the Coherent PESTLE Analysis delivers a clean, shareable summary that teams can drop into presentations, annotate for local context, and use to align strategy discussions on external risks and market positioning.
Economic factors
Capex cycles in end-markets
Capex cycles in telecom/datacom optics, industrial automation and electronics are highly cyclical and rate-sensitive; slowdowns in carrier or hyperscaler capex directly compress transceiver and laser orders. S&P Global manufacturing PMI readings near 50 in 2024–25 signalled weak order flow, guiding materials and precision optics demand. Diversification across segments lowers volatility but does not eliminate correlation risk across capex cycles.
Interest rates & FX
Higher policy rates (US fed funds 5.25–5.50% in July 2025) lift discount rates and WACC—after ~525 bps tightening since 2021—dampening customer capex and compressing valuation multiples. A strong dollar (DXY ~106) reduces reported EMEA/APAC revenue and can squeeze margins when inputs are non‑USD; hedging mitigates but cannot remove translation losses. Pricing discipline and regional cost bases are primary levers to protect margins.
Supply chain costs & availability
Rare elements, specialty gases and substrates such as sapphire, SiC, GaAs and InP face marked price swings and allocation risk, with substrate lead times commonly 20–40 weeks and episodic spot-price spikes. Logistics bottlenecks and energy costs—which can represent up to ~25–30% of furnace/epitaxy operating expense—compress margins. Long lead times force inventory buffers that tie up working capital. Supplier consolidation (top-tier suppliers often >50% share in niche substrates) reduces buyer bargaining power.
Scale economies & yield learning
Cost structure hinges on yields in crystal growth, wafering and thin‑film coatings; industry learning rates of ~10–20% cost reduction per cumulative doubling mean AI/optics and EV/SiC volume ramps (SiC market CAGR ~28% 2024–30; silicon photonics ~22%) can unlock material margin gains, while mix complexity raises throughput loss and scrap; continuous process improvement preserves gross margin.
- Learning rate: ~10–20% cost decline per doubling
- SiC CAGR: ~28% (2024–2030)
- Silicon photonics CAGR: ~22% (2024–2030)
- Yield move 85%→95% cuts scrap from 15% to 5%
M&A and portfolio optimization
Photonics consolidation is accelerating, creating scope for bolt‑ons and divestitures while integration execution drives realization of synergies, cross‑selling and R&D efficiency.
Antitrust scrutiny, especially around strategic materials and supply chains, can slow transactions and increase deal costs; portfolio focus requires balancing high‑growth segments against capital‑intensive manufacturing investments.
- Consolidation: bolt‑ons/divestitures
- Integration: synergies, cross‑sell, R&D efficiency
- Regulation: antitrust delays in strategic materials
- Portfolio: growth vs capital intensity
Export controls, CHIPS incentives and tariffs fragment chip supply; defense demand supports margins
Capex sensitivity: carrier/hyperscaler slowdowns directly cut optics orders; S&P PMIs ~50 in 2024–25 signalled weak demand. Rates/dollar: Fed funds 5.25–5.50% (Jul 2025) and DXY ~106 raise WACC and compress multiples. Supply/input risk: substrates lead times 20–40w, energy 25–30% of epilaxy costs. Growth offsets: SiC CAGR ~28% (24–30), silicon photonics ~22% (24–30).
| Metric | Value |
|---|---|
| Fed funds (Jul 2025) | 5.25–5.50% |
| DXY | ~106 |
| SiC CAGR (24–30) | ~28% |
| Si photonics CAGR (24–30) | ~22% |
| Substrate lead time | 20–40 weeks |
| Energy cost share | 25–30% |
| PMI | ~50 |
Preview Before You Purchase
Coherent PESTLE Analysis
The preview shown here is the exact Coherent PESTLE Analysis you’ll receive after purchase—fully formatted, professionally structured, and ready to use. This is the real, final document with no placeholders or teasers. After payment you’ll instantly download the same file displayed here.











