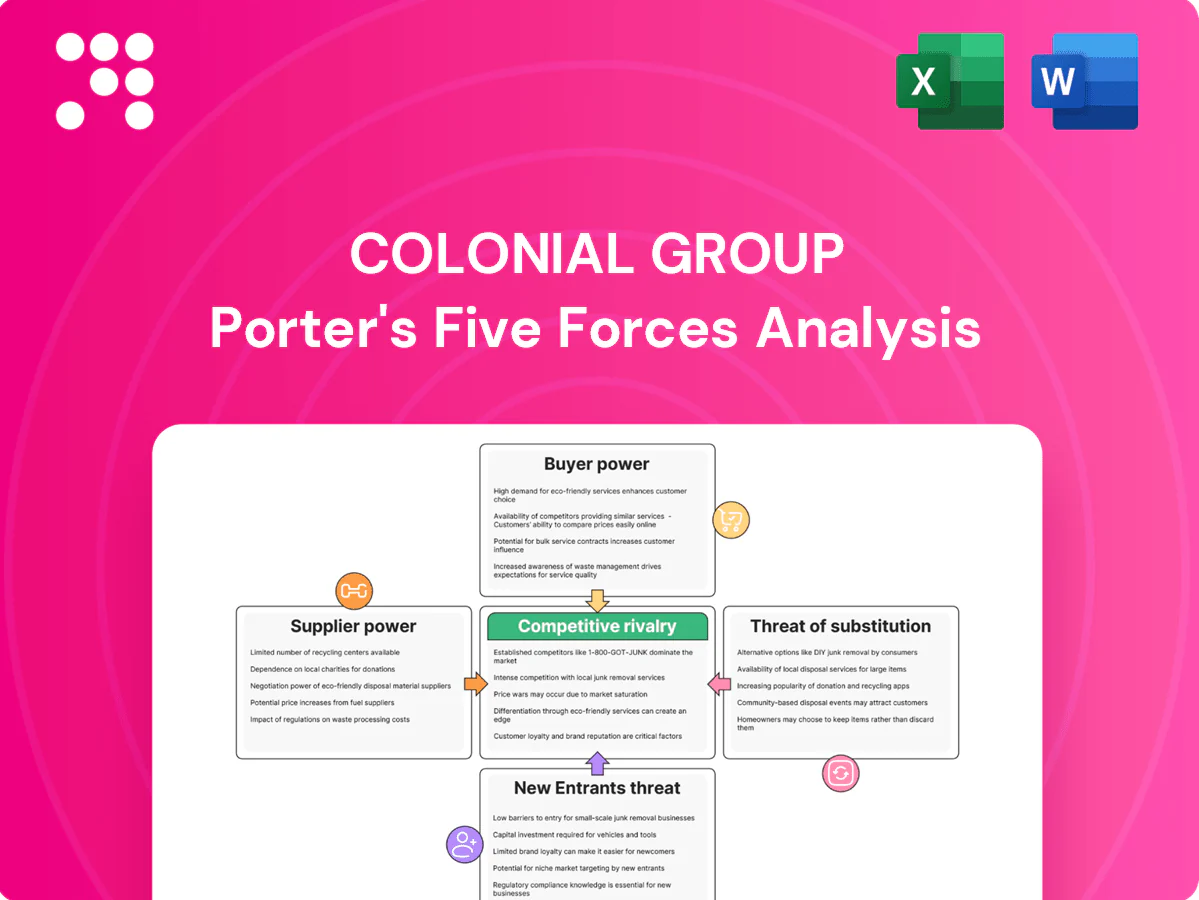
Colonial Group Porter's Five Forces Analysis

A Must-Have Tool for Decision-Makers
Colonial Group faces moderate supplier power, evolving buyer expectations, and a growing substitute threat that pressure margins and strategic choices. Competitive rivalry is intensified by entrenched rivals and selective new entrants, while regulatory shifts add external risk. This brief snapshot only scratches the surface. Unlock the full Porter's Five Forces Analysis to explore Colonial Group’s competitive dynamics, market pressures, and strategic advantages in detail.
Suppliers Bargaining Power

Refinery and upstream concentration
Colonial sources gasoline, diesel and specialty fuels from a narrow set of refiners and integrated oil majors; in the US the top five refiners account for roughly 50% of crude distillation capacity and US refinery capacity was about 19 million b/d in 2024 (EIA). Supplier consolidation and outages can spike transfer prices; long-term offtake deals and hedging blunt price swings but lock in volumes and reduce flexibility. Marine fuels and specialty products are supplied by niche plants, increasing supplier pricing power and margin volatility for Colonial.
Infrastructure and terminal dependence
Pipeline access, storage tanks and berths are concentrated among a few midstream owners—Colonial Pipeline alone delivers roughly 45% of refined product to the US East Coast—giving suppliers strong bargaining power. Take-or-pay contracts and regulated tariffs (FERC oversight for interstate pipelines) lock in fixed costs and limit pass-through flexibility. Alternative routing during constraints is costly and slow, often adding days and millions in logistics spend. Owning or long-leasing diversified terminals partially offsets landlord leverage by enabling operational rerouting and volume control.

Marine fleet and equipment OEMs
Barges, tugs and critical components come from specialized shipyards/OEMs with typical newbuild lead times of ~9–24 months in 2024, raising switching costs due to classification and retrofit requirements. Recurring maintenance parts and service contracts—often 20–30% of OEM revenues—sustain supplier pricing power. Lifecycle management, strategic spares and multi-sourcing can moderate dependence.

Regulatory and compliance inputs
Regulatory inputs like additives, emissions control tech and compliance credits (RINs, LCFS) create mandated purchase needs; California LCFS averaged about 100 USD/ton in 2024, driving supplier leverage and price volatility that suppliers can influence. Certification and testing providers wield gatekeeping power through approval timelines and fees, while vertical coordination and inventory planning mitigate spike exposure.
- Mandated inputs: additives, emissions tech, credits
- 2024 LCFS ≈100 USD/ton — source of cost pressure
- RINs/credit price volatility increases supplier power
- Certifiers/testing = gatekeepers
- Vertical coordination, inventory reduce spike risk
Global commodity dynamics
- Brent 2024 avg ~86 USD/bbl
- OPEC+ cuts ~2.7 mb/d
- DXY ~+5% in 2024
- Pass-through speed > contract repricing
Refiners pass costs as Brent ~86 USD/bbl, OPEC+ cuts 2.7 mb/d
Supplier power is high: concentrated refiners (US capacity ~19m b/d in 2024) and midstream (Colonial Pipeline ~45% East Coast) can pass costs quickly; Brent ~86 USD/bbl and OPEC+ cuts ~2.7 mb/d in 2024 amplify volatility. LCFS ~100 USD/ton and RINs add mandated cost pressure; hedging, storage and terminal ownership partially mitigate.
| Metric | 2024 |
|---|---|
| US refinery capacity | ~19m b/d |
| Colonial Pipeline share | ~45% East Coast |
| Brent avg | ~86 USD/bbl |
| LCFS CA | ~100 USD/ton |
What is included in the product
 Detailed Word Document
Concise Porter's Five Forces for Colonial Group: evaluates competitive rivalry, buyer and supplier power, threats from substitutes and new entrants, highlighting key drivers, disruptive threats, pricing influence, and strategic barriers protecting incumbency—editable for investor decks and internal strategy.

 Customizable Excel Spreadsheet
A concise Porter's Five Forces snapshot tailored to Colonial Group—streamlines competitive insights for faster strategic decisions. Swap in current metrics, visualize pressure on a radar chart, and drop the sheet straight into decks or reports for immediate boardroom-ready clarity.
Customers Bargaining Power

Wholesale and commercial buyers
Fleet operators, industrials and marine customers buy in large volumes and extract discounts through multi-bid tenders and contracted volumes, increasing price pressure on Colonial Group. Top 10 container lines controlled about 80% of global container capacity in 2024 (Alphaliner), concentrating buyer power. Where logistics and delivery windows are comparable switching among distributors is feasible; superior service reliability and value-added logistics reduce pure price focus.
Retail consumers at pumps
Gasoline buyers are highly price sensitive with near-instant price transparency via apps; AAA reported the 2024 U.S. national average retail gasoline price near $3.50/gal, fueling frequent switching. Convenience of station location and c-store offerings create modest differentiation and can raise basket spend by ~10–15%. Loyalty programs reduce churn but only within small price bands; brand strength helps, yet local price wars often dictate volumes.

C-store product mix leverage
Merchandise vendors clash for limited shelf space while customers freely substitute items; NACS reports U.S. c‑store sales reached $804.7 billion in 2023, underscoring intense supplier competition. Basket size fluctuates with promotions and private‑label mix; private brands can boost margins materially. Buyers respond rapidly to small price moves in snacks and beverages, but data‑driven assortment and pricing lift margins despite sensitivity.

Marine charterers and brokers
Marine charterers and brokers compare day rates and safety records across operators; higher safety and on-time performance allow Colonial Group to command premiums even when spot rates fluctuate. Contract structures (spot vs term) shift bargaining power with market cycles: spot markets amplify charterer leverage during oversupply, term contracts stabilize revenue. High utilization reduces buyer leverage; slack capacity increases it. Global seaborne trade was about 11 billion tonnes in 2022 (UNCTAD).
- Day-rate sensitivity
- Spot vs term impact
- Utilization pressure
- Safety-driven premium
Digital price transparency
Fuel apps and procurement platforms expose price differentials up to $0.20/gal in real time, enabling buyers to leverage data and demand parity or better terms; by 2024 over 50% of large fleets use such platforms, compressing distributor margins in commoditized lanes.
- Price spread: $0.20/gal
- Adoption: >50% fleets (2024)
- Impact: margin compression
- Defense: bundled services and SLAs
Buyers hold leverage; top carriers ~80%, fleets on platforms >50%
Buyers wield strong price leverage via scale and real-time transparency—top 10 container lines ~80% capacity (2024, Alphaliner); fuel apps show up to $0.20/gal spreads and >50% of large fleets use platforms (2024). Convenience, loyalty and safety can earn small premiums, but spot markets and utilization cycles quickly shift bargaining power.
| Metric | Value |
|---|---|
| Top10 container share (2024) | ~80% |
| US avg gas (2024) | $3.50/gal |
| C‑store sales (2023) | $804.7B |
| Fleets on platforms (2024) | >50% |
Preview Before You Purchase
Colonial Group Porter's Five Forces Analysis
This preview shows the exact Colonial Group Porter's Five Forces Analysis you'll receive immediately after purchase—no surprises, no placeholders. The report is professionally written, fully formatted and ready for download and use the moment you buy. You're viewing the final deliverable, available instantly after payment.

A Must-Have Tool for Decision-Makers
Colonial Group faces moderate supplier power, evolving buyer expectations, and a growing substitute threat that pressure margins and strategic choices. Competitive rivalry is intensified by entrenched rivals and selective new entrants, while regulatory shifts add external risk. This brief snapshot only scratches the surface. Unlock the full Porter's Five Forces Analysis to explore Colonial Group’s competitive dynamics, market pressures, and strategic advantages in detail.
Suppliers Bargaining Power
Refinery and upstream concentration
Colonial sources gasoline, diesel and specialty fuels from a narrow set of refiners and integrated oil majors; in the US the top five refiners account for roughly 50% of crude distillation capacity and US refinery capacity was about 19 million b/d in 2024 (EIA). Supplier consolidation and outages can spike transfer prices; long-term offtake deals and hedging blunt price swings but lock in volumes and reduce flexibility. Marine fuels and specialty products are supplied by niche plants, increasing supplier pricing power and margin volatility for Colonial.
Infrastructure and terminal dependence
Pipeline access, storage tanks and berths are concentrated among a few midstream owners—Colonial Pipeline alone delivers roughly 45% of refined product to the US East Coast—giving suppliers strong bargaining power. Take-or-pay contracts and regulated tariffs (FERC oversight for interstate pipelines) lock in fixed costs and limit pass-through flexibility. Alternative routing during constraints is costly and slow, often adding days and millions in logistics spend. Owning or long-leasing diversified terminals partially offsets landlord leverage by enabling operational rerouting and volume control.
Marine fleet and equipment OEMs
Barges, tugs and critical components come from specialized shipyards/OEMs with typical newbuild lead times of ~9–24 months in 2024, raising switching costs due to classification and retrofit requirements. Recurring maintenance parts and service contracts—often 20–30% of OEM revenues—sustain supplier pricing power. Lifecycle management, strategic spares and multi-sourcing can moderate dependence.
Regulatory and compliance inputs
Regulatory inputs like additives, emissions control tech and compliance credits (RINs, LCFS) create mandated purchase needs; California LCFS averaged about 100 USD/ton in 2024, driving supplier leverage and price volatility that suppliers can influence. Certification and testing providers wield gatekeeping power through approval timelines and fees, while vertical coordination and inventory planning mitigate spike exposure.
- Mandated inputs: additives, emissions tech, credits
- 2024 LCFS ≈100 USD/ton — source of cost pressure
- RINs/credit price volatility increases supplier power
- Certifiers/testing = gatekeepers
- Vertical coordination, inventory reduce spike risk
Global commodity dynamics
- Brent 2024 avg ~86 USD/bbl
- OPEC+ cuts ~2.7 mb/d
- DXY ~+5% in 2024
- Pass-through speed > contract repricing
Refiners pass costs as Brent ~86 USD/bbl, OPEC+ cuts 2.7 mb/d
Supplier power is high: concentrated refiners (US capacity ~19m b/d in 2024) and midstream (Colonial Pipeline ~45% East Coast) can pass costs quickly; Brent ~86 USD/bbl and OPEC+ cuts ~2.7 mb/d in 2024 amplify volatility. LCFS ~100 USD/ton and RINs add mandated cost pressure; hedging, storage and terminal ownership partially mitigate.
| Metric | 2024 |
|---|---|
| US refinery capacity | ~19m b/d |
| Colonial Pipeline share | ~45% East Coast |
| Brent avg | ~86 USD/bbl |
| LCFS CA | ~100 USD/ton |
What is included in the product
Detailed Word Document
Concise Porter's Five Forces for Colonial Group: evaluates competitive rivalry, buyer and supplier power, threats from substitutes and new entrants, highlighting key drivers, disruptive threats, pricing influence, and strategic barriers protecting incumbency—editable for investor decks and internal strategy.
Customizable Excel Spreadsheet
A concise Porter's Five Forces snapshot tailored to Colonial Group—streamlines competitive insights for faster strategic decisions. Swap in current metrics, visualize pressure on a radar chart, and drop the sheet straight into decks or reports for immediate boardroom-ready clarity.
Customers Bargaining Power
Wholesale and commercial buyers
Fleet operators, industrials and marine customers buy in large volumes and extract discounts through multi-bid tenders and contracted volumes, increasing price pressure on Colonial Group. Top 10 container lines controlled about 80% of global container capacity in 2024 (Alphaliner), concentrating buyer power. Where logistics and delivery windows are comparable switching among distributors is feasible; superior service reliability and value-added logistics reduce pure price focus.
Retail consumers at pumps
Gasoline buyers are highly price sensitive with near-instant price transparency via apps; AAA reported the 2024 U.S. national average retail gasoline price near $3.50/gal, fueling frequent switching. Convenience of station location and c-store offerings create modest differentiation and can raise basket spend by ~10–15%. Loyalty programs reduce churn but only within small price bands; brand strength helps, yet local price wars often dictate volumes.
C-store product mix leverage
Merchandise vendors clash for limited shelf space while customers freely substitute items; NACS reports U.S. c‑store sales reached $804.7 billion in 2023, underscoring intense supplier competition. Basket size fluctuates with promotions and private‑label mix; private brands can boost margins materially. Buyers respond rapidly to small price moves in snacks and beverages, but data‑driven assortment and pricing lift margins despite sensitivity.
Marine charterers and brokers
Marine charterers and brokers compare day rates and safety records across operators; higher safety and on-time performance allow Colonial Group to command premiums even when spot rates fluctuate. Contract structures (spot vs term) shift bargaining power with market cycles: spot markets amplify charterer leverage during oversupply, term contracts stabilize revenue. High utilization reduces buyer leverage; slack capacity increases it. Global seaborne trade was about 11 billion tonnes in 2022 (UNCTAD).
- Day-rate sensitivity
- Spot vs term impact
- Utilization pressure
- Safety-driven premium
Digital price transparency
Fuel apps and procurement platforms expose price differentials up to $0.20/gal in real time, enabling buyers to leverage data and demand parity or better terms; by 2024 over 50% of large fleets use such platforms, compressing distributor margins in commoditized lanes.
- Price spread: $0.20/gal
- Adoption: >50% fleets (2024)
- Impact: margin compression
- Defense: bundled services and SLAs
Buyers hold leverage; top carriers ~80%, fleets on platforms >50%
Buyers wield strong price leverage via scale and real-time transparency—top 10 container lines ~80% capacity (2024, Alphaliner); fuel apps show up to $0.20/gal spreads and >50% of large fleets use platforms (2024). Convenience, loyalty and safety can earn small premiums, but spot markets and utilization cycles quickly shift bargaining power.
| Metric | Value |
|---|---|
| Top10 container share (2024) | ~80% |
| US avg gas (2024) | $3.50/gal |
| C‑store sales (2023) | $804.7B |
| Fleets on platforms (2024) | >50% |
Preview Before You Purchase
Colonial Group Porter's Five Forces Analysis
This preview shows the exact Colonial Group Porter's Five Forces Analysis you'll receive immediately after purchase—no surprises, no placeholders. The report is professionally written, fully formatted and ready for download and use the moment you buy. You're viewing the final deliverable, available instantly after payment.
Description
A Must-Have Tool for Decision-Makers
Colonial Group faces moderate supplier power, evolving buyer expectations, and a growing substitute threat that pressure margins and strategic choices. Competitive rivalry is intensified by entrenched rivals and selective new entrants, while regulatory shifts add external risk. This brief snapshot only scratches the surface. Unlock the full Porter's Five Forces Analysis to explore Colonial Group’s competitive dynamics, market pressures, and strategic advantages in detail.
Suppliers Bargaining Power
Refinery and upstream concentration
Colonial sources gasoline, diesel and specialty fuels from a narrow set of refiners and integrated oil majors; in the US the top five refiners account for roughly 50% of crude distillation capacity and US refinery capacity was about 19 million b/d in 2024 (EIA). Supplier consolidation and outages can spike transfer prices; long-term offtake deals and hedging blunt price swings but lock in volumes and reduce flexibility. Marine fuels and specialty products are supplied by niche plants, increasing supplier pricing power and margin volatility for Colonial.
Infrastructure and terminal dependence
Pipeline access, storage tanks and berths are concentrated among a few midstream owners—Colonial Pipeline alone delivers roughly 45% of refined product to the US East Coast—giving suppliers strong bargaining power. Take-or-pay contracts and regulated tariffs (FERC oversight for interstate pipelines) lock in fixed costs and limit pass-through flexibility. Alternative routing during constraints is costly and slow, often adding days and millions in logistics spend. Owning or long-leasing diversified terminals partially offsets landlord leverage by enabling operational rerouting and volume control.
Marine fleet and equipment OEMs
Barges, tugs and critical components come from specialized shipyards/OEMs with typical newbuild lead times of ~9–24 months in 2024, raising switching costs due to classification and retrofit requirements. Recurring maintenance parts and service contracts—often 20–30% of OEM revenues—sustain supplier pricing power. Lifecycle management, strategic spares and multi-sourcing can moderate dependence.
Regulatory and compliance inputs
Regulatory inputs like additives, emissions control tech and compliance credits (RINs, LCFS) create mandated purchase needs; California LCFS averaged about 100 USD/ton in 2024, driving supplier leverage and price volatility that suppliers can influence. Certification and testing providers wield gatekeeping power through approval timelines and fees, while vertical coordination and inventory planning mitigate spike exposure.
- Mandated inputs: additives, emissions tech, credits
- 2024 LCFS ≈100 USD/ton — source of cost pressure
- RINs/credit price volatility increases supplier power
- Certifiers/testing = gatekeepers
- Vertical coordination, inventory reduce spike risk
Global commodity dynamics
- Brent 2024 avg ~86 USD/bbl
- OPEC+ cuts ~2.7 mb/d
- DXY ~+5% in 2024
- Pass-through speed > contract repricing
Refiners pass costs as Brent ~86 USD/bbl, OPEC+ cuts 2.7 mb/d
Supplier power is high: concentrated refiners (US capacity ~19m b/d in 2024) and midstream (Colonial Pipeline ~45% East Coast) can pass costs quickly; Brent ~86 USD/bbl and OPEC+ cuts ~2.7 mb/d in 2024 amplify volatility. LCFS ~100 USD/ton and RINs add mandated cost pressure; hedging, storage and terminal ownership partially mitigate.
| Metric | 2024 |
|---|---|
| US refinery capacity | ~19m b/d |
| Colonial Pipeline share | ~45% East Coast |
| Brent avg | ~86 USD/bbl |
| LCFS CA | ~100 USD/ton |
What is included in the product
Detailed Word Document
Concise Porter's Five Forces for Colonial Group: evaluates competitive rivalry, buyer and supplier power, threats from substitutes and new entrants, highlighting key drivers, disruptive threats, pricing influence, and strategic barriers protecting incumbency—editable for investor decks and internal strategy.
Customizable Excel Spreadsheet
A concise Porter's Five Forces snapshot tailored to Colonial Group—streamlines competitive insights for faster strategic decisions. Swap in current metrics, visualize pressure on a radar chart, and drop the sheet straight into decks or reports for immediate boardroom-ready clarity.
Customers Bargaining Power
Wholesale and commercial buyers
Fleet operators, industrials and marine customers buy in large volumes and extract discounts through multi-bid tenders and contracted volumes, increasing price pressure on Colonial Group. Top 10 container lines controlled about 80% of global container capacity in 2024 (Alphaliner), concentrating buyer power. Where logistics and delivery windows are comparable switching among distributors is feasible; superior service reliability and value-added logistics reduce pure price focus.
Retail consumers at pumps
Gasoline buyers are highly price sensitive with near-instant price transparency via apps; AAA reported the 2024 U.S. national average retail gasoline price near $3.50/gal, fueling frequent switching. Convenience of station location and c-store offerings create modest differentiation and can raise basket spend by ~10–15%. Loyalty programs reduce churn but only within small price bands; brand strength helps, yet local price wars often dictate volumes.
C-store product mix leverage
Merchandise vendors clash for limited shelf space while customers freely substitute items; NACS reports U.S. c‑store sales reached $804.7 billion in 2023, underscoring intense supplier competition. Basket size fluctuates with promotions and private‑label mix; private brands can boost margins materially. Buyers respond rapidly to small price moves in snacks and beverages, but data‑driven assortment and pricing lift margins despite sensitivity.
Marine charterers and brokers
Marine charterers and brokers compare day rates and safety records across operators; higher safety and on-time performance allow Colonial Group to command premiums even when spot rates fluctuate. Contract structures (spot vs term) shift bargaining power with market cycles: spot markets amplify charterer leverage during oversupply, term contracts stabilize revenue. High utilization reduces buyer leverage; slack capacity increases it. Global seaborne trade was about 11 billion tonnes in 2022 (UNCTAD).
- Day-rate sensitivity
- Spot vs term impact
- Utilization pressure
- Safety-driven premium
Digital price transparency
Fuel apps and procurement platforms expose price differentials up to $0.20/gal in real time, enabling buyers to leverage data and demand parity or better terms; by 2024 over 50% of large fleets use such platforms, compressing distributor margins in commoditized lanes.
- Price spread: $0.20/gal
- Adoption: >50% fleets (2024)
- Impact: margin compression
- Defense: bundled services and SLAs
Buyers hold leverage; top carriers ~80%, fleets on platforms >50%
Buyers wield strong price leverage via scale and real-time transparency—top 10 container lines ~80% capacity (2024, Alphaliner); fuel apps show up to $0.20/gal spreads and >50% of large fleets use platforms (2024). Convenience, loyalty and safety can earn small premiums, but spot markets and utilization cycles quickly shift bargaining power.
| Metric | Value |
|---|---|
| Top10 container share (2024) | ~80% |
| US avg gas (2024) | $3.50/gal |
| C‑store sales (2023) | $804.7B |
| Fleets on platforms (2024) | >50% |
Preview Before You Purchase
Colonial Group Porter's Five Forces Analysis
This preview shows the exact Colonial Group Porter's Five Forces Analysis you'll receive immediately after purchase—no surprises, no placeholders. The report is professionally written, fully formatted and ready for download and use the moment you buy. You're viewing the final deliverable, available instantly after payment.











