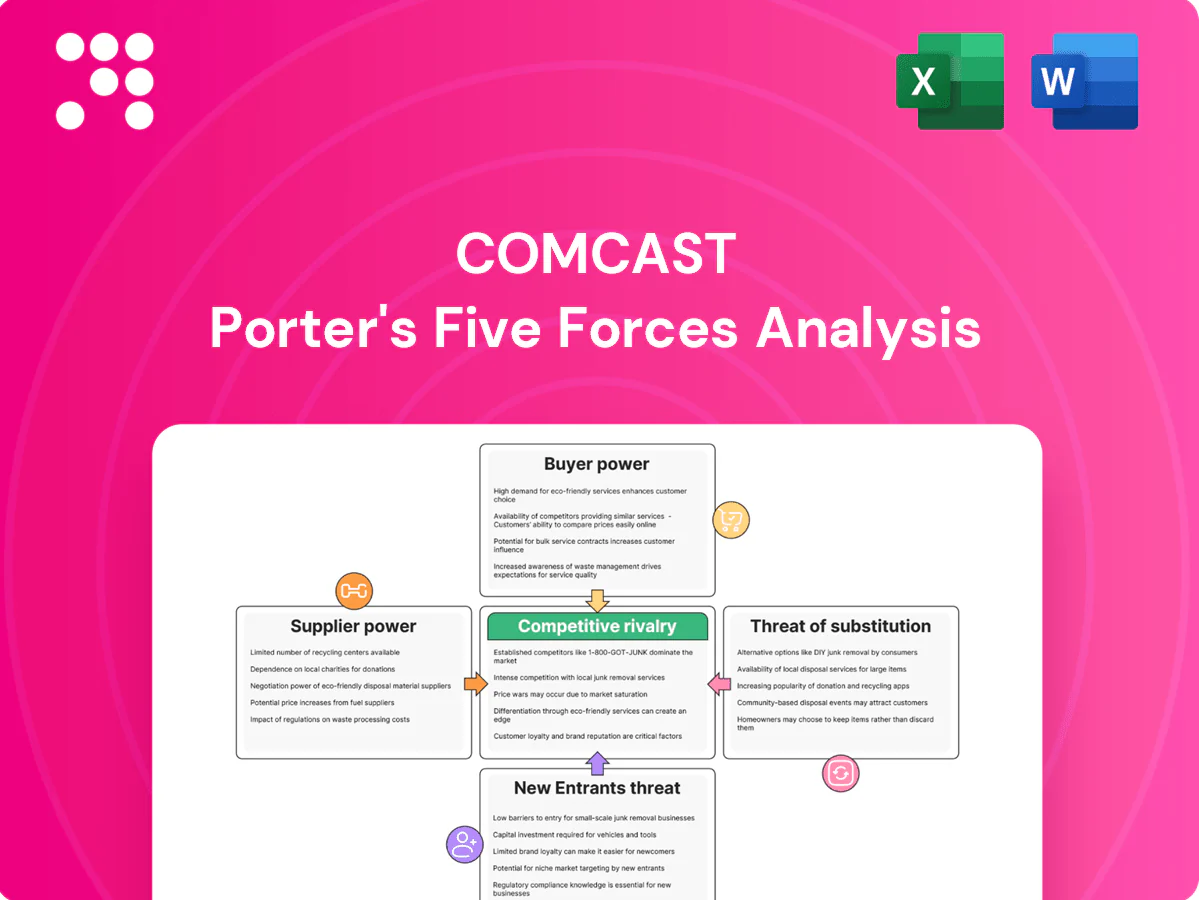
Comcast Porter's Five Forces Analysis

Go Beyond the Preview—Access the Full Strategic Report
Comcast faces intense rivalry from cable, streaming and telecom players, moderate supplier leverage, growing buyer power driven by streaming choices, low threat of new infrastructure entrants but significant substitution risk, and regulatory factors that shape strategic options—this brief snapshot only scratches the surface; unlock the full Porter’s Five Forces Analysis to explore Comcast’s competitive dynamics and actionable insights in detail.
Suppliers Bargaining Power

Critical network equipment vendors
Comcast relies on a concentrated set of suppliers for CMTS/CCAP, fiber and CPE, which raises switching costs and gives vendors leverage over pricing and lead times; Comcast reported about 31.6 million residential broadband customers in 2024, amplifying the impact of vendor constraints. Standards improve interoperability but integration and certification add months and millions in engineering costs, while supply-chain tightness has periodically delayed upgrades and constrained service rollout.
Premium content and sports rights
NBCUniversal licenses and sells marquee content while Comcast’s video business purchases third‑party channels and sports rights, with top leagues and must‑have networks exerting strong bargaining power through exclusivity and bidding cycles. The NFL’s 2021 media deals totaling about 110 billion dollars through 2033 exemplify escalating rights costs that pressure margins and retail pricing. Blackout risks from rights disputes can erode subscriber satisfaction and drive churn.

Pole access, backhaul, and construction services
Access to utility poles, conduits and municipal rights‑of‑way is essential for Comcast’s network build; Comcast serves about 33 million broadband customers (mid‑2024), so pole access constrains scale. Third‑party pole owners and contractors can delay projects and raise costs via make‑ready work and permitting, which often adds weeks to months of timeline and variable budget risk. Negotiation leverage shifts widely by locality and regulation.

Cloud, CDN, and ad-tech platforms
Talent, unions, and creative partners
Film and TV production relies on actors, writers, directors and unionized crews; the 2023 WGA strike (May 2–Sep 27, 2023, 148 days) and SAG‑AFTRA strike (Jul 14–Nov 9, 2023, 118 days) showed how labor actions can halt pipelines, inflate costs and shift release schedules. Star talent and top studios command premiums — leading players can earn tens of millions per film — and content volatility disrupts distribution windows and theme‑park synergy.
- Dependency: unionized crews essential to production
- Risk: 2023 strikes halted releases, paused pipelines
- Cost: top talent can command tens of millions
- Spillover: content gaps hurt streaming and parks revenue
Supplier power: 31.6M subs, $110B rights, cloud concentrated
Supplier power is elevated: Comcast's ~31.6M residential broadband base (2024) amplifies vendor constraints for CMTS/CCAP, fiber and CPE, raising switching costs and lead‑time risk. Content rights (NFL ~$110B thru 2033) and talent drive outsized bargaining on pricing and exclusivity. Hyperscalers (AWS 32%, Azure 23%, GCP 11% = ~66% share) and CDNs concentrate cloud/ad-tech leverage. Pole access, permitting and 2023 strikes (WGA 148d, SAG‑AFTRA 118d) add timing and cost volatility.
| Supplier category | Key metric | Impact |
|---|---|---|
| Network HW/CPE | 31.6M subs (2024) | Higher vendor leverage |
| Content rights | NFL ~$110B thru 2033 | Escalating costs |
| Hyperscalers/CDN | AWS 32%/Azure 23%/GCP 11% | Concentrated pricing power |
| Labor/permits | WGA 148d/SAG‑AFTRA 118d | Production delays, cost spikes |
What is included in the product
 Detailed Word Document
Tailored Porter’s Five Forces analysis for Comcast uncovers competitive intensity from cable and streaming rivals, buyer bargaining via cord-cutting, and supplier leverage in content and network equipment, while assessing substitute threats, high capital/scale barriers deterring new entrants, and regulatory influences shaping pricing and profitability.

 Customizable Excel Spreadsheet
One-sheet Comcast Porter's Five Forces: instantly visualize competitive pressures with a customizable radar chart, ready to drop into decks and tweak for regulatory or tech shifts—no macros, easy for non-finance users.
Customers Bargaining Power

Residential broadband price sensitivity
Households treat broadband as essential but remain price conscious; Xfinity held about 30% of the US fixed broadband market in 2024, keeping customers sensitive to price and value. Promotional cycles and fee transparency—many ISPs use 12-month introductory rates—drive switching and churn. Where fiber or 5G FWA is available, buyers gain leverage, and data caps plus speed tiers materially affect perceived value and willingness to switch.
Video cord‑cutting and channel unbundling
Consumers substituting streaming for pay‑TV—U.S. pay‑TV households fell to roughly 60 million in 2024—reduces dependence on cable bundles and raises buyer power via à la carte choices; heightened churn pressure cuts ARPU and forces aggressive packaging, while exclusive sports rights remain a partial counterweight sustaining retention and premium pricing.

Enterprise and SMB contract negotiation
Enterprise and SMB customers routinely run RFPs across multiple providers, and in 2024 multi-site connectivity, strict SLAs and security bundles became primary bargaining chips in negotiations. Buyers accept longer-term contracts to swap lower pricing for reliability and service credits. Widespread dual sourcing and competitive fiber buildouts are increasingly limiting Comcast’s pricing power.

Bundle stickiness vs switching costs
Quad-play Xfinity bundles add convenience and discounts but can obscure component pricing; in 2024 Comcast reported about 31.9 million residential broadband customers and roughly 7.6 million mobile lines, giving bundles scale yet masking true per-service cost. Buyers can threaten to unbundle to gain concessions; number portability and self-install kits reduce switching friction. Loyalty programs and device financing temper immediate buyer power.
- Bundle discounts mask price transparency
- Unbundling threat raises negotiation leverage
- Number portability + self-install lower switching costs
- Loyalty programs & device financing restrain churn
Advertisers and Peacock subscribers
Advertisers pressure Comcast for precise targeting, measurement, and brand safety, compressing CPMs and raising ad-tech costs; Peacock reported roughly 26 million monthly active accounts and about 9.6 million paid subscribers in 2024, making ad revenue sensitive to performance metrics and privacy constraints.
AVOD/SVOD churn is high since users can cancel monthly; exclusive content and smooth UX partially reduce buyer power, while consumer data-privacy choices limit acceptable ad load and personalization.
- Advertisers: targeting, measurement, brand safety
- Peacock 2024: ~26M MAUs, ~9.6M paid subs
- High churn risk; exclusivity/UX mitigate
- Privacy limits ad load and personalization
Broadband essential; top cable holds ~30%, 31.9M subs
Households view broadband as essential but remain price sensitive; Xfinity held ~30% US fixed‑broadband share with ~31.9M residential broadband subs in 2024, boosting buyer price leverage. Cord‑cutting left ~60M pay‑TV households in 2024, increasing demand for à la carte options. Enterprise/SMB RFPs, longer contracts for SLAs, and quad‑play bundles (7.6M mobile lines) shape negotiation dynamics; Peacock: ~26M MAUs, ~9.6M paid subs.
| Metric | 2024 |
|---|---|
| Xfinity fixed broadband share | ~30% |
| Residential broadband customers | 31.9M |
| Mobile lines | 7.6M |
| US pay‑TV households | ~60M |
| Peacock MAUs | ~26M |
| Peacock paid subscribers | ~9.6M |
Same Document Delivered
Comcast Porter's Five Forces Analysis
This preview shows the exact Comcast Porter’s Five Forces analysis you'll receive immediately after purchase—no surprises or placeholders. The document displayed is the full, professionally formatted file, ready for download and use the moment you buy. You’re previewing the final deliverable and will get instant access to this exact document upon payment.

Go Beyond the Preview—Access the Full Strategic Report
Comcast faces intense rivalry from cable, streaming and telecom players, moderate supplier leverage, growing buyer power driven by streaming choices, low threat of new infrastructure entrants but significant substitution risk, and regulatory factors that shape strategic options—this brief snapshot only scratches the surface; unlock the full Porter’s Five Forces Analysis to explore Comcast’s competitive dynamics and actionable insights in detail.
Suppliers Bargaining Power
Critical network equipment vendors
Comcast relies on a concentrated set of suppliers for CMTS/CCAP, fiber and CPE, which raises switching costs and gives vendors leverage over pricing and lead times; Comcast reported about 31.6 million residential broadband customers in 2024, amplifying the impact of vendor constraints. Standards improve interoperability but integration and certification add months and millions in engineering costs, while supply-chain tightness has periodically delayed upgrades and constrained service rollout.
Premium content and sports rights
NBCUniversal licenses and sells marquee content while Comcast’s video business purchases third‑party channels and sports rights, with top leagues and must‑have networks exerting strong bargaining power through exclusivity and bidding cycles. The NFL’s 2021 media deals totaling about 110 billion dollars through 2033 exemplify escalating rights costs that pressure margins and retail pricing. Blackout risks from rights disputes can erode subscriber satisfaction and drive churn.
Pole access, backhaul, and construction services
Access to utility poles, conduits and municipal rights‑of‑way is essential for Comcast’s network build; Comcast serves about 33 million broadband customers (mid‑2024), so pole access constrains scale. Third‑party pole owners and contractors can delay projects and raise costs via make‑ready work and permitting, which often adds weeks to months of timeline and variable budget risk. Negotiation leverage shifts widely by locality and regulation.
Cloud, CDN, and ad-tech platforms
Talent, unions, and creative partners
Film and TV production relies on actors, writers, directors and unionized crews; the 2023 WGA strike (May 2–Sep 27, 2023, 148 days) and SAG‑AFTRA strike (Jul 14–Nov 9, 2023, 118 days) showed how labor actions can halt pipelines, inflate costs and shift release schedules. Star talent and top studios command premiums — leading players can earn tens of millions per film — and content volatility disrupts distribution windows and theme‑park synergy.
- Dependency: unionized crews essential to production
- Risk: 2023 strikes halted releases, paused pipelines
- Cost: top talent can command tens of millions
- Spillover: content gaps hurt streaming and parks revenue
Supplier power: 31.6M subs, $110B rights, cloud concentrated
Supplier power is elevated: Comcast's ~31.6M residential broadband base (2024) amplifies vendor constraints for CMTS/CCAP, fiber and CPE, raising switching costs and lead‑time risk. Content rights (NFL ~$110B thru 2033) and talent drive outsized bargaining on pricing and exclusivity. Hyperscalers (AWS 32%, Azure 23%, GCP 11% = ~66% share) and CDNs concentrate cloud/ad-tech leverage. Pole access, permitting and 2023 strikes (WGA 148d, SAG‑AFTRA 118d) add timing and cost volatility.
| Supplier category | Key metric | Impact |
|---|---|---|
| Network HW/CPE | 31.6M subs (2024) | Higher vendor leverage |
| Content rights | NFL ~$110B thru 2033 | Escalating costs |
| Hyperscalers/CDN | AWS 32%/Azure 23%/GCP 11% | Concentrated pricing power |
| Labor/permits | WGA 148d/SAG‑AFTRA 118d | Production delays, cost spikes |
What is included in the product
Detailed Word Document
Tailored Porter’s Five Forces analysis for Comcast uncovers competitive intensity from cable and streaming rivals, buyer bargaining via cord-cutting, and supplier leverage in content and network equipment, while assessing substitute threats, high capital/scale barriers deterring new entrants, and regulatory influences shaping pricing and profitability.
Customizable Excel Spreadsheet
One-sheet Comcast Porter's Five Forces: instantly visualize competitive pressures with a customizable radar chart, ready to drop into decks and tweak for regulatory or tech shifts—no macros, easy for non-finance users.
Customers Bargaining Power
Residential broadband price sensitivity
Households treat broadband as essential but remain price conscious; Xfinity held about 30% of the US fixed broadband market in 2024, keeping customers sensitive to price and value. Promotional cycles and fee transparency—many ISPs use 12-month introductory rates—drive switching and churn. Where fiber or 5G FWA is available, buyers gain leverage, and data caps plus speed tiers materially affect perceived value and willingness to switch.
Video cord‑cutting and channel unbundling
Consumers substituting streaming for pay‑TV—U.S. pay‑TV households fell to roughly 60 million in 2024—reduces dependence on cable bundles and raises buyer power via à la carte choices; heightened churn pressure cuts ARPU and forces aggressive packaging, while exclusive sports rights remain a partial counterweight sustaining retention and premium pricing.
Enterprise and SMB contract negotiation
Enterprise and SMB customers routinely run RFPs across multiple providers, and in 2024 multi-site connectivity, strict SLAs and security bundles became primary bargaining chips in negotiations. Buyers accept longer-term contracts to swap lower pricing for reliability and service credits. Widespread dual sourcing and competitive fiber buildouts are increasingly limiting Comcast’s pricing power.
Bundle stickiness vs switching costs
Quad-play Xfinity bundles add convenience and discounts but can obscure component pricing; in 2024 Comcast reported about 31.9 million residential broadband customers and roughly 7.6 million mobile lines, giving bundles scale yet masking true per-service cost. Buyers can threaten to unbundle to gain concessions; number portability and self-install kits reduce switching friction. Loyalty programs and device financing temper immediate buyer power.
- Bundle discounts mask price transparency
- Unbundling threat raises negotiation leverage
- Number portability + self-install lower switching costs
- Loyalty programs & device financing restrain churn
Advertisers and Peacock subscribers
Advertisers pressure Comcast for precise targeting, measurement, and brand safety, compressing CPMs and raising ad-tech costs; Peacock reported roughly 26 million monthly active accounts and about 9.6 million paid subscribers in 2024, making ad revenue sensitive to performance metrics and privacy constraints.
AVOD/SVOD churn is high since users can cancel monthly; exclusive content and smooth UX partially reduce buyer power, while consumer data-privacy choices limit acceptable ad load and personalization.
- Advertisers: targeting, measurement, brand safety
- Peacock 2024: ~26M MAUs, ~9.6M paid subs
- High churn risk; exclusivity/UX mitigate
- Privacy limits ad load and personalization
Broadband essential; top cable holds ~30%, 31.9M subs
Households view broadband as essential but remain price sensitive; Xfinity held ~30% US fixed‑broadband share with ~31.9M residential broadband subs in 2024, boosting buyer price leverage. Cord‑cutting left ~60M pay‑TV households in 2024, increasing demand for à la carte options. Enterprise/SMB RFPs, longer contracts for SLAs, and quad‑play bundles (7.6M mobile lines) shape negotiation dynamics; Peacock: ~26M MAUs, ~9.6M paid subs.
| Metric | 2024 |
|---|---|
| Xfinity fixed broadband share | ~30% |
| Residential broadband customers | 31.9M |
| Mobile lines | 7.6M |
| US pay‑TV households | ~60M |
| Peacock MAUs | ~26M |
| Peacock paid subscribers | ~9.6M |
Same Document Delivered
Comcast Porter's Five Forces Analysis
This preview shows the exact Comcast Porter’s Five Forces analysis you'll receive immediately after purchase—no surprises or placeholders. The document displayed is the full, professionally formatted file, ready for download and use the moment you buy. You’re previewing the final deliverable and will get instant access to this exact document upon payment.
Description
Go Beyond the Preview—Access the Full Strategic Report
Comcast faces intense rivalry from cable, streaming and telecom players, moderate supplier leverage, growing buyer power driven by streaming choices, low threat of new infrastructure entrants but significant substitution risk, and regulatory factors that shape strategic options—this brief snapshot only scratches the surface; unlock the full Porter’s Five Forces Analysis to explore Comcast’s competitive dynamics and actionable insights in detail.
Suppliers Bargaining Power
Critical network equipment vendors
Comcast relies on a concentrated set of suppliers for CMTS/CCAP, fiber and CPE, which raises switching costs and gives vendors leverage over pricing and lead times; Comcast reported about 31.6 million residential broadband customers in 2024, amplifying the impact of vendor constraints. Standards improve interoperability but integration and certification add months and millions in engineering costs, while supply-chain tightness has periodically delayed upgrades and constrained service rollout.
Premium content and sports rights
NBCUniversal licenses and sells marquee content while Comcast’s video business purchases third‑party channels and sports rights, with top leagues and must‑have networks exerting strong bargaining power through exclusivity and bidding cycles. The NFL’s 2021 media deals totaling about 110 billion dollars through 2033 exemplify escalating rights costs that pressure margins and retail pricing. Blackout risks from rights disputes can erode subscriber satisfaction and drive churn.
Pole access, backhaul, and construction services
Access to utility poles, conduits and municipal rights‑of‑way is essential for Comcast’s network build; Comcast serves about 33 million broadband customers (mid‑2024), so pole access constrains scale. Third‑party pole owners and contractors can delay projects and raise costs via make‑ready work and permitting, which often adds weeks to months of timeline and variable budget risk. Negotiation leverage shifts widely by locality and regulation.
Cloud, CDN, and ad-tech platforms
Talent, unions, and creative partners
Film and TV production relies on actors, writers, directors and unionized crews; the 2023 WGA strike (May 2–Sep 27, 2023, 148 days) and SAG‑AFTRA strike (Jul 14–Nov 9, 2023, 118 days) showed how labor actions can halt pipelines, inflate costs and shift release schedules. Star talent and top studios command premiums — leading players can earn tens of millions per film — and content volatility disrupts distribution windows and theme‑park synergy.
- Dependency: unionized crews essential to production
- Risk: 2023 strikes halted releases, paused pipelines
- Cost: top talent can command tens of millions
- Spillover: content gaps hurt streaming and parks revenue
Supplier power: 31.6M subs, $110B rights, cloud concentrated
Supplier power is elevated: Comcast's ~31.6M residential broadband base (2024) amplifies vendor constraints for CMTS/CCAP, fiber and CPE, raising switching costs and lead‑time risk. Content rights (NFL ~$110B thru 2033) and talent drive outsized bargaining on pricing and exclusivity. Hyperscalers (AWS 32%, Azure 23%, GCP 11% = ~66% share) and CDNs concentrate cloud/ad-tech leverage. Pole access, permitting and 2023 strikes (WGA 148d, SAG‑AFTRA 118d) add timing and cost volatility.
| Supplier category | Key metric | Impact |
|---|---|---|
| Network HW/CPE | 31.6M subs (2024) | Higher vendor leverage |
| Content rights | NFL ~$110B thru 2033 | Escalating costs |
| Hyperscalers/CDN | AWS 32%/Azure 23%/GCP 11% | Concentrated pricing power |
| Labor/permits | WGA 148d/SAG‑AFTRA 118d | Production delays, cost spikes |
What is included in the product
Detailed Word Document
Tailored Porter’s Five Forces analysis for Comcast uncovers competitive intensity from cable and streaming rivals, buyer bargaining via cord-cutting, and supplier leverage in content and network equipment, while assessing substitute threats, high capital/scale barriers deterring new entrants, and regulatory influences shaping pricing and profitability.
Customizable Excel Spreadsheet
One-sheet Comcast Porter's Five Forces: instantly visualize competitive pressures with a customizable radar chart, ready to drop into decks and tweak for regulatory or tech shifts—no macros, easy for non-finance users.
Customers Bargaining Power
Residential broadband price sensitivity
Households treat broadband as essential but remain price conscious; Xfinity held about 30% of the US fixed broadband market in 2024, keeping customers sensitive to price and value. Promotional cycles and fee transparency—many ISPs use 12-month introductory rates—drive switching and churn. Where fiber or 5G FWA is available, buyers gain leverage, and data caps plus speed tiers materially affect perceived value and willingness to switch.
Video cord‑cutting and channel unbundling
Consumers substituting streaming for pay‑TV—U.S. pay‑TV households fell to roughly 60 million in 2024—reduces dependence on cable bundles and raises buyer power via à la carte choices; heightened churn pressure cuts ARPU and forces aggressive packaging, while exclusive sports rights remain a partial counterweight sustaining retention and premium pricing.
Enterprise and SMB contract negotiation
Enterprise and SMB customers routinely run RFPs across multiple providers, and in 2024 multi-site connectivity, strict SLAs and security bundles became primary bargaining chips in negotiations. Buyers accept longer-term contracts to swap lower pricing for reliability and service credits. Widespread dual sourcing and competitive fiber buildouts are increasingly limiting Comcast’s pricing power.
Bundle stickiness vs switching costs
Quad-play Xfinity bundles add convenience and discounts but can obscure component pricing; in 2024 Comcast reported about 31.9 million residential broadband customers and roughly 7.6 million mobile lines, giving bundles scale yet masking true per-service cost. Buyers can threaten to unbundle to gain concessions; number portability and self-install kits reduce switching friction. Loyalty programs and device financing temper immediate buyer power.
- Bundle discounts mask price transparency
- Unbundling threat raises negotiation leverage
- Number portability + self-install lower switching costs
- Loyalty programs & device financing restrain churn
Advertisers and Peacock subscribers
Advertisers pressure Comcast for precise targeting, measurement, and brand safety, compressing CPMs and raising ad-tech costs; Peacock reported roughly 26 million monthly active accounts and about 9.6 million paid subscribers in 2024, making ad revenue sensitive to performance metrics and privacy constraints.
AVOD/SVOD churn is high since users can cancel monthly; exclusive content and smooth UX partially reduce buyer power, while consumer data-privacy choices limit acceptable ad load and personalization.
- Advertisers: targeting, measurement, brand safety
- Peacock 2024: ~26M MAUs, ~9.6M paid subs
- High churn risk; exclusivity/UX mitigate
- Privacy limits ad load and personalization
Broadband essential; top cable holds ~30%, 31.9M subs
Households view broadband as essential but remain price sensitive; Xfinity held ~30% US fixed‑broadband share with ~31.9M residential broadband subs in 2024, boosting buyer price leverage. Cord‑cutting left ~60M pay‑TV households in 2024, increasing demand for à la carte options. Enterprise/SMB RFPs, longer contracts for SLAs, and quad‑play bundles (7.6M mobile lines) shape negotiation dynamics; Peacock: ~26M MAUs, ~9.6M paid subs.
| Metric | 2024 |
|---|---|
| Xfinity fixed broadband share | ~30% |
| Residential broadband customers | 31.9M |
| Mobile lines | 7.6M |
| US pay‑TV households | ~60M |
| Peacock MAUs | ~26M |
| Peacock paid subscribers | ~9.6M |
Same Document Delivered
Comcast Porter's Five Forces Analysis
This preview shows the exact Comcast Porter’s Five Forces analysis you'll receive immediately after purchase—no surprises or placeholders. The document displayed is the full, professionally formatted file, ready for download and use the moment you buy. You’re previewing the final deliverable and will get instant access to this exact document upon payment.











