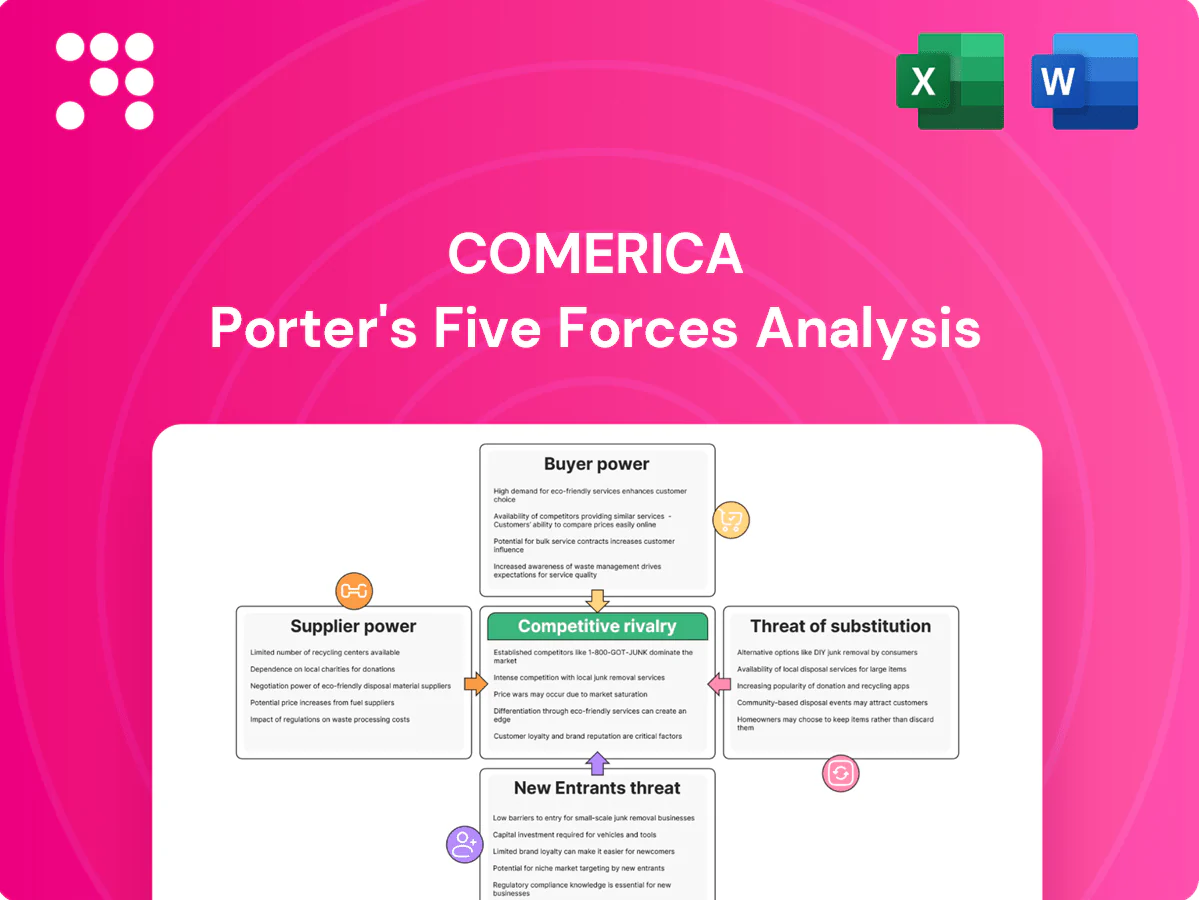
Comerica Porter's Five Forces Analysis

Don't Miss the Bigger Picture
Comerica's Porter’s Five Forces snapshot highlights competitive intensity across regional banking—buyer bargaining, supplier and capital constraints, threats from fintech entrants, and substitute products shaping margins. This brief flags strategic risks and growth levers for management and investors. Unlock the full Porter’s Five Forces Analysis to explore Comerica’s competitive dynamics, market pressures, and strategic advantages in detail.
Suppliers Bargaining Power

Wholesale funding and capital markets
Comerica supplements deposits with FHLB lines, brokered CDs and capital‑markets funding, giving those suppliers pricing and covenant leverage; with the fed funds target at 5.25–5.50% in 2024, spreads and issuance costs rose. During tight liquidity windows spreads widen and terms toughen, lifting cost of funds and pressuring margins. Diversifying maturities and holding strong ratings mitigates reliance, but supplier power spikes in stress periods. Liquidity regulation (e.g., GSIB/LCR focus) further elevates these counterparties’ importance.
Core technology and fintech vendors
Core banking vendors for regional banks like Comerica (FIS, Fiserv, Jack Henry) plus concentrated cloud providers (AWS 32%, Azure 23%, GCP 10% in 2024) and dominant card networks (Visa+Mastercard ~80% of card volume) raise switching costs via contract lock-ins, integration complexity, and compliance burdens. Vendors can affect roadmaps, pricing, and SLAs. Co-development and multi-vendor architectures lower single-vendor dependence.

Depositors as suppliers of funding
Households and small businesses supply Comerica with low-cost, fragmented deposits, limiting individual bargaining power, while large corporate and municipal depositors can negotiate preferential rates and services. Rate competition sharpened in 2023–2024 as the federal funds rate rose to 5.25–5.50%, shifting leverage toward depositors. Relationship banking and cash-management offerings help Comerica retain balances and mitigate outflows.

Specialized talent and compliance expertise
Skilled relationship managers and scarce risk, cyber, and regulatory professionals push wage pressure higher; US unemployment averaged about 3.7% in 2024, tightening labor supply and elevating supplier power for talent. Rising compliance demands and tighter labor markets increase hiring costs and attrition risk, which can degrade service quality and constrain growth. Training pipelines and retention incentives partially mitigate scarcity but raise operating expense.
- Talent scarcity: higher hiring costs and wage inflation
- Attrition risk: service quality and growth impact
- Compliance load: increases demand for specialists
- Mitigants: training pipelines and retention incentives
Payment networks and custodial services
Card networks, ACH and real-time rails and custodians are essential infrastructure with few substitutes: Visa and Mastercard account for over 80% of U.S. card volume, FedNow went live in 2023 and top custodians hold tens of trillions in assets under custody. Fee schedules and rule changes materially affect Comerica’s economics and product design. Network access rules force ongoing compliance and tech investment, while scale-based pricing favors the largest banks and pressures midsize peers.
- Market concentration: Visa/Mastercard >80% share
- Real-time rails: FedNow live 2023
- Custody scale: top custodians hold tens of trillions
- Impact: fee/rule shifts alter margins; scale pricing disadvantages midsize banks
Regional bank faces rising supplier power, higher funding costs and concentrated tech leverage
Comerica faces elevated supplier power: wholesale funding (FHLB, brokered CDs) tightened as fed funds hit 5.25–5.50% in 2024, lifting cost of funds and covenant leverage; vendor lock‑ins (FIS/Fiserv/Jack Henry) and concentrated cloud (AWS 32%, Azure 23%, GCP 10% 2024) raise switching costs. Large depositors and card networks (Visa+Mastercard ≈80%) extract pricing concessions; talent scarcity (US unemployment ~3.7% 2024) raises wage pressure.
| Metric | 2024 |
|---|---|
| Fed funds | 5.25–5.50% |
| AWS market share | 32% |
| Visa+MC share | ≈80% |
| Unemployment | ~3.7% |
What is included in the product
 Detailed Word Document
Tailored Porter’s Five Forces analysis for Comerica that uncovers key competitive drivers, customer and supplier influence, entry barriers, substitutes and disruptive threats, with strategic commentary and editable output for investor reports, internal strategy decks, or academic use.

 Customizable Excel Spreadsheet
A concise Comerica Porter's Five Forces one-sheet that visualizes competitive pressure with an editable spider chart, ready to drop into pitch decks or boardroom slides—no macros or complex code, easily swap in your own data and scenarios for rapid, actionable strategy decisions.
Customers Bargaining Power

Corporate and middle-market clients
Corporate and middle-market clients frequently multi-bank and run RFPs, intensifying price and term competition; Comerica reported about $39.3 billion in commercial loans in 2024, underscoring the scale at stake. These clients remain rate-sensitive on loans and deposits and demand integrated treasury solutions. Bundling and superior service can blunt customer power, but large clients retain strong negotiating leverage. Credit appetite cycles in 2024 shifted bargaining dynamics as underwriting tightened.
Retail customers with digital options
Retail customers can instantly compare Comerica rates and fees using digital tools, and with over 200 million U.S. mobile banking users in 2024, transparency and customer bargaining power have risen sharply. Account portability via ACH, Zelle and fintech front-ends lowers switching friction, while convenient branches and strong digital UX boost loyalty. Rate chasers still move quickly, but targeted rewards and personalized advice can materially reduce churn.

Wealth and institutional clients
Wealth and institutional Comerica clients with high balances exert strong bargaining power, negotiating fees, mandates, and investment spreads. Passive products now account for roughly half of US mutual fund and ETF assets, and rising robo adoption compresses fees and strengthens buyer leverage. Performance, platform breadth, and fiduciary capabilities remain key differentiators, while bespoke planning and trust services allow Comerica to justify premium pricing.

Treasury management users
Treasury management users exert moderate-high bargaining power: integrations make Comerica sticky, yet 2024 AFP survey shows 76% of corporates standardize requirements and run RFPs, forcing price competition. Demand for APIs/interoperability raises expectations for customization without premiums; cross-sell depth and strong fraud controls (top renewal driver) offset discounting.
- Integrations = stickiness
- 76% RFP/standardization (2024 AFP)
- APIs = expectation, no premium
- Cross-sell offsets discounts
- Fraud controls drive renewals
Geographic concentration effects
Comerica’s concentration in five core states — Texas, Michigan, California, Arizona and Florida — exposes it to localized competition and client bargaining dynamics; in hot metros rival banks often push pricing by tens of basis points to win marquee clients. Regional economic shifts (energy and auto cycles in TX and MI) can quickly alter client leverage on pricing and covenants. Diversifying across sectors and metros reduces this geographic bargaining risk.
- Core states: 5
- Competition impact: tens of bps on pricing
- Regional swings can shift leverage by 50–200 bps
- Mitigation: sector and metro diversification
Corporate clients wield high leverage: $39.3B loans; ~200M mobile users drive switches
Corporate, middle-market and treasury clients exert high bargaining power via multi-bank RFPs and rate sensitivity; Comerica held about $39.3B in commercial loans in 2024. Retail customers gain transparency from ~200M US mobile banking users (2024), raising switching risk. Wealth/institutional clients demand fee compression as passive products hit ~50% of US fund assets.
| Segment | Power | Key stats (2024) |
|---|---|---|
| Commercial | High | $39.3B loans |
| Retail | Moderate-High | ~200M mobile users |
| Wealth | High | Passive ≈50% assets |
| Treasury | Moderate-High | 76% RFP (AFP) |
What You See Is What You Get
Comerica Porter's Five Forces Analysis
This preview is the complete Comerica Porter's Five Forces Analysis and exactly matches the file you'll receive upon purchase. It includes the full assessment of competitive rivalry, buyer and supplier power, threats of entry and substitution, and strategic implications. No placeholders—download-ready and professionally formatted.

Don't Miss the Bigger Picture
Comerica's Porter’s Five Forces snapshot highlights competitive intensity across regional banking—buyer bargaining, supplier and capital constraints, threats from fintech entrants, and substitute products shaping margins. This brief flags strategic risks and growth levers for management and investors. Unlock the full Porter’s Five Forces Analysis to explore Comerica’s competitive dynamics, market pressures, and strategic advantages in detail.
Suppliers Bargaining Power
Wholesale funding and capital markets
Comerica supplements deposits with FHLB lines, brokered CDs and capital‑markets funding, giving those suppliers pricing and covenant leverage; with the fed funds target at 5.25–5.50% in 2024, spreads and issuance costs rose. During tight liquidity windows spreads widen and terms toughen, lifting cost of funds and pressuring margins. Diversifying maturities and holding strong ratings mitigates reliance, but supplier power spikes in stress periods. Liquidity regulation (e.g., GSIB/LCR focus) further elevates these counterparties’ importance.
Core technology and fintech vendors
Core banking vendors for regional banks like Comerica (FIS, Fiserv, Jack Henry) plus concentrated cloud providers (AWS 32%, Azure 23%, GCP 10% in 2024) and dominant card networks (Visa+Mastercard ~80% of card volume) raise switching costs via contract lock-ins, integration complexity, and compliance burdens. Vendors can affect roadmaps, pricing, and SLAs. Co-development and multi-vendor architectures lower single-vendor dependence.
Depositors as suppliers of funding
Households and small businesses supply Comerica with low-cost, fragmented deposits, limiting individual bargaining power, while large corporate and municipal depositors can negotiate preferential rates and services. Rate competition sharpened in 2023–2024 as the federal funds rate rose to 5.25–5.50%, shifting leverage toward depositors. Relationship banking and cash-management offerings help Comerica retain balances and mitigate outflows.
Specialized talent and compliance expertise
Skilled relationship managers and scarce risk, cyber, and regulatory professionals push wage pressure higher; US unemployment averaged about 3.7% in 2024, tightening labor supply and elevating supplier power for talent. Rising compliance demands and tighter labor markets increase hiring costs and attrition risk, which can degrade service quality and constrain growth. Training pipelines and retention incentives partially mitigate scarcity but raise operating expense.
- Talent scarcity: higher hiring costs and wage inflation
- Attrition risk: service quality and growth impact
- Compliance load: increases demand for specialists
- Mitigants: training pipelines and retention incentives
Payment networks and custodial services
Card networks, ACH and real-time rails and custodians are essential infrastructure with few substitutes: Visa and Mastercard account for over 80% of U.S. card volume, FedNow went live in 2023 and top custodians hold tens of trillions in assets under custody. Fee schedules and rule changes materially affect Comerica’s economics and product design. Network access rules force ongoing compliance and tech investment, while scale-based pricing favors the largest banks and pressures midsize peers.
- Market concentration: Visa/Mastercard >80% share
- Real-time rails: FedNow live 2023
- Custody scale: top custodians hold tens of trillions
- Impact: fee/rule shifts alter margins; scale pricing disadvantages midsize banks
Regional bank faces rising supplier power, higher funding costs and concentrated tech leverage
Comerica faces elevated supplier power: wholesale funding (FHLB, brokered CDs) tightened as fed funds hit 5.25–5.50% in 2024, lifting cost of funds and covenant leverage; vendor lock‑ins (FIS/Fiserv/Jack Henry) and concentrated cloud (AWS 32%, Azure 23%, GCP 10% 2024) raise switching costs. Large depositors and card networks (Visa+Mastercard ≈80%) extract pricing concessions; talent scarcity (US unemployment ~3.7% 2024) raises wage pressure.
| Metric | 2024 |
|---|---|
| Fed funds | 5.25–5.50% |
| AWS market share | 32% |
| Visa+MC share | ≈80% |
| Unemployment | ~3.7% |
What is included in the product
Detailed Word Document
Tailored Porter’s Five Forces analysis for Comerica that uncovers key competitive drivers, customer and supplier influence, entry barriers, substitutes and disruptive threats, with strategic commentary and editable output for investor reports, internal strategy decks, or academic use.
Customizable Excel Spreadsheet
A concise Comerica Porter's Five Forces one-sheet that visualizes competitive pressure with an editable spider chart, ready to drop into pitch decks or boardroom slides—no macros or complex code, easily swap in your own data and scenarios for rapid, actionable strategy decisions.
Customers Bargaining Power
Corporate and middle-market clients
Corporate and middle-market clients frequently multi-bank and run RFPs, intensifying price and term competition; Comerica reported about $39.3 billion in commercial loans in 2024, underscoring the scale at stake. These clients remain rate-sensitive on loans and deposits and demand integrated treasury solutions. Bundling and superior service can blunt customer power, but large clients retain strong negotiating leverage. Credit appetite cycles in 2024 shifted bargaining dynamics as underwriting tightened.
Retail customers with digital options
Retail customers can instantly compare Comerica rates and fees using digital tools, and with over 200 million U.S. mobile banking users in 2024, transparency and customer bargaining power have risen sharply. Account portability via ACH, Zelle and fintech front-ends lowers switching friction, while convenient branches and strong digital UX boost loyalty. Rate chasers still move quickly, but targeted rewards and personalized advice can materially reduce churn.
Wealth and institutional clients
Wealth and institutional Comerica clients with high balances exert strong bargaining power, negotiating fees, mandates, and investment spreads. Passive products now account for roughly half of US mutual fund and ETF assets, and rising robo adoption compresses fees and strengthens buyer leverage. Performance, platform breadth, and fiduciary capabilities remain key differentiators, while bespoke planning and trust services allow Comerica to justify premium pricing.
Treasury management users
Treasury management users exert moderate-high bargaining power: integrations make Comerica sticky, yet 2024 AFP survey shows 76% of corporates standardize requirements and run RFPs, forcing price competition. Demand for APIs/interoperability raises expectations for customization without premiums; cross-sell depth and strong fraud controls (top renewal driver) offset discounting.
- Integrations = stickiness
- 76% RFP/standardization (2024 AFP)
- APIs = expectation, no premium
- Cross-sell offsets discounts
- Fraud controls drive renewals
Geographic concentration effects
Comerica’s concentration in five core states — Texas, Michigan, California, Arizona and Florida — exposes it to localized competition and client bargaining dynamics; in hot metros rival banks often push pricing by tens of basis points to win marquee clients. Regional economic shifts (energy and auto cycles in TX and MI) can quickly alter client leverage on pricing and covenants. Diversifying across sectors and metros reduces this geographic bargaining risk.
- Core states: 5
- Competition impact: tens of bps on pricing
- Regional swings can shift leverage by 50–200 bps
- Mitigation: sector and metro diversification
Corporate clients wield high leverage: $39.3B loans; ~200M mobile users drive switches
Corporate, middle-market and treasury clients exert high bargaining power via multi-bank RFPs and rate sensitivity; Comerica held about $39.3B in commercial loans in 2024. Retail customers gain transparency from ~200M US mobile banking users (2024), raising switching risk. Wealth/institutional clients demand fee compression as passive products hit ~50% of US fund assets.
| Segment | Power | Key stats (2024) |
|---|---|---|
| Commercial | High | $39.3B loans |
| Retail | Moderate-High | ~200M mobile users |
| Wealth | High | Passive ≈50% assets |
| Treasury | Moderate-High | 76% RFP (AFP) |
What You See Is What You Get
Comerica Porter's Five Forces Analysis
This preview is the complete Comerica Porter's Five Forces Analysis and exactly matches the file you'll receive upon purchase. It includes the full assessment of competitive rivalry, buyer and supplier power, threats of entry and substitution, and strategic implications. No placeholders—download-ready and professionally formatted.
Original: $10.00
-65%$10.00
$3.50Description
Don't Miss the Bigger Picture
Comerica's Porter’s Five Forces snapshot highlights competitive intensity across regional banking—buyer bargaining, supplier and capital constraints, threats from fintech entrants, and substitute products shaping margins. This brief flags strategic risks and growth levers for management and investors. Unlock the full Porter’s Five Forces Analysis to explore Comerica’s competitive dynamics, market pressures, and strategic advantages in detail.
Suppliers Bargaining Power
Wholesale funding and capital markets
Comerica supplements deposits with FHLB lines, brokered CDs and capital‑markets funding, giving those suppliers pricing and covenant leverage; with the fed funds target at 5.25–5.50% in 2024, spreads and issuance costs rose. During tight liquidity windows spreads widen and terms toughen, lifting cost of funds and pressuring margins. Diversifying maturities and holding strong ratings mitigates reliance, but supplier power spikes in stress periods. Liquidity regulation (e.g., GSIB/LCR focus) further elevates these counterparties’ importance.
Core technology and fintech vendors
Core banking vendors for regional banks like Comerica (FIS, Fiserv, Jack Henry) plus concentrated cloud providers (AWS 32%, Azure 23%, GCP 10% in 2024) and dominant card networks (Visa+Mastercard ~80% of card volume) raise switching costs via contract lock-ins, integration complexity, and compliance burdens. Vendors can affect roadmaps, pricing, and SLAs. Co-development and multi-vendor architectures lower single-vendor dependence.
Depositors as suppliers of funding
Households and small businesses supply Comerica with low-cost, fragmented deposits, limiting individual bargaining power, while large corporate and municipal depositors can negotiate preferential rates and services. Rate competition sharpened in 2023–2024 as the federal funds rate rose to 5.25–5.50%, shifting leverage toward depositors. Relationship banking and cash-management offerings help Comerica retain balances and mitigate outflows.
Specialized talent and compliance expertise
Skilled relationship managers and scarce risk, cyber, and regulatory professionals push wage pressure higher; US unemployment averaged about 3.7% in 2024, tightening labor supply and elevating supplier power for talent. Rising compliance demands and tighter labor markets increase hiring costs and attrition risk, which can degrade service quality and constrain growth. Training pipelines and retention incentives partially mitigate scarcity but raise operating expense.
- Talent scarcity: higher hiring costs and wage inflation
- Attrition risk: service quality and growth impact
- Compliance load: increases demand for specialists
- Mitigants: training pipelines and retention incentives
Payment networks and custodial services
Card networks, ACH and real-time rails and custodians are essential infrastructure with few substitutes: Visa and Mastercard account for over 80% of U.S. card volume, FedNow went live in 2023 and top custodians hold tens of trillions in assets under custody. Fee schedules and rule changes materially affect Comerica’s economics and product design. Network access rules force ongoing compliance and tech investment, while scale-based pricing favors the largest banks and pressures midsize peers.
- Market concentration: Visa/Mastercard >80% share
- Real-time rails: FedNow live 2023
- Custody scale: top custodians hold tens of trillions
- Impact: fee/rule shifts alter margins; scale pricing disadvantages midsize banks
Regional bank faces rising supplier power, higher funding costs and concentrated tech leverage
Comerica faces elevated supplier power: wholesale funding (FHLB, brokered CDs) tightened as fed funds hit 5.25–5.50% in 2024, lifting cost of funds and covenant leverage; vendor lock‑ins (FIS/Fiserv/Jack Henry) and concentrated cloud (AWS 32%, Azure 23%, GCP 10% 2024) raise switching costs. Large depositors and card networks (Visa+Mastercard ≈80%) extract pricing concessions; talent scarcity (US unemployment ~3.7% 2024) raises wage pressure.
| Metric | 2024 |
|---|---|
| Fed funds | 5.25–5.50% |
| AWS market share | 32% |
| Visa+MC share | ≈80% |
| Unemployment | ~3.7% |
What is included in the product
Detailed Word Document
Tailored Porter’s Five Forces analysis for Comerica that uncovers key competitive drivers, customer and supplier influence, entry barriers, substitutes and disruptive threats, with strategic commentary and editable output for investor reports, internal strategy decks, or academic use.
Customizable Excel Spreadsheet
A concise Comerica Porter's Five Forces one-sheet that visualizes competitive pressure with an editable spider chart, ready to drop into pitch decks or boardroom slides—no macros or complex code, easily swap in your own data and scenarios for rapid, actionable strategy decisions.
Customers Bargaining Power
Corporate and middle-market clients
Corporate and middle-market clients frequently multi-bank and run RFPs, intensifying price and term competition; Comerica reported about $39.3 billion in commercial loans in 2024, underscoring the scale at stake. These clients remain rate-sensitive on loans and deposits and demand integrated treasury solutions. Bundling and superior service can blunt customer power, but large clients retain strong negotiating leverage. Credit appetite cycles in 2024 shifted bargaining dynamics as underwriting tightened.
Retail customers with digital options
Retail customers can instantly compare Comerica rates and fees using digital tools, and with over 200 million U.S. mobile banking users in 2024, transparency and customer bargaining power have risen sharply. Account portability via ACH, Zelle and fintech front-ends lowers switching friction, while convenient branches and strong digital UX boost loyalty. Rate chasers still move quickly, but targeted rewards and personalized advice can materially reduce churn.
Wealth and institutional clients
Wealth and institutional Comerica clients with high balances exert strong bargaining power, negotiating fees, mandates, and investment spreads. Passive products now account for roughly half of US mutual fund and ETF assets, and rising robo adoption compresses fees and strengthens buyer leverage. Performance, platform breadth, and fiduciary capabilities remain key differentiators, while bespoke planning and trust services allow Comerica to justify premium pricing.
Treasury management users
Treasury management users exert moderate-high bargaining power: integrations make Comerica sticky, yet 2024 AFP survey shows 76% of corporates standardize requirements and run RFPs, forcing price competition. Demand for APIs/interoperability raises expectations for customization without premiums; cross-sell depth and strong fraud controls (top renewal driver) offset discounting.
- Integrations = stickiness
- 76% RFP/standardization (2024 AFP)
- APIs = expectation, no premium
- Cross-sell offsets discounts
- Fraud controls drive renewals
Geographic concentration effects
Comerica’s concentration in five core states — Texas, Michigan, California, Arizona and Florida — exposes it to localized competition and client bargaining dynamics; in hot metros rival banks often push pricing by tens of basis points to win marquee clients. Regional economic shifts (energy and auto cycles in TX and MI) can quickly alter client leverage on pricing and covenants. Diversifying across sectors and metros reduces this geographic bargaining risk.
- Core states: 5
- Competition impact: tens of bps on pricing
- Regional swings can shift leverage by 50–200 bps
- Mitigation: sector and metro diversification
Corporate clients wield high leverage: $39.3B loans; ~200M mobile users drive switches
Corporate, middle-market and treasury clients exert high bargaining power via multi-bank RFPs and rate sensitivity; Comerica held about $39.3B in commercial loans in 2024. Retail customers gain transparency from ~200M US mobile banking users (2024), raising switching risk. Wealth/institutional clients demand fee compression as passive products hit ~50% of US fund assets.
| Segment | Power | Key stats (2024) |
|---|---|---|
| Commercial | High | $39.3B loans |
| Retail | Moderate-High | ~200M mobile users |
| Wealth | High | Passive ≈50% assets |
| Treasury | Moderate-High | 76% RFP (AFP) |
What You See Is What You Get
Comerica Porter's Five Forces Analysis
This preview is the complete Comerica Porter's Five Forces Analysis and exactly matches the file you'll receive upon purchase. It includes the full assessment of competitive rivalry, buyer and supplier power, threats of entry and substitution, and strategic implications. No placeholders—download-ready and professionally formatted.











