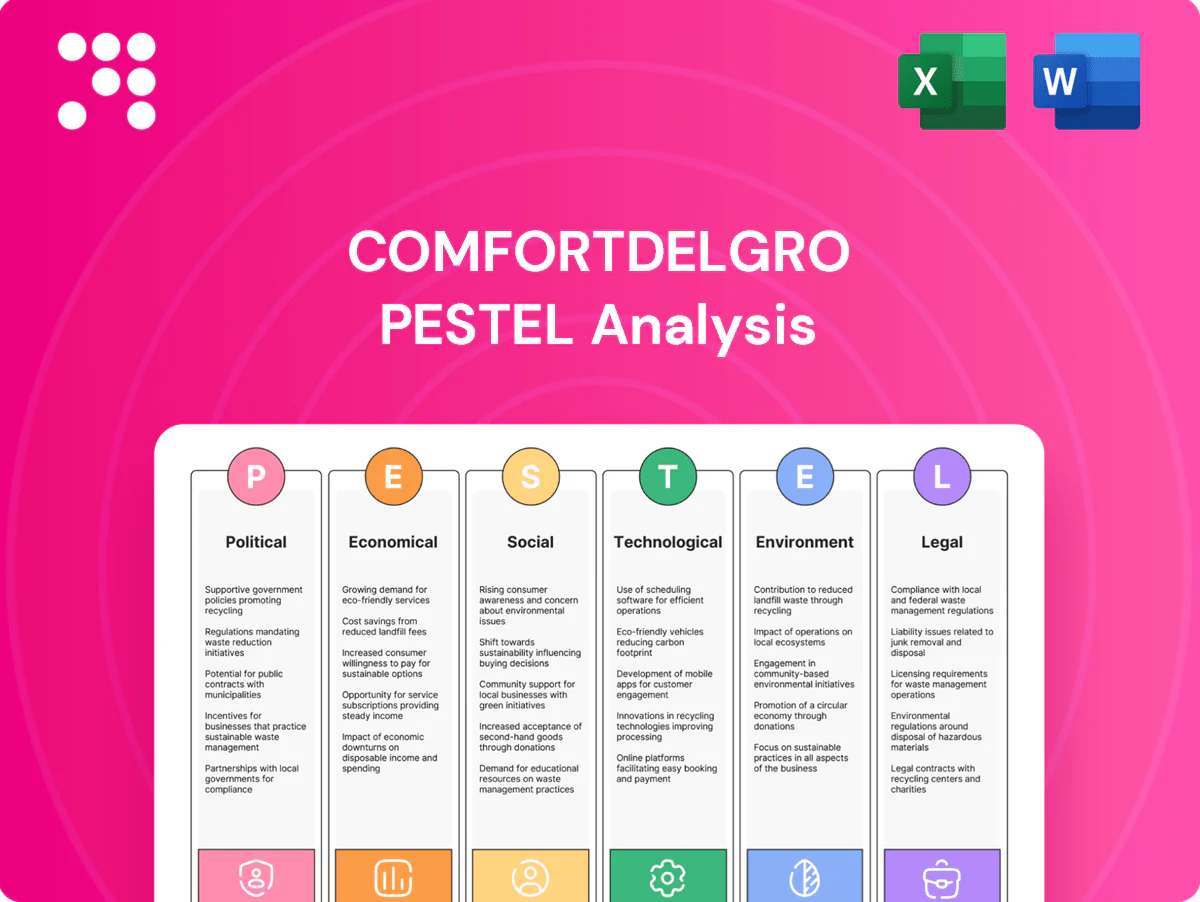
ComfortDelGro PESTLE Analysis

Plan Smarter. Present Sharper. Compete Stronger.
Our PESTLE analysis for ComfortDelGro reveals how regulatory shifts, urban mobility trends, and tech adoption will shape ridership, margins, and expansion opportunities; it highlights strategic risks and growth levers for investors and managers. Purchase the full report to access the complete, actionable breakdown and ready-to-use insights.
Political factors

Public transport policy and subsidies
Government priorities in mass transit, exemplified by Singapore's Bus Contracting Model since 2016, shape route allocation, service levels and funding, directly influencing ComfortDelGro's contracts. Shifts toward modal split and first/last-mile integration force changes to fleet and capex plans. Stability of transport grants and fare support affects profitability and reinvestment. Operating across seven countries (Singapore, UK, Australia, China, Malaysia, Ireland, Vietnam) raises coordination complexity.
Regulatory oversight and fare controls
Regulated fares for buses, rail and taxis constrain ComfortDelGro’s pricing power but can stabilize demand across its network, which spans 10 countries. Periodic (typically annual) fare reviews often lag cost inflation, squeezing margins when fuel or wage costs rise. Transparent regulatory relationships help align service quality with allowable returns and reduce tariff disputes. Divergent regimes across markets force tailored compliance and active stakeholder management.

Urban mobility and congestion initiatives
Policies like congestion pricing and low-emission zones have driven modal shifts of roughly 10–25% in major cities; Stockholm reported about a 20% traffic reduction after its congestion tax. Route-priority measures such as bus lanes can improve punctuality and asset utilization by up to 30%. Compliance with urban access rules often forces fleet upgrades, potentially impacting 10–25% of fleet value, while political appetite varies by city and election cycle.

Geopolitical and cross-border operations
Operating in 10 countries exposes ComfortDelGro to policy volatility, trade frictions and currency controls; its fleet of ~39,000 vehicles increases exposure through cross-border procurement and parts sourcing. Tender outcomes face local-content and national-interest hurdles, and diplomatic tensions can disrupt vehicle/parts supply chains. Diversification lowers single-market policy risk but raises governance complexity.
- 10 countries
- ~39,000 vehicles
- Local-content risks
- Supply-chain vulnerability
Public-private partnership dynamics
ComfortDelGro, a SGX-listed land-transport group operating in 10 countries, wins many contracts via competitive tenders under frameworks like Singapore’s Bus Contracting Model (introduced 2016) where payments are performance-linked; changes to PPP/BCM rules shift ridership, capex and maintenance risk to operators and can compress margins. Political pushes for affordability and coverage often add obligations without matching revenue, while proven service records improve bid success and renewals.
- BCM 2016: performance-linked gross-cost tenders
- Operations: 10 countries, SGX-listed
- Risk shift: ridership/capex/maintenance impacts margins
Policy shifts and congestion pricing force fleet upgrades, higher maintenance across 10 countries
Government transport priorities (eg BCM 2016) and regulated fares limit pricing power yet secure route funding across ComfortDelGro’s 10-country network; policy shifts alter capex and service risk allocation. Congestion pricing and low-emission zones (modal shifts ~10–25%) force fleet upgrades and raise maintenance costs. Cross-border procurement and local-content rules strain supply chains for ~39,000 vehicles.
| Metric | Value |
|---|---|
| Markets | 10 countries |
| Fleet | ~39,000 vehicles |
| Policy model | BCM 2016 |
| Modal shift | 10–25% |
What is included in the product
 Detailed Word Document
Explores how macro-environmental forces uniquely shape ComfortDelGro across Political, Economic, Social, Technological, Environmental and Legal dimensions, with data-backed trends and region-specific regulatory context; designed for executives and investors to identify threats, opportunities and actionable, forward-looking scenarios for strategy and funding readiness.

 Customizable Excel Spreadsheet
A compact, visually segmented ComfortDelGro PESTLE summary that’s easily dropped into presentations or shared across teams, editable for regional or business-line notes and written in clear language to quickly support risk discussions and strategic planning.
Economic factors

Fuel and energy price volatility
Diesel, CNG and electricity prices directly drive ComfortDelGro's operating costs; global Brent averaged about $86/bbl in 2024, keeping diesel elevated. EV transition shifts exposure from liquid fuel to power tariffs and demand charges, with Singapore electricity tariffs near 30 Singapore cents/kWh in 2024. Hedging and procurement are critical to protect margins, as regulatory limits often constrain fare pass-through.
Inflation and wage pressures
Driver wages, maintenance and parts costs have risen with recent inflation and tight labor markets, pressuring ComfortDelGro’s margins; indexation clauses in public and corporate contracts partially offset these cost increases. Productivity improvements from smarter scheduling and telematics have helped defend margins by reducing empty miles and maintenance downtime. Prolonged wage inflation, however, can still compress returns on fixed-price tenders if not fully passed through.

Macroeconomic cycles and ridership
Economic growth boosts commuting, tourism and discretionary travel, supporting farebox and ancillary revenue; ComfortDelGro's diversified operations across Asia, Australia and the UK help capture this upside.
Downturns compress trips and corporate transport budgets, with premium taxi and private-hire services showing higher elasticity and deeper revenue declines than essential bus and rail.
Bus and rail ridership proved more resilient in 2023–24, with many urban markets returning to roughly 85–95% of 2019 levels, smoothing group cashflows across cycles.

Currency fluctuations
Currency fluctuations create translation and transaction risks for ComfortDelGro’s multi-country operations, where operating currencies weakening versus the Singapore dollar can dilute reported earnings; natural hedges from local financing and procurement in markets such as the UK and Australia help reduce net exposure. Active treasury management aligns cash inflows with liabilities and uses hedging instruments to manage short-term volatility.
- FX translation risk from multi-country revenues
- Transaction risk when operating currencies depreciate vs SGD
- Natural hedges via local financing and procurement
- Active treasury aligning cash flows and hedging
Capital intensity and cost of financing
Fleet renewal and depot upgrades demand substantial capital expenditure, increasing exposure to shifts in borrowing costs and investment hurdle rates for electrification projects.
Rising interest rates raise financing costs and required returns, while access to green financing and concessional loans can materially lower WACC and improve bid competitiveness in tender processes.
- Capex intensity: high
- Interest-rate sensitivity: significant
- Green financing: reduces WACC
- Tender success: linked to efficient financing
Policy shifts and congestion pricing force fleet upgrades, higher maintenance across 10 countries
Diesel/CNG/electricity costs drove margins in 2024 (Brent ~USD86/bbl; SG electricity ~S$0.30/kWh). Ridership recovered to ~85–95% of 2019 in key urban markets, cushioning revenues; wage and parts inflation plus higher policy rates (~4–5% in 2024) raise financing and tender costs. Green financing can cut WACC by ~50–150bps, aiding electrification capex.
| Metric | 2024 value | Impact |
|---|---|---|
| Brent | USD86/bbl | Higher fuel opex |
| SG electricity | S$0.30/kWh | EV operating cost |
| Ridership | 85–95% of 2019 | Stable farebox |
| Policy rates | ~4–5% | Higher debt cost |
Preview the Actual Deliverable
ComfortDelGro PESTLE Analysis
The preview shown here is the exact ComfortDelGro PESTLE Analysis you’ll receive after purchase—fully formatted and ready to use. This is the real, finished file with complete political, economic, social, technological, legal and environmental assessments. No placeholders, no surprises—download the same document shown here instantly after checkout.

Plan Smarter. Present Sharper. Compete Stronger.
Our PESTLE analysis for ComfortDelGro reveals how regulatory shifts, urban mobility trends, and tech adoption will shape ridership, margins, and expansion opportunities; it highlights strategic risks and growth levers for investors and managers. Purchase the full report to access the complete, actionable breakdown and ready-to-use insights.
Political factors
Public transport policy and subsidies
Government priorities in mass transit, exemplified by Singapore's Bus Contracting Model since 2016, shape route allocation, service levels and funding, directly influencing ComfortDelGro's contracts. Shifts toward modal split and first/last-mile integration force changes to fleet and capex plans. Stability of transport grants and fare support affects profitability and reinvestment. Operating across seven countries (Singapore, UK, Australia, China, Malaysia, Ireland, Vietnam) raises coordination complexity.
Regulatory oversight and fare controls
Regulated fares for buses, rail and taxis constrain ComfortDelGro’s pricing power but can stabilize demand across its network, which spans 10 countries. Periodic (typically annual) fare reviews often lag cost inflation, squeezing margins when fuel or wage costs rise. Transparent regulatory relationships help align service quality with allowable returns and reduce tariff disputes. Divergent regimes across markets force tailored compliance and active stakeholder management.
Urban mobility and congestion initiatives
Policies like congestion pricing and low-emission zones have driven modal shifts of roughly 10–25% in major cities; Stockholm reported about a 20% traffic reduction after its congestion tax. Route-priority measures such as bus lanes can improve punctuality and asset utilization by up to 30%. Compliance with urban access rules often forces fleet upgrades, potentially impacting 10–25% of fleet value, while political appetite varies by city and election cycle.
Geopolitical and cross-border operations
Operating in 10 countries exposes ComfortDelGro to policy volatility, trade frictions and currency controls; its fleet of ~39,000 vehicles increases exposure through cross-border procurement and parts sourcing. Tender outcomes face local-content and national-interest hurdles, and diplomatic tensions can disrupt vehicle/parts supply chains. Diversification lowers single-market policy risk but raises governance complexity.
- 10 countries
- ~39,000 vehicles
- Local-content risks
- Supply-chain vulnerability
Public-private partnership dynamics
ComfortDelGro, a SGX-listed land-transport group operating in 10 countries, wins many contracts via competitive tenders under frameworks like Singapore’s Bus Contracting Model (introduced 2016) where payments are performance-linked; changes to PPP/BCM rules shift ridership, capex and maintenance risk to operators and can compress margins. Political pushes for affordability and coverage often add obligations without matching revenue, while proven service records improve bid success and renewals.
- BCM 2016: performance-linked gross-cost tenders
- Operations: 10 countries, SGX-listed
- Risk shift: ridership/capex/maintenance impacts margins
Policy shifts and congestion pricing force fleet upgrades, higher maintenance across 10 countries
Government transport priorities (eg BCM 2016) and regulated fares limit pricing power yet secure route funding across ComfortDelGro’s 10-country network; policy shifts alter capex and service risk allocation. Congestion pricing and low-emission zones (modal shifts ~10–25%) force fleet upgrades and raise maintenance costs. Cross-border procurement and local-content rules strain supply chains for ~39,000 vehicles.
| Metric | Value |
|---|---|
| Markets | 10 countries |
| Fleet | ~39,000 vehicles |
| Policy model | BCM 2016 |
| Modal shift | 10–25% |
What is included in the product
Detailed Word Document
Explores how macro-environmental forces uniquely shape ComfortDelGro across Political, Economic, Social, Technological, Environmental and Legal dimensions, with data-backed trends and region-specific regulatory context; designed for executives and investors to identify threats, opportunities and actionable, forward-looking scenarios for strategy and funding readiness.
Customizable Excel Spreadsheet
A compact, visually segmented ComfortDelGro PESTLE summary that’s easily dropped into presentations or shared across teams, editable for regional or business-line notes and written in clear language to quickly support risk discussions and strategic planning.
Economic factors
Fuel and energy price volatility
Diesel, CNG and electricity prices directly drive ComfortDelGro's operating costs; global Brent averaged about $86/bbl in 2024, keeping diesel elevated. EV transition shifts exposure from liquid fuel to power tariffs and demand charges, with Singapore electricity tariffs near 30 Singapore cents/kWh in 2024. Hedging and procurement are critical to protect margins, as regulatory limits often constrain fare pass-through.
Inflation and wage pressures
Driver wages, maintenance and parts costs have risen with recent inflation and tight labor markets, pressuring ComfortDelGro’s margins; indexation clauses in public and corporate contracts partially offset these cost increases. Productivity improvements from smarter scheduling and telematics have helped defend margins by reducing empty miles and maintenance downtime. Prolonged wage inflation, however, can still compress returns on fixed-price tenders if not fully passed through.
Macroeconomic cycles and ridership
Economic growth boosts commuting, tourism and discretionary travel, supporting farebox and ancillary revenue; ComfortDelGro's diversified operations across Asia, Australia and the UK help capture this upside.
Downturns compress trips and corporate transport budgets, with premium taxi and private-hire services showing higher elasticity and deeper revenue declines than essential bus and rail.
Bus and rail ridership proved more resilient in 2023–24, with many urban markets returning to roughly 85–95% of 2019 levels, smoothing group cashflows across cycles.
Currency fluctuations
Currency fluctuations create translation and transaction risks for ComfortDelGro’s multi-country operations, where operating currencies weakening versus the Singapore dollar can dilute reported earnings; natural hedges from local financing and procurement in markets such as the UK and Australia help reduce net exposure. Active treasury management aligns cash inflows with liabilities and uses hedging instruments to manage short-term volatility.
- FX translation risk from multi-country revenues
- Transaction risk when operating currencies depreciate vs SGD
- Natural hedges via local financing and procurement
- Active treasury aligning cash flows and hedging
Capital intensity and cost of financing
Fleet renewal and depot upgrades demand substantial capital expenditure, increasing exposure to shifts in borrowing costs and investment hurdle rates for electrification projects.
Rising interest rates raise financing costs and required returns, while access to green financing and concessional loans can materially lower WACC and improve bid competitiveness in tender processes.
- Capex intensity: high
- Interest-rate sensitivity: significant
- Green financing: reduces WACC
- Tender success: linked to efficient financing
Policy shifts and congestion pricing force fleet upgrades, higher maintenance across 10 countries
Diesel/CNG/electricity costs drove margins in 2024 (Brent ~USD86/bbl; SG electricity ~S$0.30/kWh). Ridership recovered to ~85–95% of 2019 in key urban markets, cushioning revenues; wage and parts inflation plus higher policy rates (~4–5% in 2024) raise financing and tender costs. Green financing can cut WACC by ~50–150bps, aiding electrification capex.
| Metric | 2024 value | Impact |
|---|---|---|
| Brent | USD86/bbl | Higher fuel opex |
| SG electricity | S$0.30/kWh | EV operating cost |
| Ridership | 85–95% of 2019 | Stable farebox |
| Policy rates | ~4–5% | Higher debt cost |
Preview the Actual Deliverable
ComfortDelGro PESTLE Analysis
The preview shown here is the exact ComfortDelGro PESTLE Analysis you’ll receive after purchase—fully formatted and ready to use. This is the real, finished file with complete political, economic, social, technological, legal and environmental assessments. No placeholders, no surprises—download the same document shown here instantly after checkout.
Original: $10.00
-65%$10.00
$3.50Description
Plan Smarter. Present Sharper. Compete Stronger.
Our PESTLE analysis for ComfortDelGro reveals how regulatory shifts, urban mobility trends, and tech adoption will shape ridership, margins, and expansion opportunities; it highlights strategic risks and growth levers for investors and managers. Purchase the full report to access the complete, actionable breakdown and ready-to-use insights.
Political factors
Public transport policy and subsidies
Government priorities in mass transit, exemplified by Singapore's Bus Contracting Model since 2016, shape route allocation, service levels and funding, directly influencing ComfortDelGro's contracts. Shifts toward modal split and first/last-mile integration force changes to fleet and capex plans. Stability of transport grants and fare support affects profitability and reinvestment. Operating across seven countries (Singapore, UK, Australia, China, Malaysia, Ireland, Vietnam) raises coordination complexity.
Regulatory oversight and fare controls
Regulated fares for buses, rail and taxis constrain ComfortDelGro’s pricing power but can stabilize demand across its network, which spans 10 countries. Periodic (typically annual) fare reviews often lag cost inflation, squeezing margins when fuel or wage costs rise. Transparent regulatory relationships help align service quality with allowable returns and reduce tariff disputes. Divergent regimes across markets force tailored compliance and active stakeholder management.
Urban mobility and congestion initiatives
Policies like congestion pricing and low-emission zones have driven modal shifts of roughly 10–25% in major cities; Stockholm reported about a 20% traffic reduction after its congestion tax. Route-priority measures such as bus lanes can improve punctuality and asset utilization by up to 30%. Compliance with urban access rules often forces fleet upgrades, potentially impacting 10–25% of fleet value, while political appetite varies by city and election cycle.
Geopolitical and cross-border operations
Operating in 10 countries exposes ComfortDelGro to policy volatility, trade frictions and currency controls; its fleet of ~39,000 vehicles increases exposure through cross-border procurement and parts sourcing. Tender outcomes face local-content and national-interest hurdles, and diplomatic tensions can disrupt vehicle/parts supply chains. Diversification lowers single-market policy risk but raises governance complexity.
- 10 countries
- ~39,000 vehicles
- Local-content risks
- Supply-chain vulnerability
Public-private partnership dynamics
ComfortDelGro, a SGX-listed land-transport group operating in 10 countries, wins many contracts via competitive tenders under frameworks like Singapore’s Bus Contracting Model (introduced 2016) where payments are performance-linked; changes to PPP/BCM rules shift ridership, capex and maintenance risk to operators and can compress margins. Political pushes for affordability and coverage often add obligations without matching revenue, while proven service records improve bid success and renewals.
- BCM 2016: performance-linked gross-cost tenders
- Operations: 10 countries, SGX-listed
- Risk shift: ridership/capex/maintenance impacts margins
Policy shifts and congestion pricing force fleet upgrades, higher maintenance across 10 countries
Government transport priorities (eg BCM 2016) and regulated fares limit pricing power yet secure route funding across ComfortDelGro’s 10-country network; policy shifts alter capex and service risk allocation. Congestion pricing and low-emission zones (modal shifts ~10–25%) force fleet upgrades and raise maintenance costs. Cross-border procurement and local-content rules strain supply chains for ~39,000 vehicles.
| Metric | Value |
|---|---|
| Markets | 10 countries |
| Fleet | ~39,000 vehicles |
| Policy model | BCM 2016 |
| Modal shift | 10–25% |
What is included in the product
Detailed Word Document
Explores how macro-environmental forces uniquely shape ComfortDelGro across Political, Economic, Social, Technological, Environmental and Legal dimensions, with data-backed trends and region-specific regulatory context; designed for executives and investors to identify threats, opportunities and actionable, forward-looking scenarios for strategy and funding readiness.
Customizable Excel Spreadsheet
A compact, visually segmented ComfortDelGro PESTLE summary that’s easily dropped into presentations or shared across teams, editable for regional or business-line notes and written in clear language to quickly support risk discussions and strategic planning.
Economic factors
Fuel and energy price volatility
Diesel, CNG and electricity prices directly drive ComfortDelGro's operating costs; global Brent averaged about $86/bbl in 2024, keeping diesel elevated. EV transition shifts exposure from liquid fuel to power tariffs and demand charges, with Singapore electricity tariffs near 30 Singapore cents/kWh in 2024. Hedging and procurement are critical to protect margins, as regulatory limits often constrain fare pass-through.
Inflation and wage pressures
Driver wages, maintenance and parts costs have risen with recent inflation and tight labor markets, pressuring ComfortDelGro’s margins; indexation clauses in public and corporate contracts partially offset these cost increases. Productivity improvements from smarter scheduling and telematics have helped defend margins by reducing empty miles and maintenance downtime. Prolonged wage inflation, however, can still compress returns on fixed-price tenders if not fully passed through.
Macroeconomic cycles and ridership
Economic growth boosts commuting, tourism and discretionary travel, supporting farebox and ancillary revenue; ComfortDelGro's diversified operations across Asia, Australia and the UK help capture this upside.
Downturns compress trips and corporate transport budgets, with premium taxi and private-hire services showing higher elasticity and deeper revenue declines than essential bus and rail.
Bus and rail ridership proved more resilient in 2023–24, with many urban markets returning to roughly 85–95% of 2019 levels, smoothing group cashflows across cycles.
Currency fluctuations
Currency fluctuations create translation and transaction risks for ComfortDelGro’s multi-country operations, where operating currencies weakening versus the Singapore dollar can dilute reported earnings; natural hedges from local financing and procurement in markets such as the UK and Australia help reduce net exposure. Active treasury management aligns cash inflows with liabilities and uses hedging instruments to manage short-term volatility.
- FX translation risk from multi-country revenues
- Transaction risk when operating currencies depreciate vs SGD
- Natural hedges via local financing and procurement
- Active treasury aligning cash flows and hedging
Capital intensity and cost of financing
Fleet renewal and depot upgrades demand substantial capital expenditure, increasing exposure to shifts in borrowing costs and investment hurdle rates for electrification projects.
Rising interest rates raise financing costs and required returns, while access to green financing and concessional loans can materially lower WACC and improve bid competitiveness in tender processes.
- Capex intensity: high
- Interest-rate sensitivity: significant
- Green financing: reduces WACC
- Tender success: linked to efficient financing
Policy shifts and congestion pricing force fleet upgrades, higher maintenance across 10 countries
Diesel/CNG/electricity costs drove margins in 2024 (Brent ~USD86/bbl; SG electricity ~S$0.30/kWh). Ridership recovered to ~85–95% of 2019 in key urban markets, cushioning revenues; wage and parts inflation plus higher policy rates (~4–5% in 2024) raise financing and tender costs. Green financing can cut WACC by ~50–150bps, aiding electrification capex.
| Metric | 2024 value | Impact |
|---|---|---|
| Brent | USD86/bbl | Higher fuel opex |
| SG electricity | S$0.30/kWh | EV operating cost |
| Ridership | 85–95% of 2019 | Stable farebox |
| Policy rates | ~4–5% | Higher debt cost |
Preview the Actual Deliverable
ComfortDelGro PESTLE Analysis
The preview shown here is the exact ComfortDelGro PESTLE Analysis you’ll receive after purchase—fully formatted and ready to use. This is the real, finished file with complete political, economic, social, technological, legal and environmental assessments. No placeholders, no surprises—download the same document shown here instantly after checkout.











