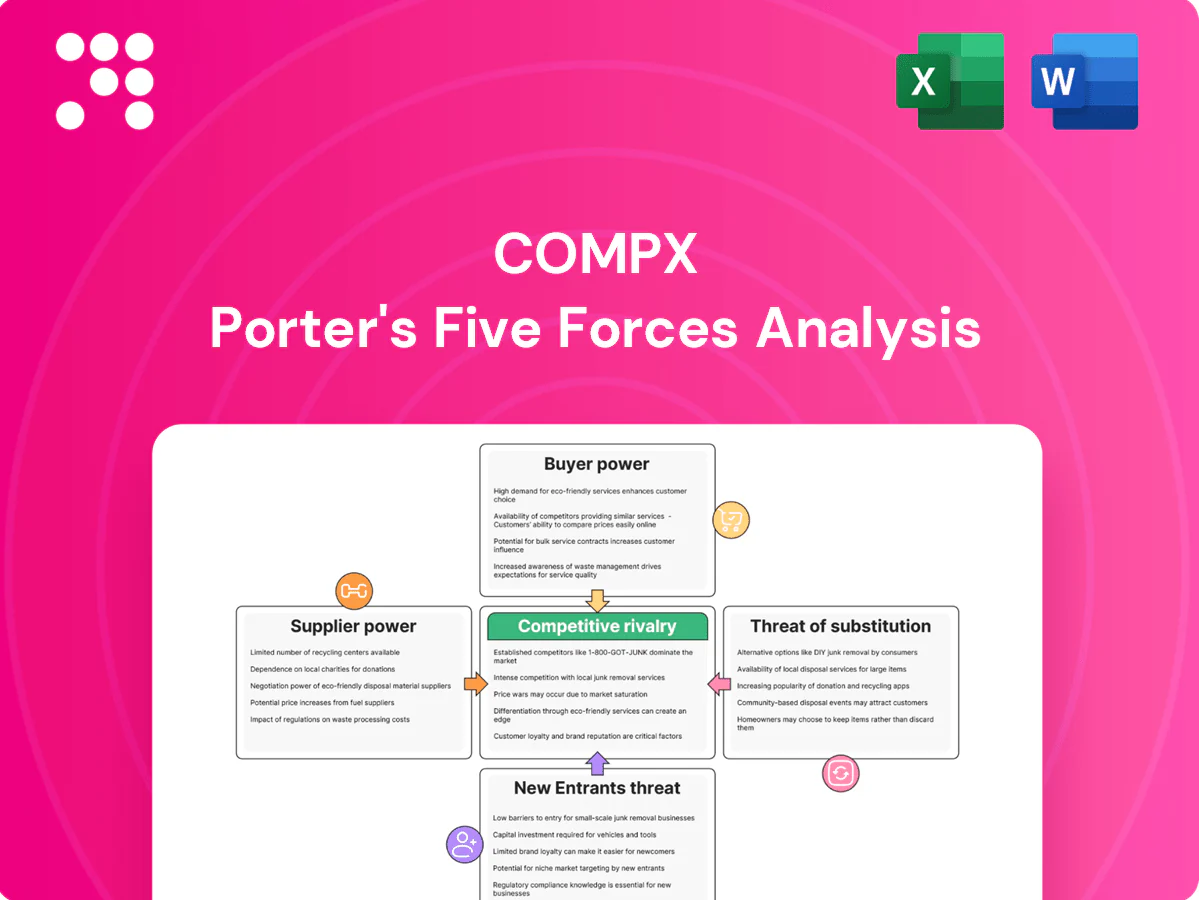
CompX Porter's Five Forces Analysis

Go Beyond the Preview—Access the Full Strategic Report
CompX’s Porter's Five Forces snapshot highlights supplier leverage, buyer power, rivalry intensity, substitute threats, and barriers to entry—each shaping profitability and strategic choices. Our concise assessment pinpoints where CompX can defend margins or exploit weaknesses. This preview only scratches the surface. Unlock the full Porter's Five Forces Analysis to explore CompX’s competitive dynamics, market pressures, and strategic advantages in detail.
Suppliers Bargaining Power

Specialized metals and electronics
CompX depends on brass, stainless, zinc die castings and electronic components for locks and marine controls, with materials and PCBs often representing up to 40% of BOM value. Suppliers with niche alloys, precision machining or PCB capability therefore command pricing and delivery influence. Qualification cycles commonly exceed 12 months, giving approved vendors leverage. Geographic clustering of capabilities further limits alternative sourcing and increases switching costs.
Tooling-driven switching costs
Custom dies, molds and key-code systems lock CompX production to specific suppliers, with tooling lifespans commonly 5–15 years and replacement lead times often 6–12 months. Switching requires new tooling, validation and OEM requalification, driving one-off costs and revenue downtime that materially raise time-to-switch. These factors increase supplier leverage and embed vendor relationships over multi-year cycles.

Dual-sourcing mitigations
Dual-sourcing for standard fasteners, wiring and other commoditized inputs reduces dependency on single suppliers and, paired with approved vendor lists and modular designs that permit substitution within tolerances, materially balances bargaining power versus specialized vendors; maintaining strategic buffer stocks—commonly 2–6 weeks of supply—further dampens disruption risk and smooths production continuity.

Commodity price volatility
Metals and resins exhibit pronounced commodity volatility—copper averaged near US$9,500/tonne in 2024 while resin spot prices hovered around US$1,200/tonne, and tariffs of 5–25% on select inputs amplified swings; limited pass-through clauses compress margins and raise supplier leverage.
Active hedging and should-cost modelling have cut realized input volatility for some OEMs by roughly half, while longer-term contracts stabilize costs at the expense of procurement flexibility.
- Input share: 15–40% of BOM
- Tariff range: 5–25%
- Hedging impact: ~50% volatility reduction
- Trade-off: stability vs flexibility
Regulatory and geo-risk
RoHS/REACH now list over 200 SVHCs (≈233 in 2024), while conflict minerals rules (3TG under Dodd-Frank) and evolving trade policy constrain sourcing and raise compliance costs; supplier concentration in key regions (e.g., advanced electronics nodes) elevates logistics and geopolitical risk, and compliance documentation gives qualified suppliers pricing leverage, though localizing critical inputs can reduce exposure over time.
- REACH: ≈233 SVHCs (2024)
- Conflict minerals: 3TG compliance required
- Supplier concentration ↑ geopolitical/logistics risk
- Compliance docs = supplier bargaining power
- Localization offsets risk long-term
Supplier leverage: inputs 15-40% BOM, tooling 6-12m; hedging cut volatility ~50%
Suppliers of brass, stainless, zinc die castings and PCBs exert high leverage (inputs 15–40% of BOM) due to long qualification (≥12 months), tooling lead times 6–12 months and niche capabilities; commodity swings (copper ≈US$9,500/t, resins ≈US$1,200/t in 2024) and tariffs (5–25%) compress pass-through and raise supplier power. Dual-sourcing and 2–6 week buffers mitigate risk; hedging cut realized input volatility ~50% for peers in 2024.
| Metric | Value (2024) |
|---|---|
| Input share of BOM | 15–40% |
| Copper | ≈US$9,500/tonne |
| Resin spot | ≈US$1,200/tonne |
| Tariff range | 5–25% |
| SVHC listed | ≈233 |
| Hedging effect | ~50% volatility reduction |
| Tooling lead | 6–12 months |
What is included in the product
 Detailed Word Document
Comprehensive Porter's Five Forces analysis tailored to CompX, uncovering competitive intensity, buyer and supplier power, threat of entrants and substitutes, and identifying disruptive forces and strategic levers; delivered in editable Word format for use in investor materials, strategy decks, or academic projects.

 Customizable Excel Spreadsheet
A concise, one-sheet CompX Porter's Five Forces summary that lets teams quickly gauge competitive pressure, customize force levels for evolving data, and drop clean radar visuals into decks—no macros or finance expertise required.
Customers Bargaining Power

OEM concentration
OEM concentration gives customers strong leverage: major marine builders and cabinet OEMs buy at scale and extract volume rebates, annual pricing clauses and design-in influence, with top OEMs like Brunswick reporting roughly $6.9 billion in 2024 revenue, underscoring their purchasing scale.
Losing a platform spec can cost CompX millions in annual revenue; customer retention thus depends on consistent product performance and strict service SLAs, driving negotiation power toward large OEMs.
Spec-in switching costs
Cutouts, keying systems and helm interfaces create technical lock-in at the spec-in level, so changing suppliers triggers redesign, integration testing and field-support requalification. Those process hurdles substantially raise time and cost barriers and reduce buyer bargaining power for entrenched programs. Multi-year platforms with lifecycles often measured in 5–30 years further entrench incumbents.

Price-sensitive RFP cycles
For standardized locks, gauges and hardware buyers run competitive bids and typically short-list 3–4 suppliers, driving aggressive price-sensitive RFP cycles. Transparent benchmarking and import alternatives amplify price pressure, with cross-border sourcing from low-cost regions intensifying competition. Value-add engineering, documented reliability data and warranty metrics are key levers to defend premium pricing. Framing purchases around total cost of ownership shifts focus beyond unit price and influences 2024 procurement decisions.

Aftermarket fragmentation
Aftermarket fragmentation means dealers and end-users purchase spares and upgrades in smaller lots, which dilutes their bargaining leverage against CompX; strong OEM branding and certified compatibility sustain pricing power and margin retention. Distribution partnerships and selective channel agreements concentrate influence among preferred resellers, shaping where negotiating pressure can emerge.
- Fragmented orders reduce buyer leverage
- Branding preserves price premiums
- Compatibility requirements lock demand
- Distribution partnerships centralize channel power
Demand cyclicality
Demand cyclicality: housing, office capex, and pleasure‑craft cycles drive order volatility; U.S. housing starts of ~1.4M units in 2024 and a rebound in recreational marine sales (+12% in 2024) tightened pricing leverage. In downturns buyers press for concessions and extended terms, though multi‑market backlogs (Q4 2024 backlog up ~8% y/y) cushion revenue swings. Strict lead‑time discipline prevents last‑minute price squeezes.
- Housing starts ~1.4M (2024)
- Pleasure‑craft sales +12% (2024)
- Backlog +8% y/y (Q4 2024)
- Lead‑time discipline reduces price pressure
Top OEM (~$6.9B) wield price/spec leverage; housing 1.4M, marine +12%
Large OEMs (eg Brunswick ~$6.9B revenue in 2024) exert strong price and spec leverage; losing a platform costs CompX millions. Technical lock‑in (cutouts, keying, helm interfaces) raises switching costs, while standardized hardware faces aggressive 3–4 vendor RFPs and import price pressure. Aftermarket fragmentation limits buyer power; housing (~1.4M starts) and marine (+12% 2024) cycles drive negotiation swings.
| Metric | 2024 |
|---|---|
| Top OEM revenue (Brunswick) | $6.9B |
| US housing starts | ~1.4M |
| Pleasure‑craft sales | +12% |
| Backlog (Q4 y/y) | +8% |
Full Version Awaits
CompX Porter's Five Forces Analysis
This preview shows the exact CompX Porter's Five Forces Analysis you'll receive immediately after purchase—no surprises or placeholders. The document displayed is fully formatted and ready for download the moment you buy. You're viewing the final version; instant access to this identical file follows payment.

Go Beyond the Preview—Access the Full Strategic Report
CompX’s Porter's Five Forces snapshot highlights supplier leverage, buyer power, rivalry intensity, substitute threats, and barriers to entry—each shaping profitability and strategic choices. Our concise assessment pinpoints where CompX can defend margins or exploit weaknesses. This preview only scratches the surface. Unlock the full Porter's Five Forces Analysis to explore CompX’s competitive dynamics, market pressures, and strategic advantages in detail.
Suppliers Bargaining Power
Specialized metals and electronics
CompX depends on brass, stainless, zinc die castings and electronic components for locks and marine controls, with materials and PCBs often representing up to 40% of BOM value. Suppliers with niche alloys, precision machining or PCB capability therefore command pricing and delivery influence. Qualification cycles commonly exceed 12 months, giving approved vendors leverage. Geographic clustering of capabilities further limits alternative sourcing and increases switching costs.
Tooling-driven switching costs
Custom dies, molds and key-code systems lock CompX production to specific suppliers, with tooling lifespans commonly 5–15 years and replacement lead times often 6–12 months. Switching requires new tooling, validation and OEM requalification, driving one-off costs and revenue downtime that materially raise time-to-switch. These factors increase supplier leverage and embed vendor relationships over multi-year cycles.
Dual-sourcing mitigations
Dual-sourcing for standard fasteners, wiring and other commoditized inputs reduces dependency on single suppliers and, paired with approved vendor lists and modular designs that permit substitution within tolerances, materially balances bargaining power versus specialized vendors; maintaining strategic buffer stocks—commonly 2–6 weeks of supply—further dampens disruption risk and smooths production continuity.
Commodity price volatility
Metals and resins exhibit pronounced commodity volatility—copper averaged near US$9,500/tonne in 2024 while resin spot prices hovered around US$1,200/tonne, and tariffs of 5–25% on select inputs amplified swings; limited pass-through clauses compress margins and raise supplier leverage.
Active hedging and should-cost modelling have cut realized input volatility for some OEMs by roughly half, while longer-term contracts stabilize costs at the expense of procurement flexibility.
- Input share: 15–40% of BOM
- Tariff range: 5–25%
- Hedging impact: ~50% volatility reduction
- Trade-off: stability vs flexibility
Regulatory and geo-risk
RoHS/REACH now list over 200 SVHCs (≈233 in 2024), while conflict minerals rules (3TG under Dodd-Frank) and evolving trade policy constrain sourcing and raise compliance costs; supplier concentration in key regions (e.g., advanced electronics nodes) elevates logistics and geopolitical risk, and compliance documentation gives qualified suppliers pricing leverage, though localizing critical inputs can reduce exposure over time.
- REACH: ≈233 SVHCs (2024)
- Conflict minerals: 3TG compliance required
- Supplier concentration ↑ geopolitical/logistics risk
- Compliance docs = supplier bargaining power
- Localization offsets risk long-term
Supplier leverage: inputs 15-40% BOM, tooling 6-12m; hedging cut volatility ~50%
Suppliers of brass, stainless, zinc die castings and PCBs exert high leverage (inputs 15–40% of BOM) due to long qualification (≥12 months), tooling lead times 6–12 months and niche capabilities; commodity swings (copper ≈US$9,500/t, resins ≈US$1,200/t in 2024) and tariffs (5–25%) compress pass-through and raise supplier power. Dual-sourcing and 2–6 week buffers mitigate risk; hedging cut realized input volatility ~50% for peers in 2024.
| Metric | Value (2024) |
|---|---|
| Input share of BOM | 15–40% |
| Copper | ≈US$9,500/tonne |
| Resin spot | ≈US$1,200/tonne |
| Tariff range | 5–25% |
| SVHC listed | ≈233 |
| Hedging effect | ~50% volatility reduction |
| Tooling lead | 6–12 months |
What is included in the product
Detailed Word Document
Comprehensive Porter's Five Forces analysis tailored to CompX, uncovering competitive intensity, buyer and supplier power, threat of entrants and substitutes, and identifying disruptive forces and strategic levers; delivered in editable Word format for use in investor materials, strategy decks, or academic projects.
Customizable Excel Spreadsheet
A concise, one-sheet CompX Porter's Five Forces summary that lets teams quickly gauge competitive pressure, customize force levels for evolving data, and drop clean radar visuals into decks—no macros or finance expertise required.
Customers Bargaining Power
OEM concentration
OEM concentration gives customers strong leverage: major marine builders and cabinet OEMs buy at scale and extract volume rebates, annual pricing clauses and design-in influence, with top OEMs like Brunswick reporting roughly $6.9 billion in 2024 revenue, underscoring their purchasing scale.
Losing a platform spec can cost CompX millions in annual revenue; customer retention thus depends on consistent product performance and strict service SLAs, driving negotiation power toward large OEMs.
Spec-in switching costs
Cutouts, keying systems and helm interfaces create technical lock-in at the spec-in level, so changing suppliers triggers redesign, integration testing and field-support requalification. Those process hurdles substantially raise time and cost barriers and reduce buyer bargaining power for entrenched programs. Multi-year platforms with lifecycles often measured in 5–30 years further entrench incumbents.
Price-sensitive RFP cycles
For standardized locks, gauges and hardware buyers run competitive bids and typically short-list 3–4 suppliers, driving aggressive price-sensitive RFP cycles. Transparent benchmarking and import alternatives amplify price pressure, with cross-border sourcing from low-cost regions intensifying competition. Value-add engineering, documented reliability data and warranty metrics are key levers to defend premium pricing. Framing purchases around total cost of ownership shifts focus beyond unit price and influences 2024 procurement decisions.
Aftermarket fragmentation
Aftermarket fragmentation means dealers and end-users purchase spares and upgrades in smaller lots, which dilutes their bargaining leverage against CompX; strong OEM branding and certified compatibility sustain pricing power and margin retention. Distribution partnerships and selective channel agreements concentrate influence among preferred resellers, shaping where negotiating pressure can emerge.
- Fragmented orders reduce buyer leverage
- Branding preserves price premiums
- Compatibility requirements lock demand
- Distribution partnerships centralize channel power
Demand cyclicality
Demand cyclicality: housing, office capex, and pleasure‑craft cycles drive order volatility; U.S. housing starts of ~1.4M units in 2024 and a rebound in recreational marine sales (+12% in 2024) tightened pricing leverage. In downturns buyers press for concessions and extended terms, though multi‑market backlogs (Q4 2024 backlog up ~8% y/y) cushion revenue swings. Strict lead‑time discipline prevents last‑minute price squeezes.
- Housing starts ~1.4M (2024)
- Pleasure‑craft sales +12% (2024)
- Backlog +8% y/y (Q4 2024)
- Lead‑time discipline reduces price pressure
Top OEM (~$6.9B) wield price/spec leverage; housing 1.4M, marine +12%
Large OEMs (eg Brunswick ~$6.9B revenue in 2024) exert strong price and spec leverage; losing a platform costs CompX millions. Technical lock‑in (cutouts, keying, helm interfaces) raises switching costs, while standardized hardware faces aggressive 3–4 vendor RFPs and import price pressure. Aftermarket fragmentation limits buyer power; housing (~1.4M starts) and marine (+12% 2024) cycles drive negotiation swings.
| Metric | 2024 |
|---|---|
| Top OEM revenue (Brunswick) | $6.9B |
| US housing starts | ~1.4M |
| Pleasure‑craft sales | +12% |
| Backlog (Q4 y/y) | +8% |
Full Version Awaits
CompX Porter's Five Forces Analysis
This preview shows the exact CompX Porter's Five Forces Analysis you'll receive immediately after purchase—no surprises or placeholders. The document displayed is fully formatted and ready for download the moment you buy. You're viewing the final version; instant access to this identical file follows payment.
Original: $10.00
-65%$10.00
$3.50Description
Go Beyond the Preview—Access the Full Strategic Report
CompX’s Porter's Five Forces snapshot highlights supplier leverage, buyer power, rivalry intensity, substitute threats, and barriers to entry—each shaping profitability and strategic choices. Our concise assessment pinpoints where CompX can defend margins or exploit weaknesses. This preview only scratches the surface. Unlock the full Porter's Five Forces Analysis to explore CompX’s competitive dynamics, market pressures, and strategic advantages in detail.
Suppliers Bargaining Power
Specialized metals and electronics
CompX depends on brass, stainless, zinc die castings and electronic components for locks and marine controls, with materials and PCBs often representing up to 40% of BOM value. Suppliers with niche alloys, precision machining or PCB capability therefore command pricing and delivery influence. Qualification cycles commonly exceed 12 months, giving approved vendors leverage. Geographic clustering of capabilities further limits alternative sourcing and increases switching costs.
Tooling-driven switching costs
Custom dies, molds and key-code systems lock CompX production to specific suppliers, with tooling lifespans commonly 5–15 years and replacement lead times often 6–12 months. Switching requires new tooling, validation and OEM requalification, driving one-off costs and revenue downtime that materially raise time-to-switch. These factors increase supplier leverage and embed vendor relationships over multi-year cycles.
Dual-sourcing mitigations
Dual-sourcing for standard fasteners, wiring and other commoditized inputs reduces dependency on single suppliers and, paired with approved vendor lists and modular designs that permit substitution within tolerances, materially balances bargaining power versus specialized vendors; maintaining strategic buffer stocks—commonly 2–6 weeks of supply—further dampens disruption risk and smooths production continuity.
Commodity price volatility
Metals and resins exhibit pronounced commodity volatility—copper averaged near US$9,500/tonne in 2024 while resin spot prices hovered around US$1,200/tonne, and tariffs of 5–25% on select inputs amplified swings; limited pass-through clauses compress margins and raise supplier leverage.
Active hedging and should-cost modelling have cut realized input volatility for some OEMs by roughly half, while longer-term contracts stabilize costs at the expense of procurement flexibility.
- Input share: 15–40% of BOM
- Tariff range: 5–25%
- Hedging impact: ~50% volatility reduction
- Trade-off: stability vs flexibility
Regulatory and geo-risk
RoHS/REACH now list over 200 SVHCs (≈233 in 2024), while conflict minerals rules (3TG under Dodd-Frank) and evolving trade policy constrain sourcing and raise compliance costs; supplier concentration in key regions (e.g., advanced electronics nodes) elevates logistics and geopolitical risk, and compliance documentation gives qualified suppliers pricing leverage, though localizing critical inputs can reduce exposure over time.
- REACH: ≈233 SVHCs (2024)
- Conflict minerals: 3TG compliance required
- Supplier concentration ↑ geopolitical/logistics risk
- Compliance docs = supplier bargaining power
- Localization offsets risk long-term
Supplier leverage: inputs 15-40% BOM, tooling 6-12m; hedging cut volatility ~50%
Suppliers of brass, stainless, zinc die castings and PCBs exert high leverage (inputs 15–40% of BOM) due to long qualification (≥12 months), tooling lead times 6–12 months and niche capabilities; commodity swings (copper ≈US$9,500/t, resins ≈US$1,200/t in 2024) and tariffs (5–25%) compress pass-through and raise supplier power. Dual-sourcing and 2–6 week buffers mitigate risk; hedging cut realized input volatility ~50% for peers in 2024.
| Metric | Value (2024) |
|---|---|
| Input share of BOM | 15–40% |
| Copper | ≈US$9,500/tonne |
| Resin spot | ≈US$1,200/tonne |
| Tariff range | 5–25% |
| SVHC listed | ≈233 |
| Hedging effect | ~50% volatility reduction |
| Tooling lead | 6–12 months |
What is included in the product
Detailed Word Document
Comprehensive Porter's Five Forces analysis tailored to CompX, uncovering competitive intensity, buyer and supplier power, threat of entrants and substitutes, and identifying disruptive forces and strategic levers; delivered in editable Word format for use in investor materials, strategy decks, or academic projects.
Customizable Excel Spreadsheet
A concise, one-sheet CompX Porter's Five Forces summary that lets teams quickly gauge competitive pressure, customize force levels for evolving data, and drop clean radar visuals into decks—no macros or finance expertise required.
Customers Bargaining Power
OEM concentration
OEM concentration gives customers strong leverage: major marine builders and cabinet OEMs buy at scale and extract volume rebates, annual pricing clauses and design-in influence, with top OEMs like Brunswick reporting roughly $6.9 billion in 2024 revenue, underscoring their purchasing scale.
Losing a platform spec can cost CompX millions in annual revenue; customer retention thus depends on consistent product performance and strict service SLAs, driving negotiation power toward large OEMs.
Spec-in switching costs
Cutouts, keying systems and helm interfaces create technical lock-in at the spec-in level, so changing suppliers triggers redesign, integration testing and field-support requalification. Those process hurdles substantially raise time and cost barriers and reduce buyer bargaining power for entrenched programs. Multi-year platforms with lifecycles often measured in 5–30 years further entrench incumbents.
Price-sensitive RFP cycles
For standardized locks, gauges and hardware buyers run competitive bids and typically short-list 3–4 suppliers, driving aggressive price-sensitive RFP cycles. Transparent benchmarking and import alternatives amplify price pressure, with cross-border sourcing from low-cost regions intensifying competition. Value-add engineering, documented reliability data and warranty metrics are key levers to defend premium pricing. Framing purchases around total cost of ownership shifts focus beyond unit price and influences 2024 procurement decisions.
Aftermarket fragmentation
Aftermarket fragmentation means dealers and end-users purchase spares and upgrades in smaller lots, which dilutes their bargaining leverage against CompX; strong OEM branding and certified compatibility sustain pricing power and margin retention. Distribution partnerships and selective channel agreements concentrate influence among preferred resellers, shaping where negotiating pressure can emerge.
- Fragmented orders reduce buyer leverage
- Branding preserves price premiums
- Compatibility requirements lock demand
- Distribution partnerships centralize channel power
Demand cyclicality
Demand cyclicality: housing, office capex, and pleasure‑craft cycles drive order volatility; U.S. housing starts of ~1.4M units in 2024 and a rebound in recreational marine sales (+12% in 2024) tightened pricing leverage. In downturns buyers press for concessions and extended terms, though multi‑market backlogs (Q4 2024 backlog up ~8% y/y) cushion revenue swings. Strict lead‑time discipline prevents last‑minute price squeezes.
- Housing starts ~1.4M (2024)
- Pleasure‑craft sales +12% (2024)
- Backlog +8% y/y (Q4 2024)
- Lead‑time discipline reduces price pressure
Top OEM (~$6.9B) wield price/spec leverage; housing 1.4M, marine +12%
Large OEMs (eg Brunswick ~$6.9B revenue in 2024) exert strong price and spec leverage; losing a platform costs CompX millions. Technical lock‑in (cutouts, keying, helm interfaces) raises switching costs, while standardized hardware faces aggressive 3–4 vendor RFPs and import price pressure. Aftermarket fragmentation limits buyer power; housing (~1.4M starts) and marine (+12% 2024) cycles drive negotiation swings.
| Metric | 2024 |
|---|---|
| Top OEM revenue (Brunswick) | $6.9B |
| US housing starts | ~1.4M |
| Pleasure‑craft sales | +12% |
| Backlog (Q4 y/y) | +8% |
Full Version Awaits
CompX Porter's Five Forces Analysis
This preview shows the exact CompX Porter's Five Forces Analysis you'll receive immediately after purchase—no surprises or placeholders. The document displayed is fully formatted and ready for download the moment you buy. You're viewing the final version; instant access to this identical file follows payment.











