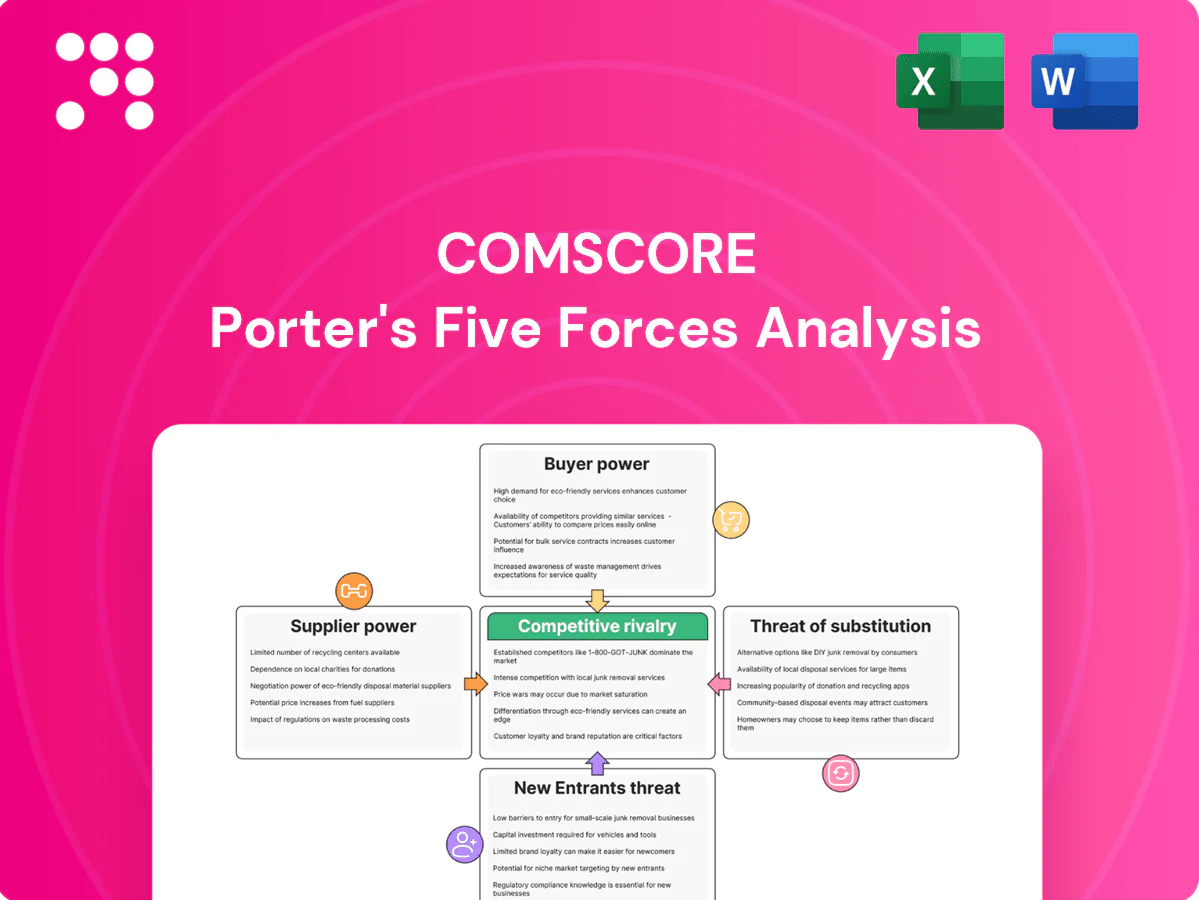
comScore Porter's Five Forces Analysis

Don't Miss the Bigger Picture
comScore faces moderate buyer power, niche supplier leverage, and rising substitute threats from privacy-first analytics, while competitive rivalry intensifies with digital ad tech rivals. This snapshot highlights key pressures and strategic levers shaping comScore’s positioning. This brief preview only scratches the surface—unlock the full Porter's Five Forces Analysis for force-by-force ratings, visuals, and actionable strategy recommendations.
Suppliers Bargaining Power

Scarce premium data
High-quality cross-platform inputs (ISP, ACR, STB, cinema POS) are limited and concentrated among a few owners; in the US the top 5 ISPs account for roughly 80% of broadband subscribers in 2024, giving those partners leverage to demand favorable terms or exclusivity. Losing a single premium source can materially reduce coverage or accuracy, elevating supplier power over pricing and data access for comScore.
Platform gatekeepers
Major platforms—Roku (≈70M active accounts), YouTube (over 2B logged‑in monthly users), Amazon/Prime Video (~200M subscribers) and smart‑TV OEMs control critical audience signals. Restrictive API access, rate limits and sudden policy shifts reduce measurement granularity and timeliness. Platforms increasingly push proprietary metrics or levy data‑access fees. This dependence elevates supplier bargaining power, squeezing independent measurement firms like comScore.

Cloud and tooling
Computation depends on hyperscalers where AWS (≈32%), Microsoft Azure (≈23%) and Google Cloud (≈11%) dominate in 2024, while specialized analytics stacks add vendor lock‑in. Reserved commitments and Savings Plans ( discounts up to ~72% for 3‑year RIs) plus egress and managed services create switching frictions. Cost pass‑throughs pressure comScore margins and vendors can negotiate from strength at renewals.

Privacy-compliant IDs
Privacy-compliant IDs (identity graphs, clean rooms, consent tech) became core supplier levers for comScore after third-party cookies; by 2024 a concentrated set of providers delivers over 60% of at-scale deterministic and probabilistic matching, and certification plus annual audits increase supplier stickiness and switching costs.
- Concentration: top providers >60% at-scale match
- Compliance: certifications + audits raise barriers
- Pricing power: compliance role boosts supplier leverage
Data quality lock-in
Data quality lock-in: historical calibration datasets and panel maintenance vendors create path dependency for comScore; clients rely on methodological continuity to preserve trend lines, making re-validation with new suppliers costly and slow. In 2024 re-validations commonly take 6–12 months and often cost hundreds of thousands to low millions per key market, increasing supplier bargaining power via switching costs.
- Path dependency: legacy calibration datasets
- Time cost: 6–12 months re-validation (2024)
- Expense: hundreds of thousands–low millions per market (2024)
- Impact: higher supplier switching power
Supplier concentration fuels pricing power: top ISPs ~80%; cloud 32/23/11; 6-12m revalidation
Suppliers are concentrated: top 5 US ISPs ~80% broadband (2024), top cloud providers AWS 32% Azure 23% GCP 11% (2024), platforms like Roku ~70M accounts and YouTube >2B users give strong leverage. Privacy-ID vendors supply >60% at-scale matching (2024). Re-validation 6–12 months costing $0.1–3M per market raises switching costs and pricing power.
| Supplier | 2024 metric | Impact |
|---|---|---|
| ISPs | Top5 ≈80% US broadband | High leverage |
| Cloud | AWS 32%/AZ 23%/GCP 11% | Cost & lock‑in |
| ID vendors | >60% at‑scale match | Switching friction |
What is included in the product
 Detailed Word Document
Tailored Porter’s Five Forces analysis for comScore that uncovers the key drivers of competitive rivalry, buyer and supplier power, substitution threats, and entry barriers shaping its market position. Includes strategic implications for pricing, margins, and growth defense.

 Customizable Excel Spreadsheet
A concise one-sheet Porter's Five Forces for comScore that lets you customize pressure levels, swap in your data, and export a radar chart—ideal for quick boardroom decisions without complex tools.
Customers Bargaining Power

Concentrated spenders
Large advertisers, agencies, networks and streamers drive outsized comScore revenue, often negotiating enterprise-wide RFPs and multi-year deals; top buyers commonly secure seven-figure annual contracts. Volume discounts and custom SLAs are standard in these agreements, with agencies bundling measurement across portfolios. Their scale translates into significant pricing power and contracting leverage over vendors like comScore.
Multi-sourcing norm
Buyers routinely run Nielsen, iSpot, VideoAmp and platform metrics side-by-side, typically comparing 2–4 providers per campaign. Side-by-side comparisons in 2024 intensified price and performance pressure, compressing vendors cross-product premiums. Vendors increasingly fund proofs and pilots to earn currency status. This dynamic erodes pricing latitude and raises go-to-market costs.

Switching is feasible
Data feeds integrate via standard APIs and clean rooms, and by 2024 about 74% of enterprises reported API-based integrations, making phased migrations by use case feasible despite nontrivial effort; contract terms commonly include opt-outs for accreditation or coverage gaps, and these provisions create a credible exit threat that strengthens buyer leverage in negotiations.

Outcome focus
Clients now demand tie-out to sales lift, reach deduplication and clear ROI; if measurement fails to move KPIs budgets reallocate. Buyers increasingly insist on guarantees and make-goods, and value-based scrutiny is compressing measurement premiums; global digital ad spend topped roughly 650 billion USD in 2024, sharpening performance demands.
- Demand: tie-out to sales lift
- Measurement: reach deduplication
- Economics: ROI-driven budget shifts
- Contracts: guarantees & make-goods
- Pricing: value scrutiny limits premiums
Regulatory pressure
Regulatory pressure for privacy and brand safety shifts legal exposure onto vendors, forcing comScore to absorb higher liability and contractual risk; over 140 jurisdictions had data protection laws by 2024. Buyers increasingly demand attestations, third-party audits, and indemnities, letting them push compliance costs and insurance onto providers, which strengthens buyer negotiating power.
- Liability shifted to vendors
- Attestations, audits, indemnities required
- Compliance costs often passed to providers
- Amplified buyer bargaining power
Buyers leverage: 74%, ~650B, 140+ laws
Large advertisers and agencies hold significant leverage, securing seven-figure deals and enterprise RFPs that compress comScore pricing. Side-by-side comparisons with Nielsen, iSpot and VideoAmp (2–4 providers) plus 74% API integration drive down premiums and raise pilot costs. Buyers demand ROI tie-outs, guarantees and indemnities amid ~650B global ad spend and 140+ data-protection jurisdictions, strengthening negotiation power.
| Metric | 2024 |
|---|---|
| API integrations | 74% |
| Global ad spend | ~650B USD |
| Data laws | 140+ |
Preview the Actual Deliverable
comScore Porter's Five Forces Analysis
This preview is the exact comScore Porter's Five Forces analysis you'll receive after purchase, fully written and formatted. It includes the same competitive intensity, supplier/buyer power, threat of substitutes, and entry barriers assessment found in the downloadable file. No placeholders—instant access to the complete document upon payment.

Don't Miss the Bigger Picture
comScore faces moderate buyer power, niche supplier leverage, and rising substitute threats from privacy-first analytics, while competitive rivalry intensifies with digital ad tech rivals. This snapshot highlights key pressures and strategic levers shaping comScore’s positioning. This brief preview only scratches the surface—unlock the full Porter's Five Forces Analysis for force-by-force ratings, visuals, and actionable strategy recommendations.
Suppliers Bargaining Power
Scarce premium data
High-quality cross-platform inputs (ISP, ACR, STB, cinema POS) are limited and concentrated among a few owners; in the US the top 5 ISPs account for roughly 80% of broadband subscribers in 2024, giving those partners leverage to demand favorable terms or exclusivity. Losing a single premium source can materially reduce coverage or accuracy, elevating supplier power over pricing and data access for comScore.
Platform gatekeepers
Major platforms—Roku (≈70M active accounts), YouTube (over 2B logged‑in monthly users), Amazon/Prime Video (~200M subscribers) and smart‑TV OEMs control critical audience signals. Restrictive API access, rate limits and sudden policy shifts reduce measurement granularity and timeliness. Platforms increasingly push proprietary metrics or levy data‑access fees. This dependence elevates supplier bargaining power, squeezing independent measurement firms like comScore.
Cloud and tooling
Computation depends on hyperscalers where AWS (≈32%), Microsoft Azure (≈23%) and Google Cloud (≈11%) dominate in 2024, while specialized analytics stacks add vendor lock‑in. Reserved commitments and Savings Plans ( discounts up to ~72% for 3‑year RIs) plus egress and managed services create switching frictions. Cost pass‑throughs pressure comScore margins and vendors can negotiate from strength at renewals.
Privacy-compliant IDs
Privacy-compliant IDs (identity graphs, clean rooms, consent tech) became core supplier levers for comScore after third-party cookies; by 2024 a concentrated set of providers delivers over 60% of at-scale deterministic and probabilistic matching, and certification plus annual audits increase supplier stickiness and switching costs.
- Concentration: top providers >60% at-scale match
- Compliance: certifications + audits raise barriers
- Pricing power: compliance role boosts supplier leverage
Data quality lock-in
Data quality lock-in: historical calibration datasets and panel maintenance vendors create path dependency for comScore; clients rely on methodological continuity to preserve trend lines, making re-validation with new suppliers costly and slow. In 2024 re-validations commonly take 6–12 months and often cost hundreds of thousands to low millions per key market, increasing supplier bargaining power via switching costs.
- Path dependency: legacy calibration datasets
- Time cost: 6–12 months re-validation (2024)
- Expense: hundreds of thousands–low millions per market (2024)
- Impact: higher supplier switching power
Supplier concentration fuels pricing power: top ISPs ~80%; cloud 32/23/11; 6-12m revalidation
Suppliers are concentrated: top 5 US ISPs ~80% broadband (2024), top cloud providers AWS 32% Azure 23% GCP 11% (2024), platforms like Roku ~70M accounts and YouTube >2B users give strong leverage. Privacy-ID vendors supply >60% at-scale matching (2024). Re-validation 6–12 months costing $0.1–3M per market raises switching costs and pricing power.
| Supplier | 2024 metric | Impact |
|---|---|---|
| ISPs | Top5 ≈80% US broadband | High leverage |
| Cloud | AWS 32%/AZ 23%/GCP 11% | Cost & lock‑in |
| ID vendors | >60% at‑scale match | Switching friction |
What is included in the product
Detailed Word Document
Tailored Porter’s Five Forces analysis for comScore that uncovers the key drivers of competitive rivalry, buyer and supplier power, substitution threats, and entry barriers shaping its market position. Includes strategic implications for pricing, margins, and growth defense.
Customizable Excel Spreadsheet
A concise one-sheet Porter's Five Forces for comScore that lets you customize pressure levels, swap in your data, and export a radar chart—ideal for quick boardroom decisions without complex tools.
Customers Bargaining Power
Concentrated spenders
Large advertisers, agencies, networks and streamers drive outsized comScore revenue, often negotiating enterprise-wide RFPs and multi-year deals; top buyers commonly secure seven-figure annual contracts. Volume discounts and custom SLAs are standard in these agreements, with agencies bundling measurement across portfolios. Their scale translates into significant pricing power and contracting leverage over vendors like comScore.
Multi-sourcing norm
Buyers routinely run Nielsen, iSpot, VideoAmp and platform metrics side-by-side, typically comparing 2–4 providers per campaign. Side-by-side comparisons in 2024 intensified price and performance pressure, compressing vendors cross-product premiums. Vendors increasingly fund proofs and pilots to earn currency status. This dynamic erodes pricing latitude and raises go-to-market costs.
Switching is feasible
Data feeds integrate via standard APIs and clean rooms, and by 2024 about 74% of enterprises reported API-based integrations, making phased migrations by use case feasible despite nontrivial effort; contract terms commonly include opt-outs for accreditation or coverage gaps, and these provisions create a credible exit threat that strengthens buyer leverage in negotiations.
Outcome focus
Clients now demand tie-out to sales lift, reach deduplication and clear ROI; if measurement fails to move KPIs budgets reallocate. Buyers increasingly insist on guarantees and make-goods, and value-based scrutiny is compressing measurement premiums; global digital ad spend topped roughly 650 billion USD in 2024, sharpening performance demands.
- Demand: tie-out to sales lift
- Measurement: reach deduplication
- Economics: ROI-driven budget shifts
- Contracts: guarantees & make-goods
- Pricing: value scrutiny limits premiums
Regulatory pressure
Regulatory pressure for privacy and brand safety shifts legal exposure onto vendors, forcing comScore to absorb higher liability and contractual risk; over 140 jurisdictions had data protection laws by 2024. Buyers increasingly demand attestations, third-party audits, and indemnities, letting them push compliance costs and insurance onto providers, which strengthens buyer negotiating power.
- Liability shifted to vendors
- Attestations, audits, indemnities required
- Compliance costs often passed to providers
- Amplified buyer bargaining power
Buyers leverage: 74%, ~650B, 140+ laws
Large advertisers and agencies hold significant leverage, securing seven-figure deals and enterprise RFPs that compress comScore pricing. Side-by-side comparisons with Nielsen, iSpot and VideoAmp (2–4 providers) plus 74% API integration drive down premiums and raise pilot costs. Buyers demand ROI tie-outs, guarantees and indemnities amid ~650B global ad spend and 140+ data-protection jurisdictions, strengthening negotiation power.
| Metric | 2024 |
|---|---|
| API integrations | 74% |
| Global ad spend | ~650B USD |
| Data laws | 140+ |
Preview the Actual Deliverable
comScore Porter's Five Forces Analysis
This preview is the exact comScore Porter's Five Forces analysis you'll receive after purchase, fully written and formatted. It includes the same competitive intensity, supplier/buyer power, threat of substitutes, and entry barriers assessment found in the downloadable file. No placeholders—instant access to the complete document upon payment.
Original: $10.00
-65%$10.00
$3.50Description
Don't Miss the Bigger Picture
comScore faces moderate buyer power, niche supplier leverage, and rising substitute threats from privacy-first analytics, while competitive rivalry intensifies with digital ad tech rivals. This snapshot highlights key pressures and strategic levers shaping comScore’s positioning. This brief preview only scratches the surface—unlock the full Porter's Five Forces Analysis for force-by-force ratings, visuals, and actionable strategy recommendations.
Suppliers Bargaining Power
Scarce premium data
High-quality cross-platform inputs (ISP, ACR, STB, cinema POS) are limited and concentrated among a few owners; in the US the top 5 ISPs account for roughly 80% of broadband subscribers in 2024, giving those partners leverage to demand favorable terms or exclusivity. Losing a single premium source can materially reduce coverage or accuracy, elevating supplier power over pricing and data access for comScore.
Platform gatekeepers
Major platforms—Roku (≈70M active accounts), YouTube (over 2B logged‑in monthly users), Amazon/Prime Video (~200M subscribers) and smart‑TV OEMs control critical audience signals. Restrictive API access, rate limits and sudden policy shifts reduce measurement granularity and timeliness. Platforms increasingly push proprietary metrics or levy data‑access fees. This dependence elevates supplier bargaining power, squeezing independent measurement firms like comScore.
Cloud and tooling
Computation depends on hyperscalers where AWS (≈32%), Microsoft Azure (≈23%) and Google Cloud (≈11%) dominate in 2024, while specialized analytics stacks add vendor lock‑in. Reserved commitments and Savings Plans ( discounts up to ~72% for 3‑year RIs) plus egress and managed services create switching frictions. Cost pass‑throughs pressure comScore margins and vendors can negotiate from strength at renewals.
Privacy-compliant IDs
Privacy-compliant IDs (identity graphs, clean rooms, consent tech) became core supplier levers for comScore after third-party cookies; by 2024 a concentrated set of providers delivers over 60% of at-scale deterministic and probabilistic matching, and certification plus annual audits increase supplier stickiness and switching costs.
- Concentration: top providers >60% at-scale match
- Compliance: certifications + audits raise barriers
- Pricing power: compliance role boosts supplier leverage
Data quality lock-in
Data quality lock-in: historical calibration datasets and panel maintenance vendors create path dependency for comScore; clients rely on methodological continuity to preserve trend lines, making re-validation with new suppliers costly and slow. In 2024 re-validations commonly take 6–12 months and often cost hundreds of thousands to low millions per key market, increasing supplier bargaining power via switching costs.
- Path dependency: legacy calibration datasets
- Time cost: 6–12 months re-validation (2024)
- Expense: hundreds of thousands–low millions per market (2024)
- Impact: higher supplier switching power
Supplier concentration fuels pricing power: top ISPs ~80%; cloud 32/23/11; 6-12m revalidation
Suppliers are concentrated: top 5 US ISPs ~80% broadband (2024), top cloud providers AWS 32% Azure 23% GCP 11% (2024), platforms like Roku ~70M accounts and YouTube >2B users give strong leverage. Privacy-ID vendors supply >60% at-scale matching (2024). Re-validation 6–12 months costing $0.1–3M per market raises switching costs and pricing power.
| Supplier | 2024 metric | Impact |
|---|---|---|
| ISPs | Top5 ≈80% US broadband | High leverage |
| Cloud | AWS 32%/AZ 23%/GCP 11% | Cost & lock‑in |
| ID vendors | >60% at‑scale match | Switching friction |
What is included in the product
Detailed Word Document
Tailored Porter’s Five Forces analysis for comScore that uncovers the key drivers of competitive rivalry, buyer and supplier power, substitution threats, and entry barriers shaping its market position. Includes strategic implications for pricing, margins, and growth defense.
Customizable Excel Spreadsheet
A concise one-sheet Porter's Five Forces for comScore that lets you customize pressure levels, swap in your data, and export a radar chart—ideal for quick boardroom decisions without complex tools.
Customers Bargaining Power
Concentrated spenders
Large advertisers, agencies, networks and streamers drive outsized comScore revenue, often negotiating enterprise-wide RFPs and multi-year deals; top buyers commonly secure seven-figure annual contracts. Volume discounts and custom SLAs are standard in these agreements, with agencies bundling measurement across portfolios. Their scale translates into significant pricing power and contracting leverage over vendors like comScore.
Multi-sourcing norm
Buyers routinely run Nielsen, iSpot, VideoAmp and platform metrics side-by-side, typically comparing 2–4 providers per campaign. Side-by-side comparisons in 2024 intensified price and performance pressure, compressing vendors cross-product premiums. Vendors increasingly fund proofs and pilots to earn currency status. This dynamic erodes pricing latitude and raises go-to-market costs.
Switching is feasible
Data feeds integrate via standard APIs and clean rooms, and by 2024 about 74% of enterprises reported API-based integrations, making phased migrations by use case feasible despite nontrivial effort; contract terms commonly include opt-outs for accreditation or coverage gaps, and these provisions create a credible exit threat that strengthens buyer leverage in negotiations.
Outcome focus
Clients now demand tie-out to sales lift, reach deduplication and clear ROI; if measurement fails to move KPIs budgets reallocate. Buyers increasingly insist on guarantees and make-goods, and value-based scrutiny is compressing measurement premiums; global digital ad spend topped roughly 650 billion USD in 2024, sharpening performance demands.
- Demand: tie-out to sales lift
- Measurement: reach deduplication
- Economics: ROI-driven budget shifts
- Contracts: guarantees & make-goods
- Pricing: value scrutiny limits premiums
Regulatory pressure
Regulatory pressure for privacy and brand safety shifts legal exposure onto vendors, forcing comScore to absorb higher liability and contractual risk; over 140 jurisdictions had data protection laws by 2024. Buyers increasingly demand attestations, third-party audits, and indemnities, letting them push compliance costs and insurance onto providers, which strengthens buyer negotiating power.
- Liability shifted to vendors
- Attestations, audits, indemnities required
- Compliance costs often passed to providers
- Amplified buyer bargaining power
Buyers leverage: 74%, ~650B, 140+ laws
Large advertisers and agencies hold significant leverage, securing seven-figure deals and enterprise RFPs that compress comScore pricing. Side-by-side comparisons with Nielsen, iSpot and VideoAmp (2–4 providers) plus 74% API integration drive down premiums and raise pilot costs. Buyers demand ROI tie-outs, guarantees and indemnities amid ~650B global ad spend and 140+ data-protection jurisdictions, strengthening negotiation power.
| Metric | 2024 |
|---|---|
| API integrations | 74% |
| Global ad spend | ~650B USD |
| Data laws | 140+ |
Preview the Actual Deliverable
comScore Porter's Five Forces Analysis
This preview is the exact comScore Porter's Five Forces analysis you'll receive after purchase, fully written and formatted. It includes the same competitive intensity, supplier/buyer power, threat of substitutes, and entry barriers assessment found in the downloadable file. No placeholders—instant access to the complete document upon payment.











