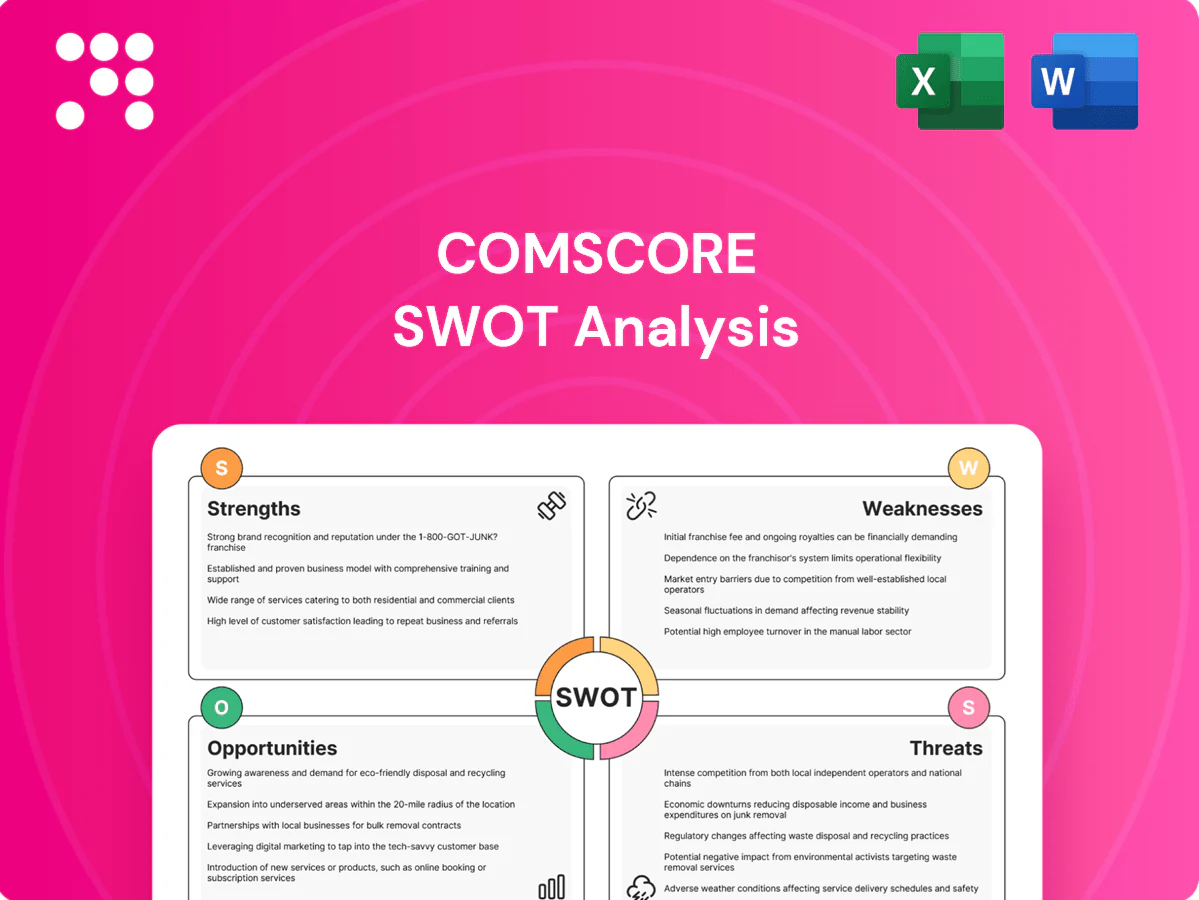
comScore SWOT Analysis

Your Strategic Toolkit Starts Here
comScore’s SWOT highlights strong analytics capabilities, expansive cross-platform measurement and valuable publisher/ad relationships, balanced by legacy tech constraints and competitive pressure from Nielsen and digital-first challengers. Opportunities include programmatic advertising growth and international expansion, while regulatory shifts and privacy trends pose risks to data collection and revenue models. Discover the complete picture with our full SWOT—professionally formatted Word and Excel deliverables to support strategic decisions and investment pitches.
Strengths

Cross-platform measurement leadership
comScore combines digital, TV and cinema datasets to deliver unified audience metrics, enabling a cross-screen view that helps advertisers and media owners optimize reach and frequency.
That cross-platform measurement differentiates comScore across planning, activation and attribution workflows by offering a consistent taxonomy and comparable metrics across channels.
Clients consistently cite the uniform cross-channel comparability as a key strength in campaign evaluation and media buying.
Robust audience panels and data assets
comScore combines representative panels with census-level device and tagging data to calibrate behavior at scale, leveraging millions of panelists alongside device-level census inputs. This hybrid methodology reduces biases found in pure-cookie or pure-panel approaches and improves cross-platform accuracy. Rich longitudinal datasets enable trend analysis and cohort insights, providing the stable benchmarks and forecasting foundations relied on by advertisers and publishers.

Industry relationships and accreditation
Deep ties with broadcasters, publishers, agencies and platforms embed comScore into deals and guarantees, supporting measurement across 75+ countries and integration with many broadcast currencies. Third-party validations and certifications bolster trust in reported metrics among top 100 advertisers and agencies. These relationships shorten sales cycles and drive stronger renewals, while being currency-adjacent enhances direct monetization opportunities.

Advertising effectiveness and outcomes focus
comScore links exposure to brand lift and sales proxies rather than counting impressions alone, giving advertisers outcome-based analytics that prove ROI under budget pressure. This focus supports pricing power versus pure reach metrics and enables full-funnel decisioning from awareness to conversion.
Global footprint and vertical diversification
comScore serves media, entertainment and advertising across 75+ countries, reducing dependence on any single market or channel. Its portfolio spans cinema, CTV and digital products, smoothing revenue cyclicality and capturing ad-shift dynamics. Global scale provides richer benchmarks and cross-market insights that strengthen measurement accuracy and client value.
- Global presence: 75+ countries
- Vertical mix: cinema, CTV, digital
- Risk mitigation: lower single-market reliance
- Data advantage: cross-market benchmarks
Cross-screen metrics, accurate reach and frequency across 75+ countries
comScore provides unified cross-screen measurement across digital, TV and cinema, giving advertisers consistent reach and frequency metrics used in planning, activation and attribution.
Its hybrid methodology blends millions of representative panelists with census-level device and tagging data to reduce bias and improve cross-platform accuracy.
Deep broadcaster, publisher and agency integrations across 75+ countries and adoption by top 100 advertisers support currency-level measurement and stronger pricing power.
| Metric | Value |
|---|---|
| Countries | 75+ |
| Panelists | Millions |
| Key Clients | Top 100 advertisers |
| Products | Cinema, CTV, Digital |
What is included in the product
 Detailed Word Document
Provides a concise SWOT analysis of comScore, highlighting its core strengths, operational weaknesses, market opportunities, and external threats to evaluate strategic positioning and growth prospects.

 Customizable Excel Spreadsheet
Provides a focused comScore SWOT matrix for rapid competitive and audience-measurement insight, enabling quick alignment of digital measurement strategies across teams.
Weaknesses

Reliance on third-party data signals
Reliance on third-party data signals leaves comScore exposed when platform policy changes constrain data ingestion, reducing reachable inventories and historical continuity. Signal losses from third-party cookies, mobile IDs and device graphs have driven industry estimates of a 30–50% decline in deterministic matching, degrading attribution precision. That increases integration and modeling costs and can slow product roadmap execution by months as engineering reallocates resources.
Competitive brand perception vs. giants
Rivals like Nielsen, Google and Meta dominate mindshare and scale—Google and Meta captured roughly 60–65% of global digital ad spend of about $600B in 2024, squeezing measurement vendors. comScore must fight for currency status on buyer preferred-vendor lists; perception gaps lengthen RFPs and force price concessions. Ongoing marketing and measurable proof points are required to regain parity.

Complexity of methodology and transparency demands
comScore's hybrid measurement is difficult to explain to non-technical buyers, and with industry surveys in 2024 showing over 70% of advertisers demanding auditable, granular transparency, the complexity can slow adoption and limit account expansion; rising demands for auditability and training push support and education costs higher, squeezing margins and elongating sales cycles.

Exposure to ad spend cycles
Exposure to ad spend cycles means comScore's measurement revenues move with media and marketing budgets, so downturns erode upsell and usage-based fees and lengthen enterprise sales cycles, straining cash flow and making forecasting less reliable in volatile markets.
- Correlation: measurement revenue tied to ad budgets
- Risk: downturns cut upsell/usage fees
- Cash: longer sales cycles pressure liquidity
- Forecasting: higher volatility, lower predictability
Legacy tech and integration burdens
Maintaining legacy platforms alongside new feature builds increases technical debt, while bespoke integrations for large clients slow scaling and raise deployment costs; resulting data latency and interoperability issues have been linked to lower customer experience scores and higher churn risks.
- Legacy platforms → higher technical debt
- Custom integrations → slower scale
- Data latency/interop → reduced NPS
- Higher churn/renewal risk
Signal loss: matching down 30–50%; audits by >70%
Reliance on third-party signals risks inventory loss and 30–50% drops in deterministic matching, raising modeling costs and delaying roadmaps. Google/Meta captured ~60–65% of global digital ad spend (~$600B in 2024), squeezing measurement vendors and pricing power. Over 70% of advertisers in 2024 demand auditable transparency, increasing support and audit costs.
| Metric | Impact | Data |
|---|---|---|
| Deterministic matching | Precision loss | 30–50% decline |
| Market concentration | Pricing pressure | 60–65% of $600B (2024) |
| Audit demand | Support costs | >70% advertisers (2024) |
Preview the Actual Deliverable
comScore SWOT Analysis
This is the actual comScore SWOT analysis document you’ll receive upon purchase—no surprises, just professional quality. The preview below is taken directly from the full report and reflects the structure and insights included. Buy now to unlock the complete, editable version.

Your Strategic Toolkit Starts Here
comScore’s SWOT highlights strong analytics capabilities, expansive cross-platform measurement and valuable publisher/ad relationships, balanced by legacy tech constraints and competitive pressure from Nielsen and digital-first challengers. Opportunities include programmatic advertising growth and international expansion, while regulatory shifts and privacy trends pose risks to data collection and revenue models. Discover the complete picture with our full SWOT—professionally formatted Word and Excel deliverables to support strategic decisions and investment pitches.
Strengths
Cross-platform measurement leadership
comScore combines digital, TV and cinema datasets to deliver unified audience metrics, enabling a cross-screen view that helps advertisers and media owners optimize reach and frequency.
That cross-platform measurement differentiates comScore across planning, activation and attribution workflows by offering a consistent taxonomy and comparable metrics across channels.
Clients consistently cite the uniform cross-channel comparability as a key strength in campaign evaluation and media buying.
Robust audience panels and data assets
comScore combines representative panels with census-level device and tagging data to calibrate behavior at scale, leveraging millions of panelists alongside device-level census inputs. This hybrid methodology reduces biases found in pure-cookie or pure-panel approaches and improves cross-platform accuracy. Rich longitudinal datasets enable trend analysis and cohort insights, providing the stable benchmarks and forecasting foundations relied on by advertisers and publishers.
Industry relationships and accreditation
Deep ties with broadcasters, publishers, agencies and platforms embed comScore into deals and guarantees, supporting measurement across 75+ countries and integration with many broadcast currencies. Third-party validations and certifications bolster trust in reported metrics among top 100 advertisers and agencies. These relationships shorten sales cycles and drive stronger renewals, while being currency-adjacent enhances direct monetization opportunities.
Advertising effectiveness and outcomes focus
comScore links exposure to brand lift and sales proxies rather than counting impressions alone, giving advertisers outcome-based analytics that prove ROI under budget pressure. This focus supports pricing power versus pure reach metrics and enables full-funnel decisioning from awareness to conversion.
Global footprint and vertical diversification
comScore serves media, entertainment and advertising across 75+ countries, reducing dependence on any single market or channel. Its portfolio spans cinema, CTV and digital products, smoothing revenue cyclicality and capturing ad-shift dynamics. Global scale provides richer benchmarks and cross-market insights that strengthen measurement accuracy and client value.
- Global presence: 75+ countries
- Vertical mix: cinema, CTV, digital
- Risk mitigation: lower single-market reliance
- Data advantage: cross-market benchmarks
Cross-screen metrics, accurate reach and frequency across 75+ countries
comScore provides unified cross-screen measurement across digital, TV and cinema, giving advertisers consistent reach and frequency metrics used in planning, activation and attribution.
Its hybrid methodology blends millions of representative panelists with census-level device and tagging data to reduce bias and improve cross-platform accuracy.
Deep broadcaster, publisher and agency integrations across 75+ countries and adoption by top 100 advertisers support currency-level measurement and stronger pricing power.
| Metric | Value |
|---|---|
| Countries | 75+ |
| Panelists | Millions |
| Key Clients | Top 100 advertisers |
| Products | Cinema, CTV, Digital |
What is included in the product
Detailed Word Document
Provides a concise SWOT analysis of comScore, highlighting its core strengths, operational weaknesses, market opportunities, and external threats to evaluate strategic positioning and growth prospects.
Customizable Excel Spreadsheet
Provides a focused comScore SWOT matrix for rapid competitive and audience-measurement insight, enabling quick alignment of digital measurement strategies across teams.
Weaknesses
Reliance on third-party data signals
Reliance on third-party data signals leaves comScore exposed when platform policy changes constrain data ingestion, reducing reachable inventories and historical continuity. Signal losses from third-party cookies, mobile IDs and device graphs have driven industry estimates of a 30–50% decline in deterministic matching, degrading attribution precision. That increases integration and modeling costs and can slow product roadmap execution by months as engineering reallocates resources.
Competitive brand perception vs. giants
Rivals like Nielsen, Google and Meta dominate mindshare and scale—Google and Meta captured roughly 60–65% of global digital ad spend of about $600B in 2024, squeezing measurement vendors. comScore must fight for currency status on buyer preferred-vendor lists; perception gaps lengthen RFPs and force price concessions. Ongoing marketing and measurable proof points are required to regain parity.
Complexity of methodology and transparency demands
comScore's hybrid measurement is difficult to explain to non-technical buyers, and with industry surveys in 2024 showing over 70% of advertisers demanding auditable, granular transparency, the complexity can slow adoption and limit account expansion; rising demands for auditability and training push support and education costs higher, squeezing margins and elongating sales cycles.
Exposure to ad spend cycles
Exposure to ad spend cycles means comScore's measurement revenues move with media and marketing budgets, so downturns erode upsell and usage-based fees and lengthen enterprise sales cycles, straining cash flow and making forecasting less reliable in volatile markets.
- Correlation: measurement revenue tied to ad budgets
- Risk: downturns cut upsell/usage fees
- Cash: longer sales cycles pressure liquidity
- Forecasting: higher volatility, lower predictability
Legacy tech and integration burdens
Maintaining legacy platforms alongside new feature builds increases technical debt, while bespoke integrations for large clients slow scaling and raise deployment costs; resulting data latency and interoperability issues have been linked to lower customer experience scores and higher churn risks.
- Legacy platforms → higher technical debt
- Custom integrations → slower scale
- Data latency/interop → reduced NPS
- Higher churn/renewal risk
Signal loss: matching down 30–50%; audits by >70%
Reliance on third-party signals risks inventory loss and 30–50% drops in deterministic matching, raising modeling costs and delaying roadmaps. Google/Meta captured ~60–65% of global digital ad spend (~$600B in 2024), squeezing measurement vendors and pricing power. Over 70% of advertisers in 2024 demand auditable transparency, increasing support and audit costs.
| Metric | Impact | Data |
|---|---|---|
| Deterministic matching | Precision loss | 30–50% decline |
| Market concentration | Pricing pressure | 60–65% of $600B (2024) |
| Audit demand | Support costs | >70% advertisers (2024) |
Preview the Actual Deliverable
comScore SWOT Analysis
This is the actual comScore SWOT analysis document you’ll receive upon purchase—no surprises, just professional quality. The preview below is taken directly from the full report and reflects the structure and insights included. Buy now to unlock the complete, editable version.
Description
Your Strategic Toolkit Starts Here
comScore’s SWOT highlights strong analytics capabilities, expansive cross-platform measurement and valuable publisher/ad relationships, balanced by legacy tech constraints and competitive pressure from Nielsen and digital-first challengers. Opportunities include programmatic advertising growth and international expansion, while regulatory shifts and privacy trends pose risks to data collection and revenue models. Discover the complete picture with our full SWOT—professionally formatted Word and Excel deliverables to support strategic decisions and investment pitches.
Strengths
Cross-platform measurement leadership
comScore combines digital, TV and cinema datasets to deliver unified audience metrics, enabling a cross-screen view that helps advertisers and media owners optimize reach and frequency.
That cross-platform measurement differentiates comScore across planning, activation and attribution workflows by offering a consistent taxonomy and comparable metrics across channels.
Clients consistently cite the uniform cross-channel comparability as a key strength in campaign evaluation and media buying.
Robust audience panels and data assets
comScore combines representative panels with census-level device and tagging data to calibrate behavior at scale, leveraging millions of panelists alongside device-level census inputs. This hybrid methodology reduces biases found in pure-cookie or pure-panel approaches and improves cross-platform accuracy. Rich longitudinal datasets enable trend analysis and cohort insights, providing the stable benchmarks and forecasting foundations relied on by advertisers and publishers.
Industry relationships and accreditation
Deep ties with broadcasters, publishers, agencies and platforms embed comScore into deals and guarantees, supporting measurement across 75+ countries and integration with many broadcast currencies. Third-party validations and certifications bolster trust in reported metrics among top 100 advertisers and agencies. These relationships shorten sales cycles and drive stronger renewals, while being currency-adjacent enhances direct monetization opportunities.
Advertising effectiveness and outcomes focus
comScore links exposure to brand lift and sales proxies rather than counting impressions alone, giving advertisers outcome-based analytics that prove ROI under budget pressure. This focus supports pricing power versus pure reach metrics and enables full-funnel decisioning from awareness to conversion.
Global footprint and vertical diversification
comScore serves media, entertainment and advertising across 75+ countries, reducing dependence on any single market or channel. Its portfolio spans cinema, CTV and digital products, smoothing revenue cyclicality and capturing ad-shift dynamics. Global scale provides richer benchmarks and cross-market insights that strengthen measurement accuracy and client value.
- Global presence: 75+ countries
- Vertical mix: cinema, CTV, digital
- Risk mitigation: lower single-market reliance
- Data advantage: cross-market benchmarks
Cross-screen metrics, accurate reach and frequency across 75+ countries
comScore provides unified cross-screen measurement across digital, TV and cinema, giving advertisers consistent reach and frequency metrics used in planning, activation and attribution.
Its hybrid methodology blends millions of representative panelists with census-level device and tagging data to reduce bias and improve cross-platform accuracy.
Deep broadcaster, publisher and agency integrations across 75+ countries and adoption by top 100 advertisers support currency-level measurement and stronger pricing power.
| Metric | Value |
|---|---|
| Countries | 75+ |
| Panelists | Millions |
| Key Clients | Top 100 advertisers |
| Products | Cinema, CTV, Digital |
What is included in the product
Detailed Word Document
Provides a concise SWOT analysis of comScore, highlighting its core strengths, operational weaknesses, market opportunities, and external threats to evaluate strategic positioning and growth prospects.
Customizable Excel Spreadsheet
Provides a focused comScore SWOT matrix for rapid competitive and audience-measurement insight, enabling quick alignment of digital measurement strategies across teams.
Weaknesses
Reliance on third-party data signals
Reliance on third-party data signals leaves comScore exposed when platform policy changes constrain data ingestion, reducing reachable inventories and historical continuity. Signal losses from third-party cookies, mobile IDs and device graphs have driven industry estimates of a 30–50% decline in deterministic matching, degrading attribution precision. That increases integration and modeling costs and can slow product roadmap execution by months as engineering reallocates resources.
Competitive brand perception vs. giants
Rivals like Nielsen, Google and Meta dominate mindshare and scale—Google and Meta captured roughly 60–65% of global digital ad spend of about $600B in 2024, squeezing measurement vendors. comScore must fight for currency status on buyer preferred-vendor lists; perception gaps lengthen RFPs and force price concessions. Ongoing marketing and measurable proof points are required to regain parity.
Complexity of methodology and transparency demands
comScore's hybrid measurement is difficult to explain to non-technical buyers, and with industry surveys in 2024 showing over 70% of advertisers demanding auditable, granular transparency, the complexity can slow adoption and limit account expansion; rising demands for auditability and training push support and education costs higher, squeezing margins and elongating sales cycles.
Exposure to ad spend cycles
Exposure to ad spend cycles means comScore's measurement revenues move with media and marketing budgets, so downturns erode upsell and usage-based fees and lengthen enterprise sales cycles, straining cash flow and making forecasting less reliable in volatile markets.
- Correlation: measurement revenue tied to ad budgets
- Risk: downturns cut upsell/usage fees
- Cash: longer sales cycles pressure liquidity
- Forecasting: higher volatility, lower predictability
Legacy tech and integration burdens
Maintaining legacy platforms alongside new feature builds increases technical debt, while bespoke integrations for large clients slow scaling and raise deployment costs; resulting data latency and interoperability issues have been linked to lower customer experience scores and higher churn risks.
- Legacy platforms → higher technical debt
- Custom integrations → slower scale
- Data latency/interop → reduced NPS
- Higher churn/renewal risk
Signal loss: matching down 30–50%; audits by >70%
Reliance on third-party signals risks inventory loss and 30–50% drops in deterministic matching, raising modeling costs and delaying roadmaps. Google/Meta captured ~60–65% of global digital ad spend (~$600B in 2024), squeezing measurement vendors and pricing power. Over 70% of advertisers in 2024 demand auditable transparency, increasing support and audit costs.
| Metric | Impact | Data |
|---|---|---|
| Deterministic matching | Precision loss | 30–50% decline |
| Market concentration | Pricing pressure | 60–65% of $600B (2024) |
| Audit demand | Support costs | >70% advertisers (2024) |
Preview the Actual Deliverable
comScore SWOT Analysis
This is the actual comScore SWOT analysis document you’ll receive upon purchase—no surprises, just professional quality. The preview below is taken directly from the full report and reflects the structure and insights included. Buy now to unlock the complete, editable version.











